. 2024 Oct;11(40):e2407069.
doi: 10.1002/advs.202407069. Epub 2024 Sep 3.

Platelet-Derived Growth Factor C Facilitates Malignant Behavior of Pancreatic Ductal Adenocarcinoma by Regulating SREBP1 Mediated Lipid Metabolism

Affiliations

Platelet-Derived Growth Factor C Facilitates Malignant Behavior of Pancreatic Ductal Adenocarcinoma by Regulating SREBP1 Mediated Lipid Metabolism

Yin-Hao Shi et al. Adv Sci (Weinh). 2024 Oct.

Abstract

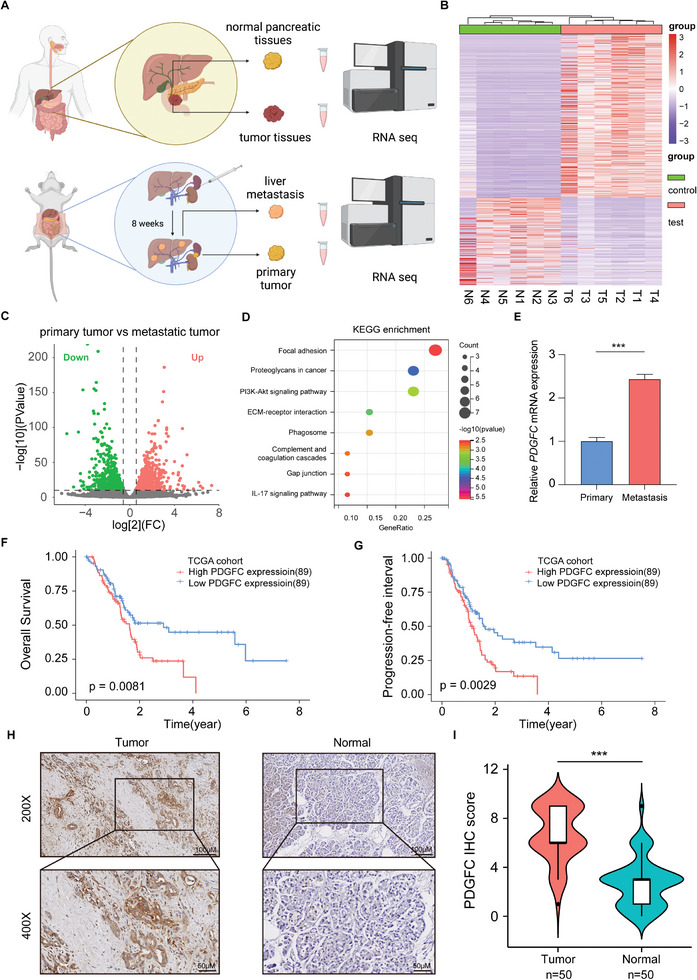
Lipid metabolism reprogramming stands as a fundamental hallmark of cancer cells. Unraveling the core regulators of lipid biosynthesis holds the potential to find promising therapeutic targets in pancreatic ductal adenocarcinoma (PDAC). Here, it is demonstrated that platelet-derived growth factor C (PDGFC) orchestrated lipid metabolism, thereby facilitated the malignant progression of PDAC. Expression of PDGFC is upregulated in PDAC cohorts and is corelated with a poor prognosis. Aberrantly high expression of PDGFC promoted proliferation and metastasis of PDAC both in vitro and in vivo. Mechanistically, PDGFC accelerated the malignant progression of PDAC by upregulating fatty acid accumulation through sterol regulatory element-binding protein 1 (SREBP1), a key transcription factor in lipid metabolism. Remarkably, Betulin, an inhibitor of SREBP1, demonstrated the capability to inhibit proliferation and metastasis of PDAC cell lines, along with attenuating the process of liver metastasis in vivo. Overall, the study underscores the pivotal role of PDGFC-mediated lipid metabolism in PDAC progression, suggesting PDGFC as a potential biomarker for PDAC metastasis. Targeting PDGFC-induced lipid metabolism emerges as a promising therapeutic strategy for metastatic PDAC, with the potential to improve clinical outcomes.

Keywords: PDAC; PDGFC; SREBP1; lipid metabolism; metastasis.


Conflict of interest statement

The authors declare no conflict of interest.

Figures

Figure 1
Figure 1
PDGFC stands as a potential predictor of proliferation and metastasis in PDAC. A) Schematic diagram of RNA sequencing in PDAC tumor tissues and liver metastatic tumors created with BioRender.com. B) Heatmap of the DEGs in RNA sequencing results of 6 pairs of pancreatic tumor tissues and adjacent tumor tissues. C) Volcano plot of DEGs in RNA sequencing results of primary tumors and liver metastatic tumors. D) KEGG enrichment results of commonly upregulated DEGs in pancreatic tumor tissues and liver metastasis tissues. E) The mRNA levels of PDGFC are significantly elevated in liver metastatic tumors compared to primary tumors. F) High expression of PDGFC is negatively correlated with the overall survival of PDAC patients from TCGA dataset. G) High expression of PDGFC is negatively correlated with the progression‐free interval of PDAC patients from TCGA dataset. H) Representative images of immunohistochemical (IHC) staining results for 50 pairs of pancreatic tumor tissues and normal tissues. I) Statistical results of IHC staining for 50 pairs of pancreatic tumor tissues and normal tissues. Data are presented as mean ± SD (n = 3 in E) *** p < 0.001 according to Student's t‐test.
Figure 2
Figure 2
PDGFC promotes PDAC progression in vitro. A) The mRNA level of BxPC‐3 and SW1990 cells after PDGFC silencing confirmed by RT‐qPCR. B) The protein level of BxPC‐3 and SW1990 cells after PDGFC silencing confirmed by western blotting. C) Cell growth curve of BxPC‐3 and SW1990 cells transfected with PDGFC shRNA or shControl. D) Cell migration and invasion ability of BxPC‐3 cells after shPDGFC transfection. E) Cell migration and invasion ability of SW1990 cells after shPDGFC transfection. F) Colony‐forming assays of PDAC cells after PDGFC silencing. G) Apoptotic assays of BxPC‐3 cells after transfected with shPDGFC or shControl. H) Cell growth curve of BxPC‐3 and SW1990 cells treated different doses of human recombinant PDGFC protein. I) Cell migration and invasion ability treated with different doses of human recombinant PDGFC protein in BxPC‐3 cells. J) Cell migration and invasion ability treated with different doses of human recombinant PDGFC protein in SW1990 cells. K) Colony‐forming assays of BxPC‐3 and SW1990 cells treated with different doses of human recombinant PDGFC protein. Data are presented as mean ± SD (n = 3). * p < 0.05; ** p < 0.01; *** p < 0.001 according to Student's t‐test.
Figure 3
Figure 3
Depletion of PDGFC impairs the malignant behavior of PDAC in vivo. A) Schematic diagram of xenografts in BALB/c nude mice by inoculating PDAC cells transfected with shControl or shPDGFC at their right axillae. B) Xenograft tumors derived from BxPC‐3 and SW1990 cells were shown. C) Tumor growth curves after the injection of PDAC cells transfected with shControl or shPDGFC. D) Tumor weight of each group. E) Representative IHC staining of Ki67 in tumors from each group. F) Statistical analysis of IHC staining of Ki67 in tumors from each group. G) Representative images of TUNEL apoptotic assay from different group. H) Statistical analysis of TUNEL apoptotic assay from different group. Data are presented as mean ± SD (n = 5). ** p < 0.01; *** p < 0.001 according to Student's t‐test.
Figure 4
Figure 4
Fatty acid metabolism is a downstream crucial target of PDGFC in PDAC. A) Heatmap showing the expression changes between shControl and shPDGFC group in BxPC‐3 cells. B) Volcano plot showing the upregulated and downregulated genes after PDGFC silencing or not. C) KEGG enrichment of DEGs between shControl and shPDGFC cells. D) GSEA enrichment results suggest an association between PDGFC and fatty acid biosynthetic process. E) GSEA enrichment results suggest an association between PDGFC and lipid storage. F) GSEA enrichment results suggest an association between PDGFC and fatty acid beta‐oxidation. G) The mRNA levels of lipid synthesis‐relatedkey genes after PDGFC knockdown in SW1990 cells. H) The intracellular triglyceride level in BxPC‐3 and SW1990 cells transfected with PDGFC or shControl. I) Representative images of Nile red staining in BxPC‐3 cells transfected with PDGFC or shControl. J) Representative images of Nile red staining in SW1990 cells transfected with PDGFC or shControl. Data are presented as mean ± SD (n = 3 in G and H). * p < 0.05; ** p < 0.01; *** p < 0.001 according to Student's t‐test.
Figure 5
Figure 5
PDGFC regulates SREBP1 via PI3K/AKT signaling pathway to promote lipid biosynthesis. A) GO molecular function enrichment of DEGs in BxPC‐3 cells silencing PDGFC or not. B) The mRNA level of SREBF1 between PDAC tumor tissue or normal tissue in GEPIA2 database. C) The mRNA level of SREBF1 after PDGFC silencing in SW1990 cells. D) KEGG enrichment of DEGs after PDGFC silencing or not. E) GSEA enrichment results suggest PI3K/AKT signaling pathway is the downstream target of PDGFC. F) The protein level of PDGFR/PI3K/AKT signaling pathway and SREBP1 after PDGFC silencing were confirmed by western blotting. G) The mRNA level of SREBF1 after capivasertib treatment in PDAC cells. H) The protein level of SREBP1 after capivasertib treatment in PDAC cells. I) The protein level of PDGFC, AKT, p‐AKT, and SREBP1 with different treatment in PDAC cells. J) Representative images of IHC in xenograft tumors about p‐AKT and SREBP1. K) Statistical analysis of IHC staining. Data are presented as mean ± SD (n = 3 in C and G, n = 5 in J and K). * p < 0.05; ** p < 0.01; *** p < 0.001 according to Student's t‐test.
Figure 6
Figure 6
PDGFC facilitates PDAC progression by upregulating SREBP1 expression. A) The mRNA and protein level after SREBF1 overexpression in BxPC‐3 and SW1990 cells. B) Cell growth curve after SREBF1 overexpression in PDAC cells. C) Cell migration and invasion ability after SREBF1 overexpression in BxPC‐3 cells. D) Cell migration and invasion ability after SREBF1 overexpression in SW1990 cells. E) The mRNA level after PDGFC silencing and PDGFC silencing with SREBF1 overexpression confirmed by RT‐qPCR. F) The protein level after PDGFC silencing and PDGFC silencing with SREBF1 overexpression confirmed by western blotting. G) Cell growth curve after PDGFC silencing and PDGFC silencing with SREBF1 overexpression. H) Statistical analysis of cell migration and invasion ability. I) Representative images of cell migration and invasion ability in BxPC‐3 and SW1990 cells. Data are presented as mean ± SD (n = 3). * p < 0.05; ** p < 0.01; *** p < 0.001 according to Student's t‐test.
Figure 7
Figure 7
The lipid metabolic inhibitor betulin effectively mitigates the metastatic process of PDAC. A) Representative images of Nile red staining in BxPC‐3 cells treated with indicated dose of betulin. B) Intracellular triglyceride level in BxPC‐3 cells treated with indicated dose of betulin. C) Cell growth curve of BxPC‐3 cells treated with indicated dose of betulin. D) Cell migration and invasion ability of BxPC‐3 cells treated with indicated dose of betulin. E) Cell apoptotic rate of BxPC‐3 cells treated with indicated dose of betulin. F) The fluorescent intensity with different number of BxPC‐3 cells. G) The diagram of construction of PDAC liver metastasis model created with BioRender.com. H) Bioluminescent images of livers and statistical analysis of fluorescent intensity from different treatment group. I) Representative liver images of HE staining from different group. J) Schematic illustration of the proposed model, showing PDGFC upregulates SREBP1 induced lipid synthesis via PI3K/AKT signaling pathway, thereby promoting proliferation and metastasis of PDAC. The graphic was created with BioRender.com. Data are presented as mean ± SD (n = 3 in B–E and n = 5 in H). * p < 0.05; ** p < 0.01; *** p < 0.001 according to Student's t‐test.

References

    1. Kleeff J., Korc M., Apte M., La Vecchia C., Johnson C. D., Biankin A. V., Neale R. E., Tempero M., Tuveson D. A., Hruban R. H., Neoptolemos J. P., Nat. Rev. Dis. Primers 2016, 2, 16022. - PubMed
    1. Stathis A., Moore M. J., Nat. Rev. Clin. Oncol. 2010, 7, 163. - PubMed
    1. Lowery F. J., Yu D., Cancer Metastasis Rev. 2012, 31, 479. - PubMed
    1. Seruga B., Zhang H., Bernstein L. J., Tannock I. F., Nat. Rev. Cancer 2008, 8, 887. - PubMed
    1. Zou X., Tang X. Y., Qu Z. Y., Sun Z. W., Ji C. F., Li Y. J., Guo S. D., Int. J. Biol. Macromol. 2022, 202, 539. - PubMed

MeSH terms

Substances

LinkOut - more resources