. 2024 Nov 8;9(21):e181067.
doi: 10.1172/jci.insight.181067.

A therapeutic HBV vaccine containing a checkpoint modifier enhances CD8+ T cell and antiviral responses

Affiliations

A therapeutic HBV vaccine containing a checkpoint modifier enhances CD8+ T cell and antiviral responses

Mohadeseh Hasanpourghadi et al. JCI Insight. .

Abstract

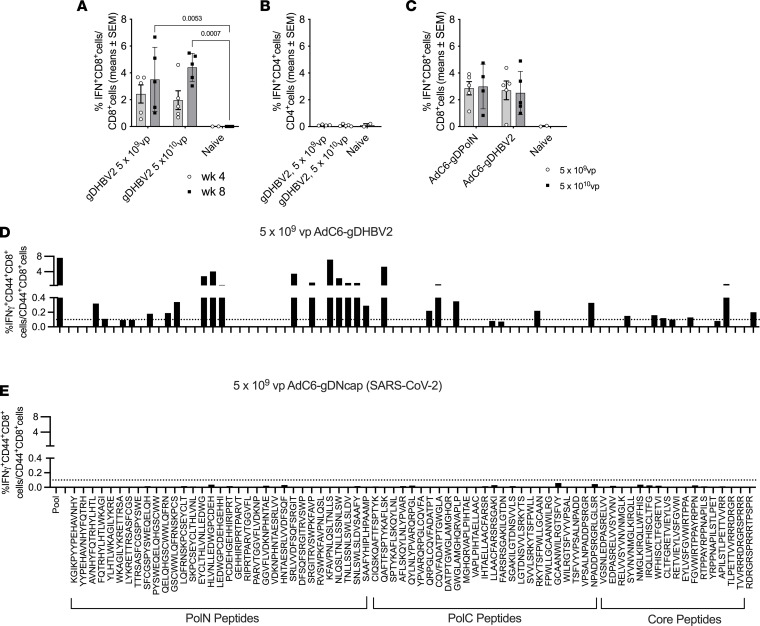
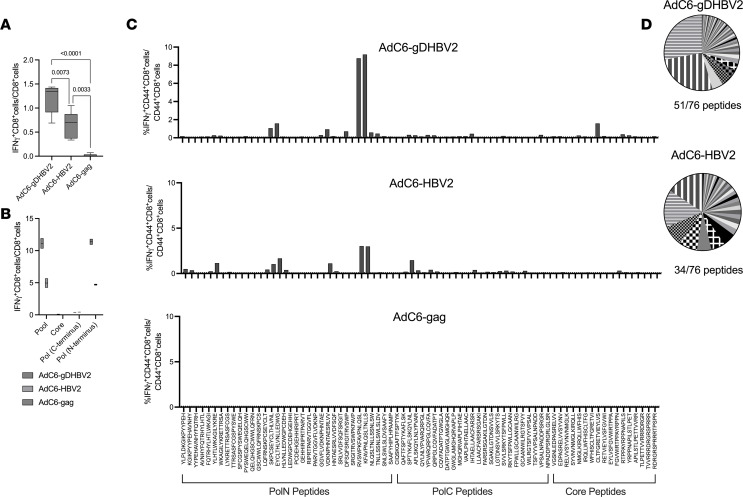
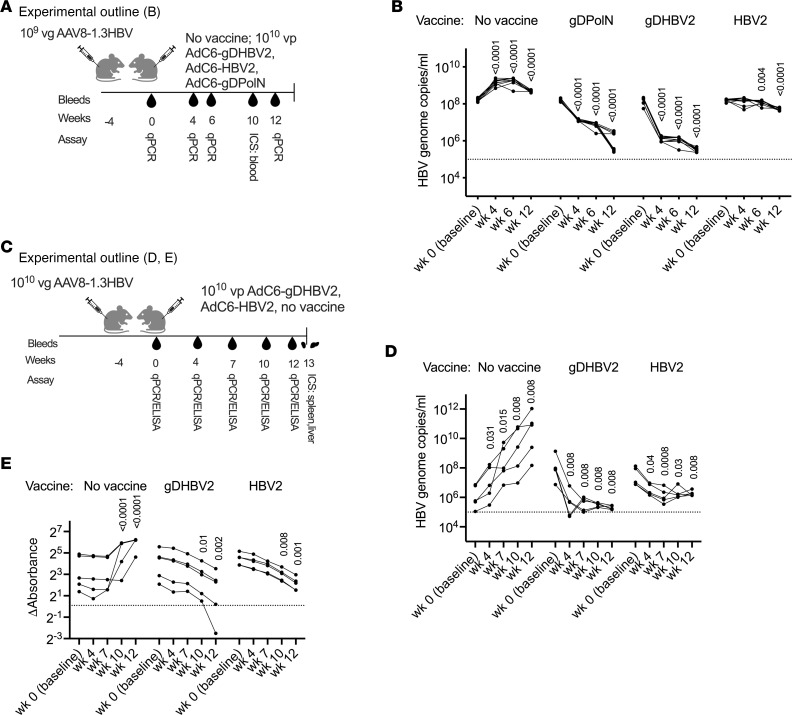
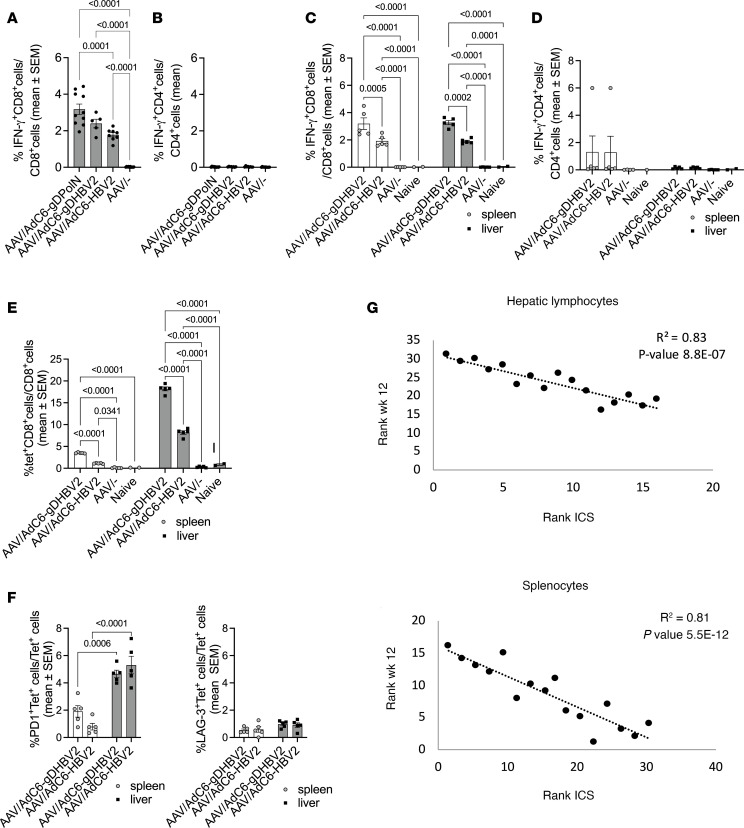
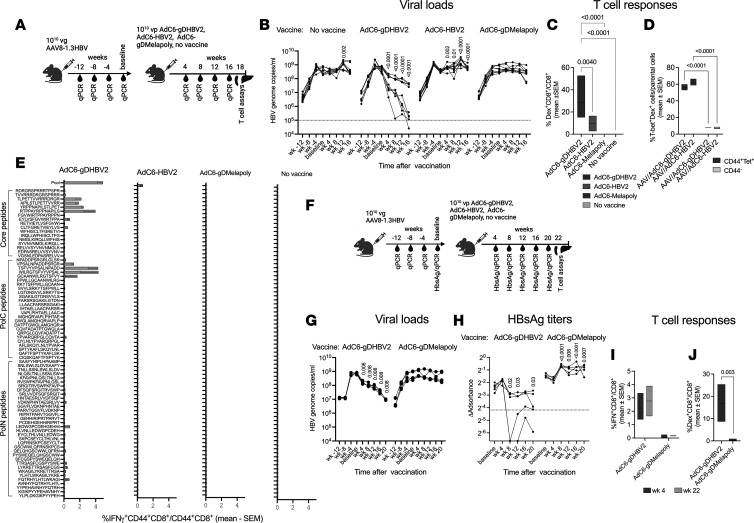
In patients who progress from acute hepatitis B virus (HBV) infection to a chronic HBV (CHB) infection, CD8+ T cells fail to eliminate the virus and become impaired. A functional cure of CHB likely requires CD8+ T cell responses different from those induced by the infection. Here we report preclinical immunogenicity and efficacy of an HBV therapeutic vaccine that includes herpes simplex virus (HSV) glycoprotein D (gD), a checkpoint modifier of early T cell activation, that augments CD8+ T cell responses. The vaccine is based on a chimpanzee adenovirus serotype 6 (AdC6) vector, called AdC6-gDHBV2, which targets conserved and highly immunogenic regions of the viral polymerase and core antigens fused to HSV gD. The vaccine was tested with and without gD in mice for immunogenicity, and in an AAV8-1.3HBV vector model of antiviral efficacy. The vaccine encoding the HBV antigens within gD stimulates potent and broad CD8+ T cell responses. In a surrogate model of HBV infection, a single intramuscular injection achieved pronounced and sustained declines of circulating HBV DNA copies and HBV surface antigen; both inversely correlated with HBV-specific CD8+ T cell frequencies in spleen and liver.

Keywords: Hepatitis; Immunology; Immunotherapy; T cells; Vaccines.


Conflict of interest statement

Conflict of interest: HCJE and ADL are cofounders of Virion Therapeutics. During this study, HCJE received funding from Virion Therapeutics, the Wellcome Trust, and Spark Therapeutics. HCJE serves as a consultant to several gene therapy companies. SLC and ADL are equity stakeholders in Virion Therapeutics.

Figures

Figure 1
Figure 1. Vaccine immunogenicity.
(A) Frequencies of circulating IFN-γ–producing CD8+ T cells responding to AdC6-gDHBV2 given at the indicated doses. T cells from 5 individual experimental mice and 2–4 naive control mice were analyzed 4 and 8 weeks after vaccination. The graph shows responses of individual animals, with bars indicating mean ± SEM. Significant differences are shown by connecting lines with P values above. (B) Data for CD4+ T cells from the same mice. (C) Frequencies of CD8+ T cells against AdC6-gDPolN and AdC6-gDHBV2. Responses were tested from blood of 5 individual mice 8 weeks after vaccination. Comparisons by 2-way ANOVA (B and C) showed no significant differences. (D and E) Frequencies of splenic CD44+CD8+ T cells versus all CD44+CD8+ T cells responding to the individual peptides representing the inserts derived from Pol and core were determined from pooled splenocytes of 5 mice. The y axis is identical for all graphs. Responses ≥0.1% indicated by the dotted line were viewed as positive.
Figure 2
Figure 2. Effects of gD on vaccine immunogenicity.
Mice were immunized with 1 × 10¹⁰ vp of AdC6 vectors expressing gDHBV2, HBV2, or gag of HIV-1. (A) PBMCs from 5 individual mice were tested 4 weeks later for responses to the HBV peptide pool. P values for differences between groups calculated by 2-way ANOVA are shown above the lines. (B) Duplicate samples of pooled splenocytes from 5 mice/group were tested 8 weeks after immunization for CD8+ T cell responses to peptides representing the HBV2 (pool), or N- and C-terminal sequences of Pol or core. (C) Splenocytes harvested 8 weeks after vaccination were tested for CD44+CD8+ T cell responses to individual peptides of the HBV2 sequence. (D) The pie charts show relative responses to individual peptides. Peptides that are strongly recognized by T cells from mice immunized with the AdC6-HBV2 or AdC6-gDHBV2 vaccine are highlighted by fill patterns.
Figure 3
Figure 3. Vaccine efficacy in mice infected for 4 weeks with AAV8-1.3HBV.
(A) Experimental outline for graphs in B and Figure 4, A and B for 10 mice that were injected with 1 × 10⁹ vg of AAV8-1.3HBV. (B) HBV genome copy levels in serum over time. Significant differences comparing baseline to after-vaccination data were calculated by multiple unpaired Mann-Whitney test and levels of significance are displayed within the graph. The dotted line at 105 indicates the detection limit. (C) Experimental outline for graphs D and E and Figure 4, C–G for 5 mice that were injected with 1 × 10¹⁰ vg of AAV8-1.3HBV. (D) HBV genome copy levels in serum over time. Significant differences comparing baseline to after-vaccination data were calculated by multiple unpaired Mann-Whitney test and levels of significance are displayed on top of each group. The dotted line at 105 indicates the detection limit. (E) ELISA data for HBsAg in sera are shown as absorbance values from which background data had been subtracted. The dotted line shows results for the negative control (serum from naive mice). Significant differences versus baseline were determined by 2-way ANOVA and P values are displayed within the graph.
Figure 4
Figure 4. Vaccine immunogenicity in AAV8-1.3HBV–infected mice.
(A and B) Experimental outline shown in Figure 3A. (A) Frequencies of IFN-γ–producing CD8+ T cells or (B) CD4+ T cells in blood were tested for 5–10 mice 10 weeks after vaccination. Significant differences with P values are displayed on lines above graphs. (CG) Experimental outline shown in Figure 3C. (C) Frequencies of IFN-γ–producing CD8+ T cells or (D) CD4+ T cells in spleens and livers of 5 experimental mice and 2 control mice 12 weeks after vaccination. P values shown above the lines were calculated by 2-way ANOVA. (E) Frequencies of tetramer+ (tet+) CD8+ T cells in spleens and livers of 5 experimental mice and 2 naive control mice injected with 1 × 10¹⁰ vg of AAV8-1.3HBV, vaccinated 4 weeks later with 1 × 10¹⁰ vp of the indicated vectors or nothing, and tested 12 weeks later. P values calculated by 2-way ANOVA are shown above the lines. (F) Percentage of tet+CD8+ cells of 5 mice per group expressing PD-1 or LAG-3. Gates were set based on expression on resting CD44CD8+ cells. P values calculated by 2-way ANOVA are shown above the lines. (G) Spearman’s correlations between frequencies of IFN-γ-producing HBV-specific CD8+ T cells in spleens or livers and viral loads based on intracellular cytokine staining (ICS) of 15 samples. R2 and P values are shown in the upper right corner of the graphs.
Figure 5
Figure 5. Vaccine efficacy in mice infected for 16 weeks with AAV8-1.3HBV.
(A) Experimental outline for graphs in BE. (BE and GK) Mice (n = 10) were injected with 1 × 10¹⁰ vg of AAV8-1.3HB. They were vaccinated 16 weeks later with the indicated vaccines. (B) Viral loads before and after vaccination shown as in Figure 3. Data were analyzed by multiple unpaired Mann-Whitney test against data obtained at baseline. P values are shown within the graphs. (C) Frequencies of CD8+ T cells from liver tested with a dextramer (dex) specific for an epitope within Pol from 5–10 mice. Data were analyzed by 1-way ANOVA and P values are shown above the lines. (D) Frequencies of AdC6-gDHBV2– or AdC6-HBV2–induced dex+CD44+CD8+ or dex+CD44CD8+ liver lymphocytes of 5 mice per group that stained positive for T-bet. (E) Frequencies of CD44+CD8+ splenocytes tested against individual peptides representing the HBV2 insert and against the peptide pool. Data obtained without peptide stimulation were subtracted. (F) Experimental design for graphs in GK based on experiments conducted with 5 mice per group. (G) Viral loads before and after vaccination shown as in Figure 3. Data were analyzed by multiple unpaired Mann-Whitney test against data obtained at baseline. Significant P values are shown within the graphs. (H) HbsAg levels are shown as OD values from which background values had been subtracted. The dotted line indicates results obtained with naive sera. Data were analyzed by Fisher’s LSD test comparing postvaccination time points to baseline; P values are shown within the graph. (I) PBMCs (week 4, n = 5) and spleens (week 22, n = 2) were tested by intracellular cytokine staining for CD8+ T cells against the HBV peptide pools. P values for differences between the vaccine groups are shown above the lines. (J) Frequencies of dex+CD8+ liver lymphocytes (n = 4). P values are shown within the graph. Data were analyzed by 2-way ANOVA.

References

    1. Schuch A, et al. The role of natural killer cells and CD8(+) T cells in hepatitis B virus infection. Front Immunol. 2014;5:258. doi: 10.3389/fimmu.2014.00258. - DOI - PMC - PubMed
    1. Zheng JR, et al. Hepatitis B functional cure and immune response. Front Immunol. 2022;13:1075916. doi: 10.3389/fimmu.2022.1075916. - DOI - PMC - PubMed
    1. Thimme R, et al. CD8(+) T cells mediate viral clearance and disease pathogenesis during acute hepatitis B virus infection. J Virol. 2003;77(1):68–76. doi: 10.1128/JVI.77.1.68-76.2003. - DOI - PMC - PubMed
    1. Baudi I, et al. HBV-specific CD8+ T-cell tolerance in the liver. Front Immunol. 2021;12:721975. doi: 10.3389/fimmu.2021.721975. - DOI - PMC - PubMed
    1. Horst AK, et al. Modulation of liver tolerance by conventional and nonconventional antigen-presenting cells and regulatory immune cells. Cell Mol Immunol. 2016;13(3):277–292. doi: 10.1038/cmi.2015.112. - DOI - PMC - PubMed

Substances

LinkOut - more resources