. 2024 Oct 8;9(19):e179871.
doi: 10.1172/jci.insight.179871.

Aldehyde dehydrogenase 2 preserves kidney function by countering acrolein-induced metabolic and mitochondrial dysfunction

Affiliations

Aldehyde dehydrogenase 2 preserves kidney function by countering acrolein-induced metabolic and mitochondrial dysfunction

Szu-Yuan Li et al. JCI Insight. .

Abstract

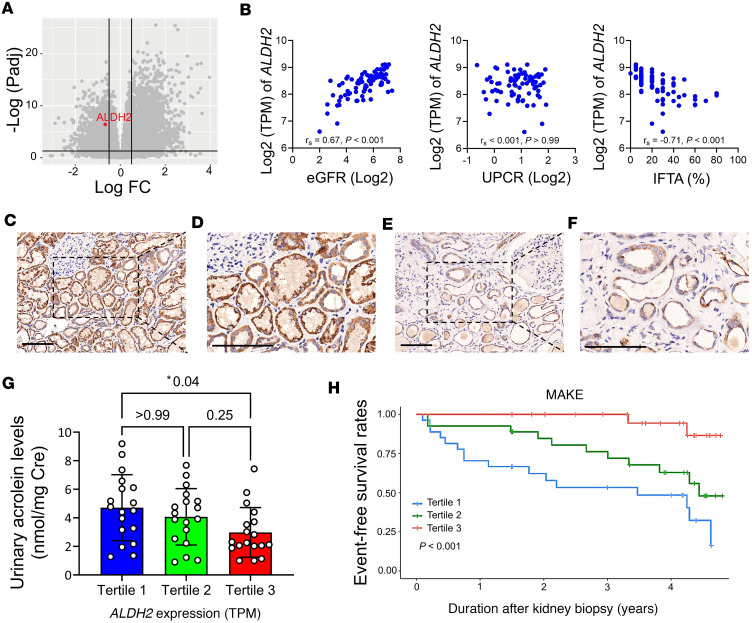
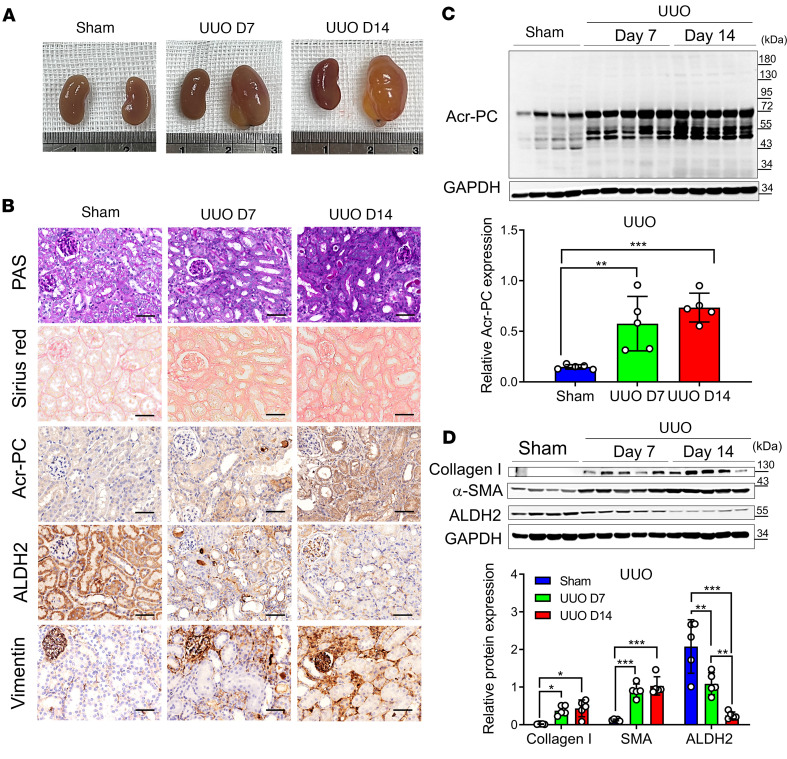
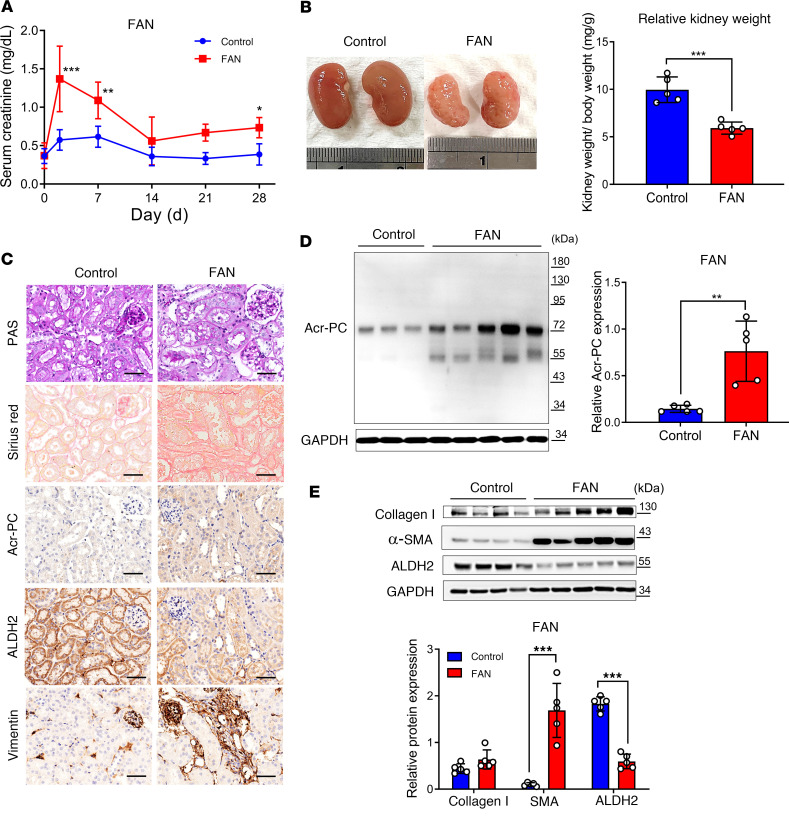
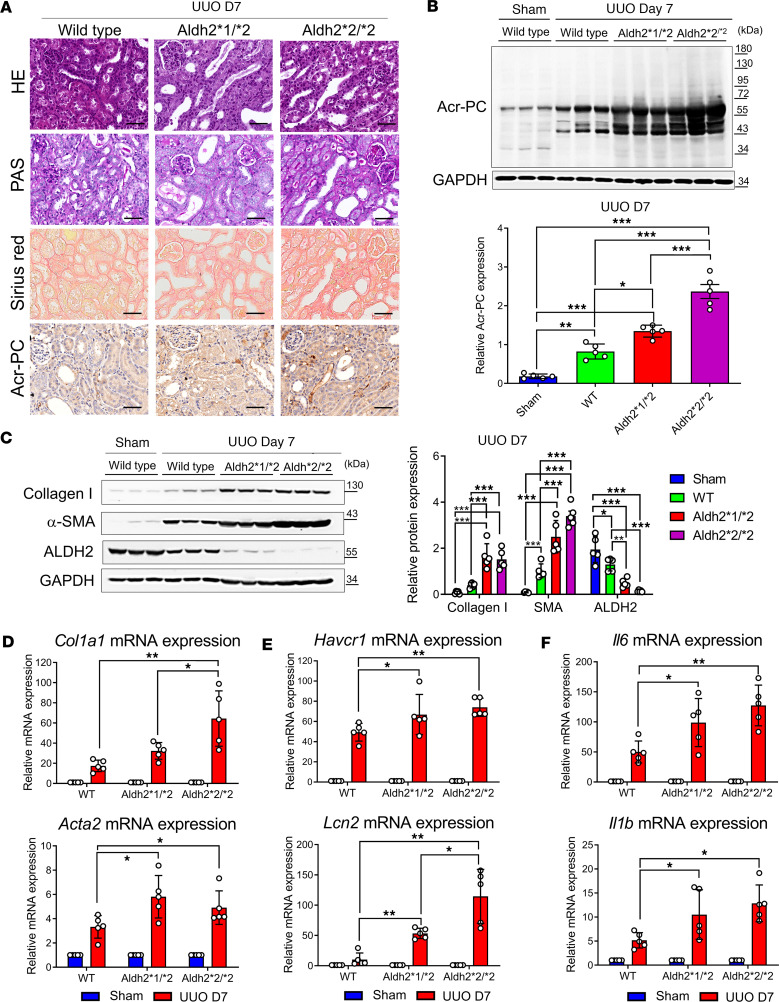
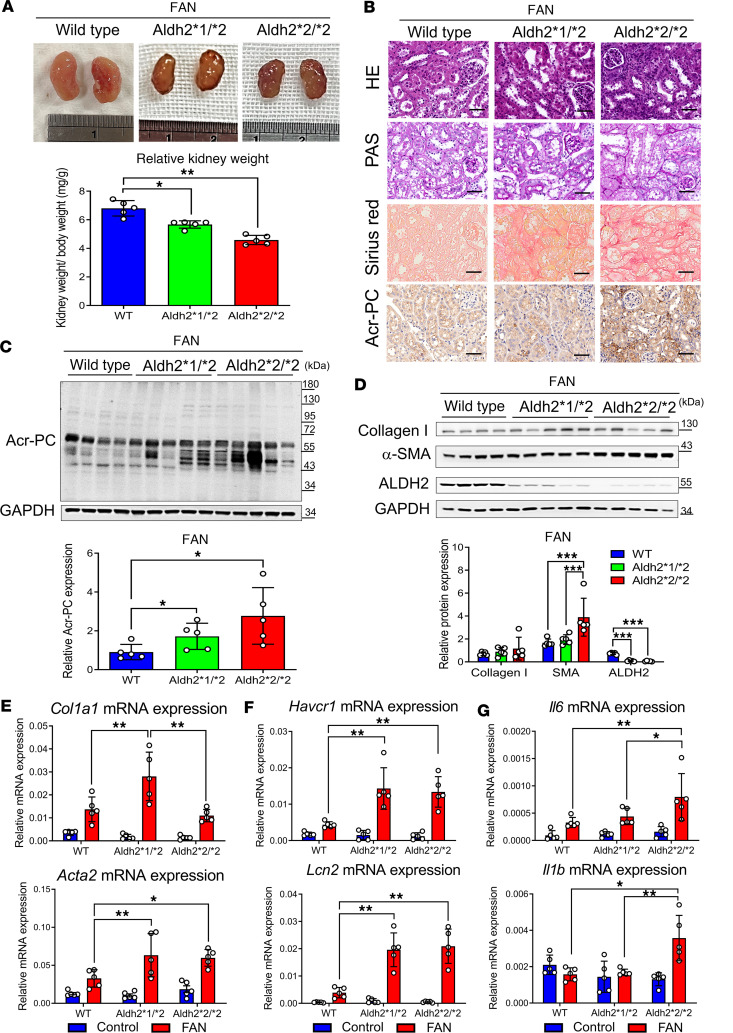
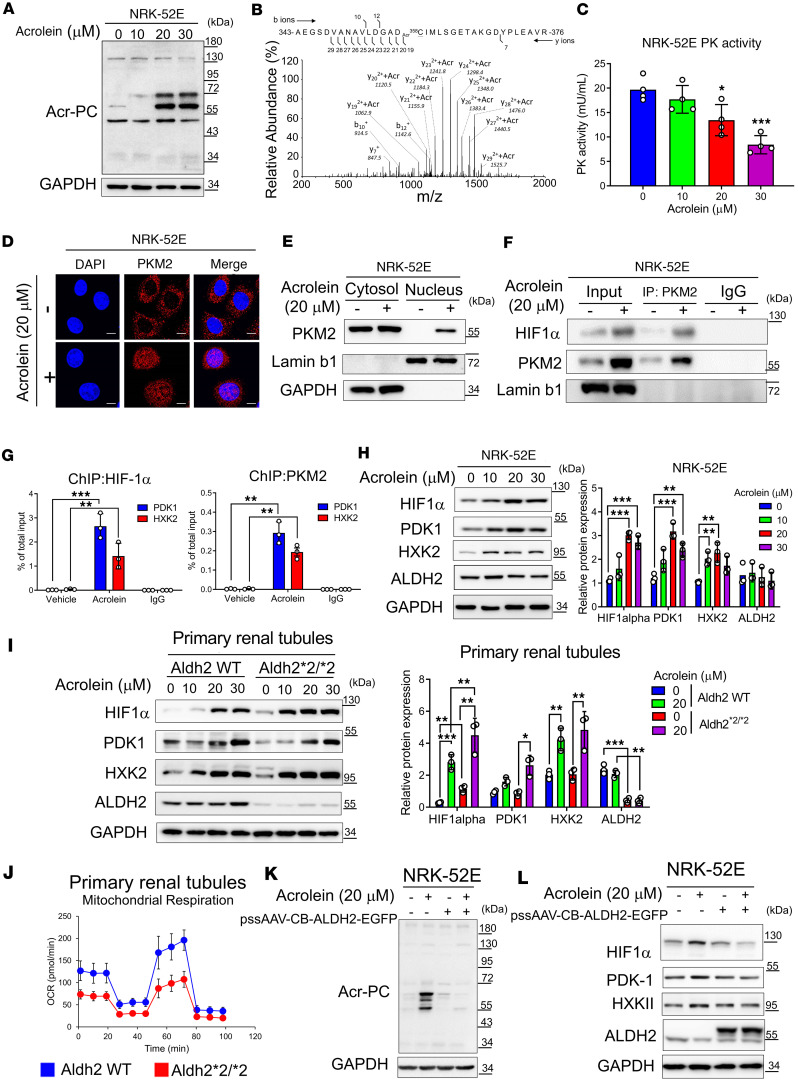
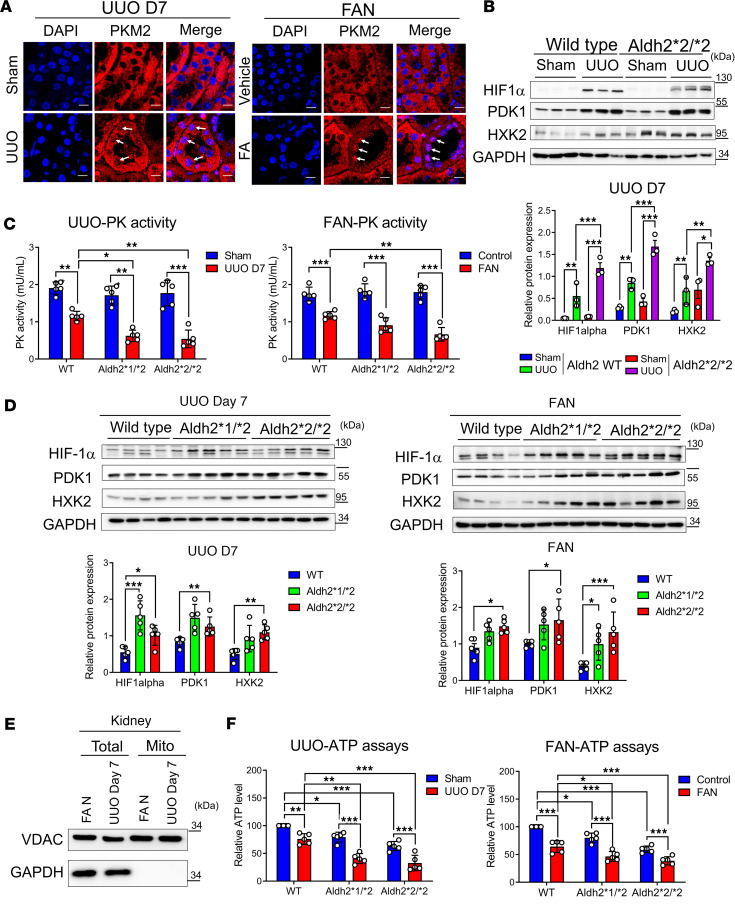
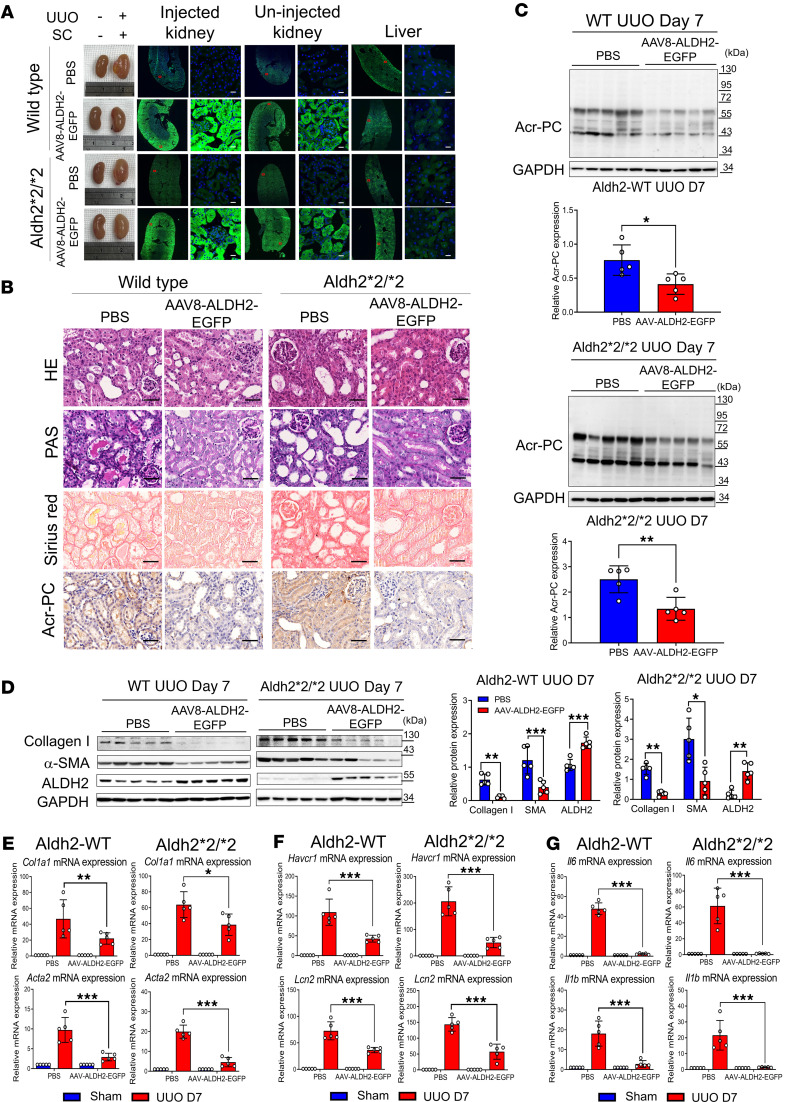
The prevalence of chronic kidney disease (CKD) varies by race because of genetic and environmental factors. The Glu504Lys polymorphism in aldehyde dehydrogenase 2 (ALDH2), commonly observed among East Asian people, alters the enzyme's function in detoxifying alcohol-derived aldehydes, affecting kidney function. This study investigated the association between variations in ALDH2 levels within the kidney and the progression of kidney fibrosis. Our clinical data indicate that diminished ALDH2 levels are linked to worse CKD outcomes, with correlations between ALDH2 expression, estimated glomerular filtration rate, urinary levels of acrolein - an aldehyde metabolized by ALDH2 - and fibrosis severity. In mouse models of unilateral ureteral obstruction and folic acid nephropathy, reduced ALDH2 levels and elevated acrolein were observed in kidneys, especially in ALDH2 Glu504Lys-knockin mice. Mechanistically, acrolein modifies pyruvate kinase M2, leading to its nuclear translocation and coactivation of HIF-1α, shifting cellular metabolism to glycolysis, disrupting mitochondrial function, and contributing to tubular damage and the progression of kidney fibrosis. Enhancing ALDH2 expression through adeno-associated virus vectors reduced acrolein and mitigated fibrosis in both WT and Glu504Lys-knockin mice. These findings underscore the potential therapeutic significance of targeting the dynamic interaction between ALDH2 and acrolein in CKD.

Keywords: Chronic kidney disease; Fibrosis; Metabolism; Mitochondria; Nephrology.


Figures

Figure 1
Figure 1. The diminished expression of ALDH2 in kidney tissues is correlated with adverse kidney outcomes in individuals with CKD.
(A) The volcano plot illustrates gene expression changes, indicating ALDH2 downregulation in fibrotic kidney disease compared with nonfibrotic cases. The x axis represents log2 fold-change, and the y axis represents –log10 (P values). (B) Scatterplots depict the correlation between kidney ALDH2 mRNA levels and estimated glomerular filtration rate (eGFR, the left panel), proteinuria (the middle panel), and the extent of interstitial fibrosis and tubular atrophy (IFTA, the right panel). Correlation coefficients (rs) and P values are displayed. (CF) Immunohistochemical staining of kidney biopsies from CKD versus healthy controls showed strong ALDH2 positivity in normal tubular epithelia (C), contrasting with reduced expression in advanced CKD (E). Enlarged views are displayed on the right (D and F). (Original magnifications of ×200 in C and E and ×400 in D and F.) Scale bar: 100 μm. (G) Urinary acrolein levels in CKD were assessed based on kidney ALDH2 mRNA tertiles. Acrolein levels increased with declining ALDH2 expression, with tertiles at 238.3 (197.7–273.2), 352.8 (333.3–374.6), and 427.8 (408.5–486.2) transcripts per million (TPM). (H) Major adverse kidney events (MAKEs), stratified by kidney ALDH2 tertiles, showed a significant association in Kaplan-Meier survival curves, determined by the log-rank test. An MAKE was defined as a greater than 40% decline in eGFR, kidney failure, or death. ALDH2, aldehyde dehydrogenase 2; CKD, chronic kidney disease; UPCR, urine protein creatinine ratio.
Figure 2
Figure 2. Analysis of Acr-PCs, ALDH2 expression, and fibrosis markers in Aldh2*1 mice after UUO.
UUO surgery was conducted in WT mice (n = 5), and the obstructed kidneys were collected at 7 and 14 days after surgery. (A) Representative kidney gross appearance from WT mice at day 7 or 14 after UUO. (B) The first panel displays periodic acid–Schiff (PAS) staining to assess morphological alterations in kidney tissues. The second panel exhibits Sirius red staining to evaluate the extent of kidney fibrosis on day 7 and 14 after UUO. The third through fifth panels present immunohistochemistry depicting Acr-PC levels, ALDH2, and Vimentin in kidney tissues. Scale bar: 50 μm. (C) The upper panel illustrates Western blot analysis of Acr-PC in kidney tissues of mice at day 7 and 14 after UUO, with quantification of these proteins shown in the lower panel. (D) The upper panel presents Western blot analysis of collagen 1, α–smooth muscle actin (α-SMA), and ALDH2 in kidney tissues of mice at day 7 and 14 after UUO, with quantification of these proteins shown in the lower panel. Data are represented as mean ± SD. Statistical significance was determined using Kruskal-Wallis tests, with 2-tailed P values displayed. *P < 0.05, **P < 0.01, ***P < 0.001 compared with the vehicle control group. Acr-PCs, acrolein-protein conjugates; ALDH2, aldehyde dehydrogenase 2; WT, wild-type; UUO, unilateral ureteral obstruction.
Figure 3
Figure 3. Assessment of Acr-PCs, ALDH2 expression, and fibrosis markers in Aldh2*1 mice after FAN.
WT mice (n = 5) received intraperitoneal injections of folic acid (FA) (225 mg/kg in 300 mM NaHCO3) and were subsequently sacrificed on day 28. (A) Measurement of serum creatinine (sCr) of mice on day 0, 3, 7, 14, 21, and 28 after FA injection. (B) Representative kidney gross appearance is displayed in the left panel, and the right panel presents a statistical analysis of the kidney-to-body weight ratio. (C) Periodic acid–Schiff (PAS) staining is shown in the first panel to assess morphological changes in kidney tissues. Sirius red staining to evaluate the kidney fibrosis area on day 28 after FA injection is depicted in the second panel. Immunohistochemistry for Acr-PCs, ALDH2, and Vimentin in kidney tissues is presented in the third through fifth panels. Scale bar: 50 μm. (D) The left panel shows Western blot analysis of Acr-PCs in kidney tissues of mice on day 28 after FA injection, with quantification of these proteins presented in the right panel. (E) The upper panel shows Western blot analysis of collagen 1, α–smooth muscle actin (α-SMA), and ALDH2 in kidney tissues of mice on day 28 after FA injection, with quantification of these proteins presented in the lower panel. Data are represented as mean ± SD. Statistical significance was determined using Mann-Whitney U tests, and 2-tailed P values are shown. *P < 0.05, **P < 0.01, ***P < 0.001 compared with the vehicle control group. Acr-PCs, acrolein-protein conjugates; ALDH2, aldehyde dehydrogenase 2; WT, wild-type; FAN, folic acid nephropathy.
Figure 4
Figure 4. Evaluation of Acr-PCs, fibrosis markers, inflammatory cytokines, and kidney damage markers in Aldh2*1/*2 and Aldh2*2/*2 mice compared with Aldh2*1 mice after UUO.
A UUO model was induced in WT, Aldh2*1/*2, and Aldh2*2/*2 mice (n = 5 for each group), and kidneys were collected 7 days after surgery. (A) H&E and periodic acid–Schiff (PAS) staining to assess morphological changes in kidney tissues (first and second panels). Sirius red staining evaluates the kidney fibrosis area on day 7 after UUO (third panel). Immunohistochemistry for Acr-PCs in kidney tissues is presented in the fourth panel. Scale bar: 50 μm. (B) The upper panel shows Western blot analysis of Acr-PC in kidney tissues, with quantification of these proteins shown in the lower panel. (C) The left panel shows Western blot analysis of collagen 1, α–smooth muscle actin (α-SMA), and ALDH2 in kidney tissues, with quantification of these proteins shown in the right panel. mRNA expression of (D) Col1a1, Acta2, (E) Havcr1, Lcn2, and (F) Il6 and Il1b in kidney tissues was assessed using quantitative reverse transcription PCR analysis. Data are presented as mean ± SD. Statistical significance was determined using Kruskal-Wallis tests, and 2-tailed P values are shown. *P < 0.05, **P < 0.01, ***P < 0.001 compared with the WT group. Acr-PCs, acrolein-protein conjugates; ALDH2, aldehyde dehydrogenase 2; WT, wild-type; UUO, unilateral ureteral obstruction; Acta2, actin alpha 2; Aldh2, aldehyde dehydrogenase 2; Col1a1, collagen type I alpha 1 chain; Havcr1, hepatitis A virus cellular receptor 1 homolog; Il6, interleukin-6, Il1b, interleukin-1β; Lcn2, lipocalin-2.
Figure 5
Figure 5. Assessment of Acr-PCs, fibrosis markers, inflammatory cytokines, and kidney damage markers in Aldh2*1/*2 and Aldh2*2/*2 mice compared with Aldh2*1 mice after FAN.
WT, Aldh2*1/*2, and Aldh2*2/*2 mice (n = 5 for each group) were intraperitoneally administered folic acid (FA) (225 mg/kg in 300 mM NaHCO3) and sacrificed on day 28. (A) The upper panel displays the gross appearance of representative kidneys, while the lower panel presents the statistical analysis of the kidney-to-body weight ratio. (B) H&E and periodic acid–Schiff (PAS) staining are shown in the first and second panels to assess morphological changes in kidney tissues. Sirius red staining to evaluate the kidney fibrosis area on day 28 after FA injection is depicted in the third panel. Immunohistochemistry for Acr-PC in kidney tissues is presented in the fourth panel. Scale bar: 50 μm. The upper panel displays Western blot analysis of (C) Acr-PCs, (D) collagen 1, α–smooth muscle actin (α-SMA), and ALDH2 in kidney tissues of mice, with quantification of these proteins shown in the lower panel. mRNA expression of (E) Col1a1, Acta2, (F) Havcr1, Lcn2, and (G) Il6 and Il1b in kidney tissues of mice was assessed using quantitative reverse transcription PCR analysis. Data are presented as mean ± SD. Statistical significance was determined using Kruskal-Wallis tests, and 2-tailed P values are shown. *P < 0.05, **P < 0.01, ***P < 0.001 compared with the WT group. Acr-PCs, acrolein-protein conjugates; ALDH2, aldehyde dehydrogenase 2; WT, wild-type; FAN, folic acid nephropathy; Acta2, actin alpha 2; Aldh2, aldehyde dehydrogenase 2; Col1a1, collagen type I alpha 1 chain; Havcr1, hepatitis A virus cellular receptor 1 homolog; Il6, interleukin-6, Il1b, interleukin-1β; Lcn2, lipocalin-2.
Figure 6
Figure 6. Acrolein-modified PKM2 shifts mitochondrial oxidative phosphorylation to aerobic glycolysis in NRK-52E cells and primary mouse renal tubular epithelial cells.
(AC) NRK-52E cells were exposed to acrolein (0–30 μM) for 24 hours. (A) Western blot analysis of Acr-PCs is presented. (B) Tandem mass spectrometry illustrating the acrolein-modified peptide in acrolein-treated NRK-52E cells. (C) Pyruvate kinase (PK) activity was determined. (D) Immunofluorescence staining of PKM2 in acrolein-treated NRK-52E cells. Scale bar: 10 μm. (E) Subcellular localization of PKM2 in acrolein-treated NRK-52E cells. Cells treated with acrolein (20 μM, 24 hours) were subjected to the Cell Fractionation Kit, followed by Western blot analysis. (F) Co-immunoprecipitation analysis of nuclear fractions prepared from acrolein-treated NRK-52E cells using an anti-PKM2 antibody or IgG antibody, followed by Western blot analysis. (G) Cells treated with acrolein (20 μM, 24 hours) were subjected to chromatin immunoprecipitation (ChIP) assays with antibodies against HIF-1α (the left panel), PKM2 (the right panel), or IgG, followed by real-time quantitative PCR for PDK1 and HXK2. (H) NRK-52E cells treated with acrolein (0–30 μM) for 24 hours were subjected to Western blot analysis with quantification. (I) Primary renal tubular epithelial cells isolated from Aldh2 WT or Aldh2*2/*2 mice treated with acrolein (0–30 μM) for 24 hours were subjected to Western blot analysis with quantification. (J) Oxygen consumption rate (OCR) was analyzed using the Seahorse XFe24 Metabolic Flux Analyzer. (K and L) ALDH2 overexpression in NRK-52E cells using AAV8-ALDH2-EGFP transient transfection for 24 hours followed by acrolein treatment (20 μM, 24 hours). Western blot analysis was performed. Data are presented as mean ± SD. Statistical significance was determined using Kruskal-Wallis tests, with 2-tailed P values indicated. *P < 0.05, **P < 0.01, ***P < 0.001 compared with vehicle treatment. Acr-PCs, acrolein-protein conjugates; PKM2, pyruvate kinase M2; HXK2, hexokinase 2; PDK1, pyruvate dehydrogenase kinase 1.
Figure 7
Figure 7. Acrolein-modified PKM2 shifts mitochondrial oxidative phosphorylation to aerobic glycolysis in murine kidneys under unilateral UUO or FAN.
(A) Immunofluorescence staining of PKM2 in the kidney tissues of mice exposed to UUO on day 7 (the left panel) or folic acid (FA) injection on day 28 (the right panel). Nuclei were counterstained with DAPI. The white arrows indicate representative nuclear translocation of PKM2. Scale bar: 10 μm. (B) The upper panel displays Western blot analysis of HIF-1α, PDK-1, and HXK2 in kidney tissues of sham and UUO groups of Aldh2 wild-type (WT) and Aldh2*2/*2 mice, with quantification of these proteins shown in the lower panel. (C) Pyruvate kinase (PK) activity in the kidney tissues of mice exposed to UUO day 7 (the left panel) or FA injection day 28 (the right panel) was determined. (D) The upper panel displays Western blot analysis of HIF-1α, PDK-1, and HXK2 in kidney tissues of mice exposed to UUO on day 7 (left panel) or FA injection on day 28 (right panel), with quantification of these proteins shown in the lower panel. (E) Mouse kidney mitochondria were isolated. Western blot analysis of subcellular preparations (Total, total lysates; Mito, mitochondria) probed with antibodies specific for organelle-specific marker proteins: cytosol (GAPDH) and mitochondria (voltage-dependent anion channel, VDAC). (F) ATP content of mitochondria isolated from kidney tissues of mice exposed to UUO on day 7 (the left panel) or FA injection on day 28 (the right panel) was measured. Data are presented as mean ± SD. Statistical significance was determined using Kruskal-Wallis tests, with 2-tailed P values indicated. *P < 0.05, **P < 0.01, ***P < 0.001 compared with vehicle treatment. PKM2, pyruvate kinase M2; UUO, unilateral ureteral obstruction; FAN, folic acid nephropathy; HXK2, hexokinase 2; PDK1, pyruvate dehydrogenase kinase 1.
Figure 8
Figure 8. Impact of AAV-directed ALDH2 gene on Acr-PC expression, fibrosis markers, inflammatory cytokines, and kidney damage markers in Aldh2*1 and Aldh2*2/*2 mice after UUO.
Wild-type (WT) mice (n = 5) and Aldh2*2/*2 mice (n = 5) underwent subcapsular (SC) injections of 2 × 10¹¹ genome copies of AAV8-ALDH2-EGFP for 28 days prior to UUO surgery. Mice were sacrificed 7 days after surgery. (A) Fluorescence images of ALDH2-EGFP in cryopreserved kidney and liver tissue sections were used to evaluate EGFP fluorescence signaling. Robust ALDH2-EGFP signaling was observed in the injected kidney, with some signal detected in the contralateral uninjected kidney. Low ALDH2-EGFP signaling was detected in the liver. Scale bar = 20 μm. (B) The first and second panels depict H&E and periodic acid–Schiff (PAS) staining, respectively, to assess morphological changes in kidney tissues. The third panel shows Sirius red staining to evaluate the kidney fibrosis area on day 7 after UUO. The fourth panel displays the immunohistochemistry of Acr-PCs in kidney tissues. Scale bar: 50 μm. (C) Western blot analysis of Acr-PCs in kidney tissues of mice is illustrated with quantification. (D) Western blot analysis of collagen 1, α–smooth muscle actin (α-SMA), and ALDH2 in kidney tissues of mice is illustrated with quantification. mRNA expression of (E) Col1a1, Acta2, (F) Havcr1, Lcn2, and (G) Il6 and Il1b in kidney tissues was assessed through quantitative reverse transcription PCR analysis. Data are presented as mean ± SD. Statistical significance was determined using Mann-Whitney U or Kruskal-Wallis tests, and 2-tailed P values are indicated. *P < 0.05, **P < 0.01, ***P < 0.001 compared with the WT group. AAV, adeno-associated virus; ALDH2, aldehyde dehydrogenase 2; Acr-PCs, acrolein-protein conjugates; Acta2, actin alpha 2; Col1a1, collagen type I alpha 1 chain; Havcr1, hepatitis A virus cellular receptor 1 homolog; Il6, interleukin-6, Il1b, interleukin-1β; Lcn2, lipocalin-2.

References

    1. Stadler K, et al. The evolving understanding of the contribution of lipid metabolism to diabetic kidney disease. Curr Diab Rep. 2015;15(7):40. doi: 10.1007/s11892-015-0611-8. - DOI - PMC - PubMed
    1. Kang HM, et al. Defective fatty acid oxidation in renal tubular epithelial cells has a key role in kidney fibrosis development. Nat Med. 2015;21(1):37–46. doi: 10.1038/nm.3762. - DOI - PMC - PubMed
    1. Moorhead JF, et al. Lipid nephrotoxicity in chronic progressive glomerular and tubulo-interstitial disease. Lancet. 1982;2(8311):1309–1311. doi: 10.1016/S0140-6736(82)91513-6. - DOI - PubMed
    1. Jao TM, et al. ATF6α downregulation of PPARα promotes lipotoxicity-induced tubulointerstitial fibrosis. Kidney Int. 2019;95(3):577–589. doi: 10.1016/j.kint.2018.09.023. - DOI - PubMed
    1. Hauck AK, Bernlohr DA. Oxidative stress and lipotoxicity. J Lipid Res. 2016;57(11):1976–1986. doi: 10.1194/jlr.R066597. - DOI - PMC - PubMed

MeSH terms