. 2024 Sep 3;20(9):e1012380.
doi: 10.1371/journal.pcbi.1012380. eCollection 2024 Sep.

Energy landscapes of peptide-MHC binding

Affiliations

Energy landscapes of peptide-MHC binding

Laura Collesano et al. PLoS Comput Biol. .

Abstract

Molecules of the Major Histocompatibility Complex (MHC) present short protein fragments on the cell surface, an important step in T cell immune recognition. MHC-I molecules process peptides from intracellular proteins; MHC-II molecules act in antigen-presenting cells and present peptides derived from extracellular proteins. Here we show that the sequence-dependent energy landscapes of MHC-peptide binding encode class-specific nonlinearities (epistasis). MHC-I has a smooth landscape with global epistasis; the binding energy is a simple deformation of an underlying linear trait. This form of epistasis enhances the discrimination between strong-binding peptides. In contrast, MHC-II has a rugged landscape with idiosyncratic epistasis: binding depends on detailed amino acid combinations at multiple positions of the peptide sequence. The form of epistasis affects the learning of energy landscapes from training data. For MHC-I, a low-complexity problem, we derive a simple matrix model of binding energies that outperforms current models trained by machine learning. For MHC-II, higher complexity prevents learning by simple regression methods. Epistasis also affects the energy and fitness effects of mutations in antigen-derived peptides (epitopes). In MHC-I, large-effect mutations occur predominantly in anchor positions of strong-binding epitopes. In MHC-II, large effects depend on the background epitope sequence but are broadly distributed over the epitope, generating a bigger target for escape mutations due to loss of presentation. Together, our analysis shows how an energy landscape of protein-protein binding constrains the target of escape mutations from T cell immunity, linking the complexity of the molecular interactions to the dynamics of adaptive immune response.


Conflict of interest statement

The authors have declared that no competing interests exist.

Figures
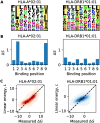
Fig 1
Fig 1. Binding motifs, sequence information, and linear model.
A: Position weight matrix for HLA-A*02:01 (left) and HLA-DRB1*01:01 (right) inferred from training data. Letter size indicates the frequency of a given amino acid at a given position, pi(a), in the sample of MHC-binding peptides (ΔG ≤ 0). Yellow bars highlight anchor positions, and the color of letters shows the chemical properties of the amino acids (black: hydrophobic, red: acidic, blue: basic, green: polar, purple: neutral) [51]. B: Position-specific sequence information, ΔSi, defined as the Kullback-Leibler distance of the observed distribution pi(a) from an equidistribution. C: Error plot comparing observed energies, ΔG, and predictions of the linear model, L (contours give densities above 0.01).
Fig 2
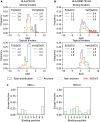
Fig 2. Inference of epistasis.
Scatter plots of experimental ΔG values and the linear energy model L for subsamples with given amino acid pairs in selected positions (max 50 random points are displayed). Top: HLA-A*02:01, selected positions 2 and 9; bottom: HLA-DRB1*01:01, selected positions 4 and 6. From left to right: subsamples containing stronger binders, marginal binders, and non-binders, respectively. Lines give linear regressions for each subsample. See S2 Fig for regression lines of all subsamples.
Fig 3
Fig 3. Global and idiosyncratic epistasis in simulations.
Linear regression for subsamples of simulated data (one realization) according to the global epistasis model and the idiosyncratic epistasis model. A: From left to right, weak global epistasis with λ = −0.01, moderate with λ = −0.04 and strong λ = −0.1. The lines are color-coded based on the minimum L value spanned by the given subsample. B: From left to right, weak idiosyncratic epistasis with λ˜=0.3, moderate with λ˜=1 and strong λ˜=2. The transparency of each regression line is proportional to the number of data points in the given subsample.
Fig 4
Fig 4. Global-epistasis model for MHC-I.
A: Error plot comparing observed energies, ΔG, and predictions of the optimal global-epistasis model (λ = −0.04) for HLA-A*02:01. To be compared with the linear model of Fig 1; see S1 Fig for other alleles. B: Model comparison of the global-epistasis model and NetMHC-4.0: error function (dark shading) and total Bayesian Information Criterion (BIC) score accounting for model complexity (full bars) for allele HLA-A*02*01 (orange) and aggregated over all 3 MHC-I alleles (blue), evaluated by blind testing (see text for details).
Fig 5
Fig 5. Mutational effect distributions.
A-B: Distribution of energy changes, ΔΔG, for mutations from ancestral peptides in different energy windows: strong binders (ΔG ≈ −5, top) and typical binders (ΔG ≈ −1). The total distribution (black) is shown together with the components from anchor positions (blue) and non-anchor positions (orange). For strong binders, red shading marks escape mutations leading to loss of presentation (ΔΔG ≳ 5). Inserts give mean and variance of magnitude effects |ΔΔG|. A: MHC-I, allele HLA-A*02:01 (anchor positions 2 and 9). B: MHC-II, allele HLA-DRB1*01:01 (anchor positions 1, 4, 6 and 9). C: Distribution of escape from MHC binding in HIV. Position-dependent fraction of loss-of-binding mutations inferred from a set of HIV epitopes presented by MHC-I or MHC-II; see text and S9 Table.

References

    1. Bosselut R. T cell antigen recognition: Evolution-driven affinities. Proceedings of the National Academy of Sciences. 2019;116(44):21969–21971. doi: 10.1073/pnas.1916129116 - DOI - PMC - PubMed
    1. Batalia MA, Collins EJ. Peptide binding by class I and class II MHC molecules. Peptide Science. 1997;43(4):281–302. doi: 10.1002/(SICI)1097-0282(1997)43:4<281::AID-BIP3>3.0.CO;2-R - DOI - PubMed
    1. Yewdell JW, Reits E, Neefjes J. Making sense of mass destruction: quantitating MHC class I antigen presentation. Nature Reviews Immunology. 2003;3(12):952–961. doi: 10.1038/nri1250 - DOI - PubMed
    1. Trolle T, Metushi IG, Greenbaum JA, Kim Y, Sidney J, Lund O, et al. Automated benchmarking of peptide-MHC class I binding predictions. Bioinformatics. 2015;31(13):2174–2181. doi: 10.1093/bioinformatics/btv123 - DOI - PMC - PubMed
    1. Yewdell JW, Bennink JR. Immunodominance in major histocompatibility complex class I–restricted T lymphocyte responses. Annual review of immunology. 1999;17(1):51–88. doi: 10.1146/annurev.immunol.17.1.51 - DOI - PubMed

MeSH terms

Substances

LinkOut - more resources