. 2024 Sep 3;111(5):956-966.
doi: 10.4269/ajtmh.24-0003. Print 2024 Nov 6.

Analytical Sensitivity Analysis and Clinical Impact Modeling of Rapigen Rapid Diagnostic Tests for Malaria

Affiliations

Analytical Sensitivity Analysis and Clinical Impact Modeling of Rapigen Rapid Diagnostic Tests for Malaria

Allison Golden et al. Am J Trop Med Hyg. .

Abstract

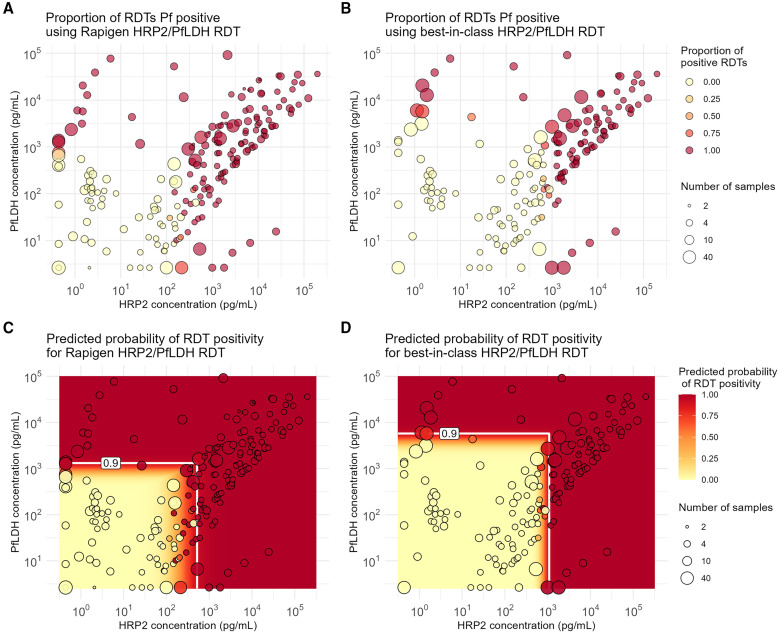
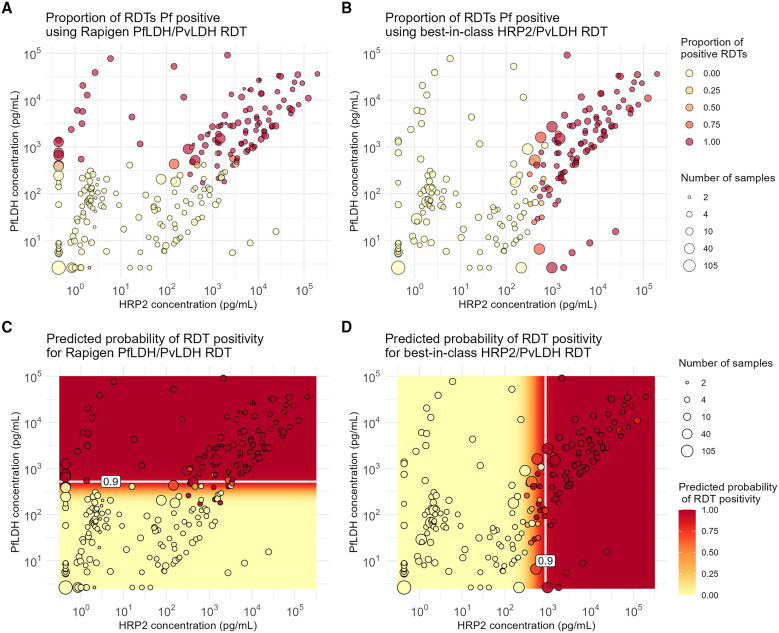
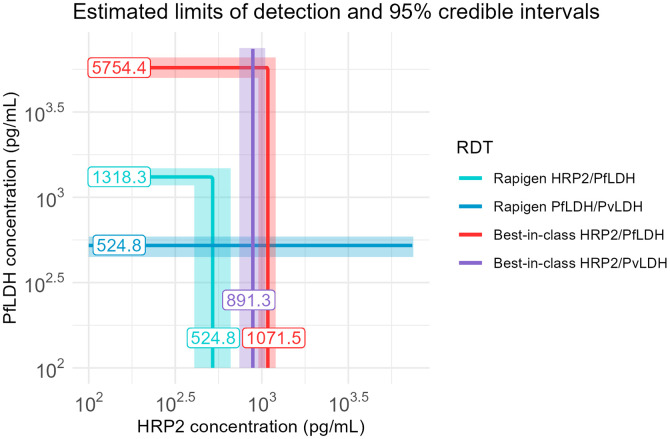
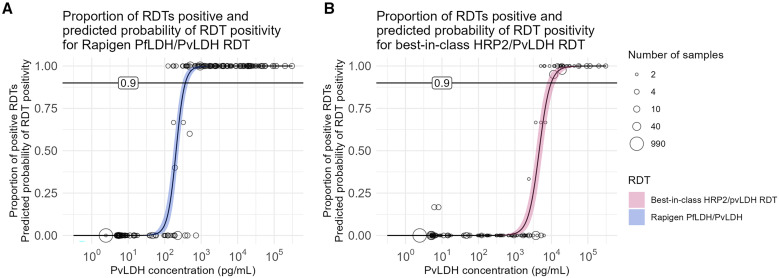
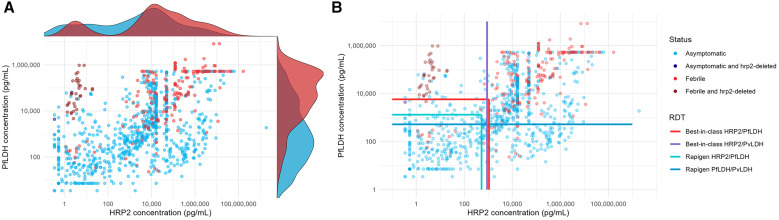
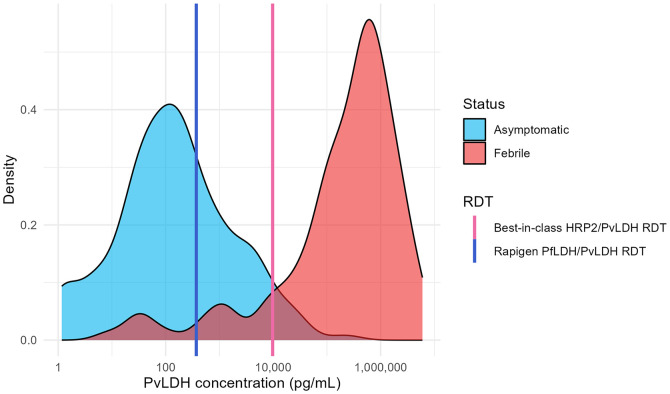
Laboratory benchmarking allows objective analysis of the analytical performance of malaria rapid diagnostic tests (RDTs). We present the analytical detection limits of the Rapigen BIOCREDIT Malaria Ag Pf/Pv (pLDH/pLDH), the Rapigen BIOCREDIT Malaria Ag Pf (pLDH/HRPII), and two best-in-class WHO-prequalified comparator RDTs, generated using standardized panels containing recombinant antigen, in vitro cultured parasites, international standards, and clinical samples. Detection limit antigen concentrations of HRP2, PfLDH, and PvLDH were determined for the Rapigen and comparator RDTs. Detection of antigens in international units (IU)/mL was also evaluated. The Rapigen Ag Pf (pLDH/HRPII) detected 3.9 and 3.9 IU/mL for PfLDH and HRP2, respectively, and the Ag Pf/Pv (pLDH/pLDH) detected 3.9 and 5.0 IU/mL for PfLDH and PvLDH, respectively. The comparator HRP2/PfLDH and HRP2/PvLDH detected 15.6 and 31.3 IU/mL for HRP2 and PfLDH and 15.6 and 50.0 IU/mL for HRP2 and PvLDH, respectively. The RDT clinical sensitivity was predicted through application of analytical detection limits to antigen concentration distributions from clinical symptomatic and asymptomatic cases. Febrile cases would be detected in a majority by both standard and Rapigen RDTs, but incremental increases in sensitivity in the Rapigen RDTs may be important for clinical cases currently missed by microscopy. Rapigen RDTs were predicted to have improved detection of asymptomatic cases and infections with parasites carrying hrp2 deletions through more sensitive PfLDH detection. Through the benchmarking and simulation of clinical sensitivity, a method for rapidly assessing the ability of new RDTs to meet clinical needs using high-sensitivity antigen distribution data is presented.


Figures

Figure 1.
Figure 1.
Positivity versus Plasmodium falciparum (Pf) antigen concentrations for Pf detection tests evaluated. (A) Proportion of Rapigen BIOCREDIT Malaria Ag Pf (pfLDH/HRPII) replicates testing positive and (B) proportion of best-in-class WHO-prequalified comparator Pf test replicates positive and plotted according to HRP2 and PfLDH concentration (picograms/milliliter). Circle size references the number of tests conducted at the concentrations of HRP2 and PfLDH in the sample, indicated by the circle placement. Heat map overlays of (C) Figure 1A for Rapigen BIOCREDIT Malaria Ag Pf (pLDH/HRPII) and (D) Figure 1B for comparator Pf test, with antigen concentrations at 90% probability of positivity for either PfLDH or HRP2, indicated by white lines. HRP2 = histidine-rich protein 2; LDH = lactate dehydrogenase.
Figure 2.
Figure 2.
Positivity versus Plasmodium falciparum (Pf) antigen concentrations for Pf/Plasmodium vivax (Pv)-detection tests evaluated. (A) Proportion of Rapigen BIOCREDIT Malaria Ag Pf/Pv (pLDH/pLDH) replicates testing positive and (B) proportion of best-in-class WHO-prequalified comparator Pf/Pv test replicates positive, plotted according to HRP2 and PfLDH concentration (picograms/milliliter). Heat map overlays of (C) Figure 2A for Rapigen BIOCREDIT Malaria Ag Pf/Pv (pLDH/pLDH) and (D) Figure 2B for comparator Pf/Pv test, with relevant antigen concentrations at 90% probability of positivity, indicated by white lines. HRP2 = histidine-rich protein 2; LDH = lactate dehydrogenase.
Figure 3.
Figure 3.
Summary of 90% probability of positivity limits. Results of modeled probability of detection are overlaid for Rapigen Plasmodium falciparum (Pf) (PfLDH/HRP2), Pf/Pv (PfLDH/PvLDH), and best-in-class WHO-prequalified comparator tests for Pf (HRP2/PfLDH) and Pf/Pv (HRP2/PvLDH). Antigen concentrations at the 90% probability, in pg/mL, are indicated on the line. HRP2 = histidine-rich protein 2; LDH = lactate dehydrogenase.
Figure 4.
Figure 4.
Positivity versus Pv antigen concentrations for Pf/Pv-detection tests evaluated. Proportion of A) Rapigen BIOCREDIT Malaria Ag Pf/Plasmodium vivax (Pv) (pLDH/pLDH) or (B) best-in-class comparator test replicates testing positive for PvLDH versus sample PvLDH concentration (picograms/milliliter). Circle placement indicates the proportion of samples at the given concentration testing positive, and the circle size indicates the number of samples tested at that concentration. The logistic regression fit of probability of positivity for (A) Rapigen (blue), and (B) best-in-class comparator (pink) is marked with 90% probability. HRP2 = histidine-rich protein 2; LDH = lactate dehydrogenase.
Figure 5.
Figure 5.
Distribution of antigen concentration in asymptomatic and febrile samples positive for Plasmodium falciparum (Pf) and predicted detection by Rapigen and comparator rapid diagnostic tests. (A) PfLDH and HRP2 concentrations are plotted for clinical samples from both symptomatic (dark red, pink) and asymptomatic (dark blue, cyan) patients positive for Pf infection by polymerase chain reaction. Points with either dark red or dark blue coloring represent samples with high probability or confirmed hrp2 gene deletion. Above the plotted values and relative to x-axis HRP2 concentrations, curves show the HRP2 antigen distribution from febrile (red) and asymptomatic (cyan) patients. To the right of the plotted values and relative to the y-axis PfLDH concentration, curves show the PfLDH antigen distribution from febrile (red) and asymptomatic (cyan) patients. (B) Plotted points from panel A with overlaid lines marking 90% probability of detection concentrations for Rapigen tests (light and dark turquoise lines) and best-in-class comparator tests (red and purple lines). HRP2 = histidine-rich protein 2; LDH = lactate dehydrogenase.
Figure 6.
Figure 6.
Distribution of antigen concentration in asymptomatic and febrile samples positive for Plasmodium vivax (Pv) and predicted detection by Rapigen and comparator rapid diagnostic tests. PvLDH antigen distributions are plotted for clinical samples from both symptomatic (red) and asymptomatic (cyan) patients positive for Pv infection by polymerase chain reaction. Lines marking PvLDH concentrations of 90% probability of detection are overlaid for Rapigen (blue) and best-in-class (pink) tests. LDH = lactate dehydrogenase.

References

    1. Berhane A. et al., 2018. Major threat to malaria control programs by Plasmodium falciparum lacking histidine-rich protein 2, Eritrea. Emerg Infect Dis 24: 462–470. - PMC - PubMed
    1. World Health Organization , 2019. Response Plan to pfhrp2 Gene Deletions. Geneva, Switzerland: WHO.
    1. World Health Organization , 2020. Master Protocol for Surveillance of pfhrp2/3 Deletions and Biobanking to Support Future Research. Geneva, Switzerland: WHO.
    1. Beshir KB, Parr JB, Cunningham J, Cheng Q, Rogier E, 2022. Screening strategies and laboratory assays to support Plasmodium falciparum histidine-rich protein deletion surveillance: Where we are and what is needed. Malar J 21: 201. - PMC - PubMed
    1. Watson OJ, Slater HC, Verity R, Parr JB, Mwandagalirwa MK, Tshefu A, Meshnick SR, Ghani AC, 2017. Modelling the Drivers of the Spread of Plasmodium falciparum hrp2 Gene Deletions in Sub-Saharan Africa. Available at: https://elifesciences.org/articles/25008/figures. Accessed August 24, 2017. - PMC - PubMed

MeSH terms

Substances

LinkOut - more resources