. 2024 Oct 9;44(41):e1810232024.
doi: 10.1523/JNEUROSCI.1810-23.2024.

Role of the STING→IRF3 Pathway in Ambient GABA Homeostasis and Cognitive Function

Affiliations

Role of the STING→IRF3 Pathway in Ambient GABA Homeostasis and Cognitive Function

Chiranjivi Neupane et al. J Neurosci. .

Erratum in

Abstract

Targeting altered expression and/or activity of GABA (γ-aminobutyric acid) transporters (GATs) provide therapeutic benefit for age-related impairments, including cognitive dysfunction. However, the mechanisms underlying the transcriptional regulation of GATs are unknown. In the present study, we demonstrated that the stimulator of interferon genes (STING) upregulates GAT1 and GAT3 expression in the brain, which resulted in cognitive dysfunction. Genetic and pharmacological intervention of STING suppressed the expression of both GAT1 and GAT3, increased the ambient GABA concentration, and therefore, enhanced tonic GABAA inhibition of principal hippocampal neurons, resulting in spatial learning and working memory deficits in mice in a type I interferon-independent manner. Stimulation of the STING→GAT pathway efficiently restored cognitive dysfunction in STING-deficient mice models. Our study uncovered for the first time that the STING signaling pathway regulates GAT expression in a cell autonomous manner and therefore could be a novel target for GABAergic cognitive deficits.

Keywords: GATs; STING→IRF3; memory; tonic GABA.


Conflict of interest statement

The authors declare no competing financial interests.

Figures

Figure 1.
Figure 1.
Working and learning memory deficits in STING−/− mice. A, The percentage of spontaneous alternations in the Y-maze test in STING+/+ and STING−/− mice at 6 weeks and 6 months (n = 8–10 mice in each group). STING−/− mice exhibited sex and age-independent working memory loss (***p < 0.001, STING+/+ vs STING−/− mice, two-sample t test, n = 8–10 mice in each group). B, The percentage of spontaneous alternations after vehicle or IFNAR antibody (50 µg/mouse, i.p., QD for 10 d) treatment is summarized in the bar graph (n = 6 mice in each group). C–F, During the acquisition training for the Barnes maze test, primary latency, total latency, primary errors, and total errors progressively decreased over 4 d of training in STING+/+ and STING−/− mice. However, STING−/− mice showed delayed latency and an increased number of errors compared with STING+/+ mice (*p < 0.05, **p < 0.01, Bonferroni's post hoc test following two-way RM ANOVA, n = 10 mice in each group). G, Summarized bar graph from the passive avoidance test showing that fear-aggravated learning memory was significantly decreased in STING−/− mice (***p < 0.001, two-sample t test compared with STING+/+ mice, n = 10 mice in each group). H, I, Summarized result from open field test result showing that the total distance traveled (H) and time in center (I) did not differ between the STING+/+ and STING−/− mice (n = 10 mice in each group). J, The latency to fall in the rotarod test (10 trials per day for 3 consecutive days) is presented in the point graph (n = 10 mice in each group). All the summarized data are presented as mean ± SEM.
Figure 2.
Figure 2.
Increased GABA level and impaired cognitive function in STING−/− mice. A, Schematic illustration of microdialysis and summary plot for glutamate (bottom left panel; n = 10–14 mice in each group) and GABA (bottom right panel; *p < 0.05, STING+/+ vs STING−/− mice, Mann–Whitney test, n = 12–17 mice in each group) levels in the hippocampal microdialysate. B, Schematic illustration of the experimental timeline of the Y-maze test and injection of the GABAA receptor antagonist L-655,708 (1 mg/kg, i.p.). C, Summary plot for spontaneous alternations in STING+/+ and STING−/− mice before (baseline, ***p < 0.001, STING+/+ vs STING−/− mice, two-sample t test, n = 20–21 mice in each group) and after the injection of vehicle (saline, ***p < 0.001, or L-655,708; p = 0.270, STING+/+ vs STING−/− mice, two-sample t test, n = 10–11 mice in each group in both cases). D, Representative traces of sIPSCs from hippocampal DGGCSs of STING+/+ and STING−/− mice. E, Summary plots for sIPSC frequency and amplitude (n = 20–22 neurons from 7 to 8 mice in each group). F, Representative traces of averaged sIPSCs. G, Summary plot of decay time in STING+/+ and STING−/− mice (n = 20–22 neurons from 8 to 9 mice in each group). H, Representative traces of tonic current from hippocampal DGGCs of STING+/+ and STING−/− mice. I, Summary plot of tonic current in each group (***p < 0.001, STING+/+ vs STING−/− mice, two-sample t test, n = 8–9 neurons from 4 mice in each group). J, Representative traces of action potentials evoked by the depolarizing step current before and after the application of BIC (20 µM) in DGGCs of STING+/+ and STING−/− mice. The number of spikes was significantly increased in STING−/− mice after BIC application. Vm was maintained at −70 mV under all conditions. K, Mean number of spikes produced by the depolarizing step current before and after the application of BIC in STING+/+ and STING−/− mice. Blockade of tonic GABAA inhibition significantly shifted the I–O relationship curve to the left compared with controls (n = 10 neurons from 3 mice in each group).
Figure 3.
Figure 3.
GABAA receptors were not altered in STING−/− mice. A, Representative traces of tonic current in STING+/+ and STING−/− mice after exogenous GABA administration. B, Summary plot of basal and total tonic current (n = 8 neurons from 3 mice in each group). C, Representative current traces showing the effects on Iholding before and after the application of 1 µM THIP in the presence of 5 µM GABA in DGGCs of STING+/+ and STING−/− mice. D, Mean current amplitude of THIP-induced current and basal tonic currents are summarized in bar graphs (n = 8 neurons from 3 mice in each group). *p < 0.05; two-sample t test compared with STING+/+ mice.
Figure 4.
Figure 4.
Itonic in STING−/− mice is augmented due to GATs. A, Schematic illustration of the target of GAT blockers. B, Representative traces of tonic current in STING+/+ and STING−/− mice after administration of the nonselective GAT inhibitor, NPA (100 µM). C, D, Summary plot of NPA-induced, INPA, (C) and total tonic current (D; n = 8–9 neurons from 3 mice in each group). E, Representative traces of tonic current in STING+/+ and STING−/− mice after sequential application of the GAT1 inhibitor, NO-711; 5 µM, and GAT3 inhibitor, SNAP-5114; 300 µM. F–H, Summary plot of GAT inhibitor-induced (INO-711 and ISNAP) and total tonic current (n = 8–9 neurons from 3 mice in each group). I, Representative image (left) of Western blot showing protein expression of STING→p-TBK1→TBK1→p-IRF3→IRF3→GAT1→GAT3 in the hippocampus of STING+/+ and STING−/− mice. Normalized protein expressions (right) are summarized in bar graph. J, Representative images of RT-PCR (top) showing the mRNA expressions of STING, GAT1, and GAT3 in the hippocampus. Normalized mRNA expressions (bottom) are summarized in bar graph. K, Representative image (left) of Western blot showing protein expression of STING→p-TBK1→TBK1→p-IRF3→IRF3→GAT1→GAT3 in the cerebral cortex from same group as in I (n = 3–4 mice in each group). Normalized protein expressions (right) are summarized in bar graph. L, Representative images of RT-PCR (top) showing the mRNA expressions of STING, GAT1, and GAT3 in the cerebral cortex. Normalized mRNA expressions (bottom) are summarized in bar graph. *p < 0.05, **p < 0.01, ***p < 0.001; two-sample t test, compared with STING+/+ mice.
Figure 5.
Figure 5.
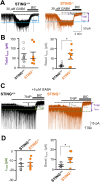
The STING agonist cGAMP restored the GABAergic tone in STING+/− mice. The STING+/+ and STING−/− mice were treated with saline or cGAMP (2 µg/mouse, i.p., QD for 14 d). A, B, Hippocampal (A) and cerebral cortex (B) lysates from the STING+/+ and STING+/− mice were immunoblotted with the indicated antibodies. C, D, Summary graph of the protein expression (n = 5 mice in each group). E, F, Representative image of RT-PCR showing mRNA expressions of GAT1 and GAT3 after saline or cGAMP treatment in STING+/+ and STING+/− mice (E). Normalized mRNA expressions of GAT1 and GAT3 are summarized in bar graphs (F; n = 5 mice per group). G, H, cGAMP restored the enhanced Itonic in STING+/− mice. Representative traces (G) and summary graph (H) for the tonic current in each condition (n = 8 neurons from 3 mice in each group). I, Summary graphs for spontaneous alternations in the Y-maze test (right panel; n = 10 mice in each group). *p < 0.05, **p < 0.01, ***p < 0.001; Bonferroni's post hoc test following two-way ANOVA.
Figure 6.
Figure 6.
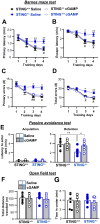
The STING agonist cGAMP restored cognitive dysfunction in STING+/− mice. A–D, The Barnes maze test showed that the primary latency (A), total latency (B), primary errors (C), and total errors (D) progressively decreased over the 4 d of training in both saline- and cGAMP-treated mice. STING+/− mice showed delayed latency and an increased number of errors compared with STING+/+ mice (*p < 0.05,**p < 0.01; Bonferroni's post hoc test following two-way RM ANOVA compared with the saline-treated STING+/+ mice), meanwhile cGAMP treatment significantly improved the latencies and decreased the number of errors in STING+/− mice (#p < 0.05, ##p < 0.01, Bonferroni's post hoc test following two-way RM ANOVA compared with the saline-treated STING+/− mice). E, Summarized bar graph from the passive avoidance test showing that cGAMP significantly improved fear-aggravated learning memory deficits in STING+/− mice (*p < 0.05, **p < 0.01, Bonferroni's post hoc test following one-way ANOVA as indicated in graph, n = 8 mice in each group). F, G, Open field test showed that the total distance traveled (F) and time in center (G) were not different between the saline- and cGAMP-treated mice.
Figure 7.
Figure 7.
STING antagonist H-151 mimics the altered GABAergic tone and cognitive dysfunction in STING+/+ mice. A, Summary graphs for spontaneous alternations after H-151 treatment (4 µg/kg, i.p., QD, n = 8–10 mice in each group). Spontaneous alternations in the Y-maze test were recorded at Postinjection Day 7 (7D-PI) and 12 (12D-PI). B, C, H-151 attenuated the Itonic in STING+/+ mice. Representative traces (B) and summary graph (C) for tonic current in each condition (n = 6 neurons from 3 mice for 7D-PI and n = 8–10 neurons from 4 mice for 12D-PI in each group). D, Representative image (left) of Western blot showing protein expression of STING→p-TBK1→TBK1→p-IRF3→IRF3→GAT1→GAT3 in the hippocampus of saline- and H-151-injected groups. Normalized protein expressions (right) are summarized in a bar graph. E, Representative image (left) of Western blot showing protein expression of STING→p-TBK1→TBK1→p-IRF3→IRF3→GAT1→GAT3 in the cerebral cortex from the same group as in H (n = 3–4 mice in each group). Normalized protein expressions (right) are summarized in a bar graph. F, G, Representative images of RT-PCR showing the mRNA expressions (left) and summary graph (right) for the mRNA level of STING, GAT1, and GAT3 in the hippocampus (F) and cerebral cortex (G). mRNAs were measured using semiquantitative PCR analysis from the same group as in A and B. H, Summary graphs for spontaneous alternations after an additional GABAAR antagonist L-655,708 treatment to H-151 injected mice (n = 10 mice in each group). *p < 0.05, **p < 0.01, ***p < 0.001; two-sample t test compared with vehicle injected STING+/+ mice.
Figure 8.
Figure 8.
Pharmacological inhibition of STING impaired spatial learning and memory in STING+/+ mice. A–D, The Barnes maze test showed that the primary latency (A), total latency (B), primary errors (C), and total errors (D) progressively decreased over the 4 d of training in both vehicle- and H-151-treated mice. However, H-151 significantly delayed the latencies and increased the number of errors compared with the vehicle-treated mice. E, Summarized bar graph from the passive avoidance test showing that fear-aggravated learning memory was significantly decreased H-151-treated mice. F, G, Open field test showed that the total distance traveled (F) and time in center (G) were not different between the vehicle- and H-151-treated mice. Summarized data are shown as means ± SEM. *p < 0.05, **p < 0.01, Bonferroni's post hoc test following two-way RM ANOVA compared with the vehicle-treated group (A–D) and two-sample t test (E); n = 8–9 mice in each group.

References

    1. Abdullah A, Zhang M, Frugier T, Bedoui S, Taylor JM, Crack PJ (2018) STING-mediated type-I interferons contribute to the neuroinflammatory process and detrimental effects following traumatic brain injury. J Neuroinflammation 15:323. 10.1186/s12974-018-1354-7 - DOI - PMC - PubMed
    1. Banuelos C, Beas BS, McQuail JA, Gilbert RJ, Frazier CJ, Setlow B, Bizon JL (2014) Prefrontal cortical GABAergic dysfunction contributes to age-related working memory impairment. J Neurosci 34:3457–3466. 10.1523/JNEUROSCI.5192-13.2014 - DOI - PMC - PubMed
    1. Barber GN (2015) STING: infection, inflammation and cancer. Nat Rev Immunol 15:760–770. 10.1038/nri3921 - DOI - PMC - PubMed
    1. Baruch K, et al. (2014) Aging: aging-induced type I interferon response at the choroid plexus negatively affects brain function. Science 346:89–93. 10.1126/science.1252945 - DOI - PMC - PubMed
    1. Borden LA (1996) GABA transporter heterogeneity: pharmacology and cellular localization. Neurochem Int 29:335–356. 10.1016/0197-0186(95)00158-1 - DOI - PubMed

MeSH terms

LinkOut - more resources