. 2024 Sep 3;34(9):bhae352.
doi: 10.1093/cercor/bhae352.

Age and visual cortex inhibition: a TMS-MRS study

Affiliations

Age and visual cortex inhibition: a TMS-MRS study

Molly Simmonite et al. Cereb Cortex. .

Abstract

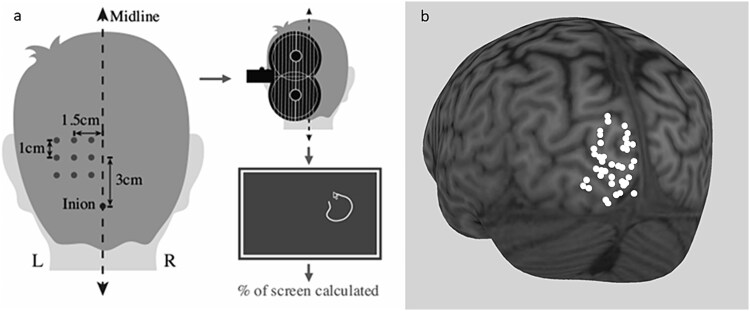
Paired-pulse transcranial magnetic stimulation is a valuable tool for investigating inhibitory mechanisms in motor cortex. We recently demonstrated its use in measuring cortical inhibition in visual cortex, using an approach in which participants trace the size of phosphenes elicited by stimulation to occipital cortex. Here, we investigate age-related differences in primary visual cortical inhibition and the relationship between primary visual cortical inhibition and local GABA+ in the same region, estimated using magnetic resonance spectroscopy. GABA+ was estimated in 28 young (18 to 28 years) and 47 older adults (65 to 84 years); a subset (19 young, 18 older) also completed a paired-pulse transcranial magnetic stimulation session, which assessed visual cortical inhibition. The paired-pulse transcranial magnetic stimulation measure of inhibition was significantly lower in older adults. Uncorrected GABA+ in primary visual cortex was also significantly lower in older adults, while measures of GABA+ that were corrected for the tissue composition of the magnetic resonance spectroscopy voxel were unchanged with age. Furthermore, paired-pulse transcranial magnetic stimulation-measured inhibition and magnetic resonance spectroscopy-measured tissue-corrected GABA+ were significantly positively correlated. These findings are consistent with an age-related decline in cortical inhibition in visual cortex and suggest paired-pulse transcranial magnetic stimulation effects in visual cortex are driven by GABAergic mechanisms, as has been demonstrated in motor cortex.

Keywords: aging; gamma-aminobutyric acid; magnetic resonance spectroscopy; transcranial magnetic stimulation.


Figures

Fig. 1
Fig. 1
Template for MRS voxel placement in left primary visual cortex.
Fig. 2
Fig. 2
a) Schematic demonstrating phosphene data collection method. BrainSight was used to generate a 3 × 3 grid of stimulation targets over the visual cortex, with the center of the grid 3 cm dorsal and 1.5 cm left-lateral of the inion. The TMS coil was held at 90° to the midline. Starting with a stimulator input of 60% of maximum stimulator output, each target was stimulated three times (monophasic, lateral-medial induced current, MagPro X100 with MagOption stimulator and MC-B70 butterfly coil). If stimulation at 60% of maximum output failed to induce phosphenes at any of the 9 targets, intensity was increased in increments of 10% until the participants reported seeing phosphenes. If phosphenes were elicited by stimulation to more than one target, the target reported to generate the brightest and most consistent phosphenes was selected as the target to continue data collection. At this target, stimulation intensity was increased and decreased in 2%, then 1% increments, to determine the phosphene threshold, which was defined as the lowest stimulation intensity that resulted in a phosphene on at least 5 of 10 trials. Participants traced phosphenes on screen after each trial, and area was calculated. Adapted from Khammash et al. (2019a); b) MNI locations of TMS hot spots in left primary visual cortex. n = 38 participants.
Fig. 3
Fig. 3
a) Phosphene size as a function of single-pulse intensity for both young and older adults. Points represent mean phosphene size at each stimulation intensity. Error bars present the standard error of the mean. b) Mean phosphene size as a function of single-pulse stimulation for the whole sample. *indicate a stimulation intensity that produces significantly larger phosphenes than the previous intensity, with a P-value that survives correction for multiple comparisons (P < 0.0167). Error ribbon represents the standard error of the mean.
Fig. 4
Fig. 4
a) Bar graph of phosphene size as a function of condition for young and older adults. Bars represent the average size of phosphenes elicited during either the single-pulse (no conditioning stimulation) or paired-pulse (conditioning stimulation at 45% of PT) condition. n = 19 young adults, 18 older adults. Error bars indicate standard error of the mean. b) Average phosphene size as a function of condition for each participant. A linear mixed-effects model was fit with age and condition as fixed effects and participant as a random intercept effect. Each participant is represented by a separate line. Steeper negative slopes indicate stronger inhibition of phosphene size resulting from the conditioning stimulus.
Fig. 5
Fig. 5
Scatter plots showing the relationship between TMS-elicited phosphene size and a) uncorrected GABA+, b) tissue-corrected GABA+, and c) α-corrected GABA+ for the whole sample (solid line), young adults (circles, dotted line), and older adults (triangles, dashed line). n = 19 young adults, 18 older adults.
Fig. 6
Fig. 6
a) Heatmaps describing MRS voxel placement overlap across all MRS participants. b) Example MRS spectra. c) Bar graph of uncorrected, tissue-corrected, and α-corrected left primary visual GABA+ concentrations in young and older participants. Bars represent average GABA+ concentrations for each group. Dots represent observations from individual participants. n = 28 young adults, 47 older adults. Error bars represent standard deviations.

References

    1. Andersen GJ. Aging and vision: changes in function and performance from optics to perception. Wiley Interdiscip Rev Cogn Sci. 2012:3(3):403–410. 10.1002/wcs.1167. - DOI - PMC - PubMed
    1. Ball K, Sekuler R. Improving visual perception in older Observers1. J Gerontol. 1986:41(2):176–182. 10.1093/geronj/41.2.176. - DOI - PubMed
    1. Bates D, Mächler M, Bolker B, Walker S. Fitting linear mixed-effects models using lme4. J Stat Softw. 2015:67(1):1–48. 10.18637/jss.v067.i01. - DOI
    1. Bell T, Stokoe M, Harris AD. Macromolecule suppressed GABA levels show no relationship with age in a pediatric sample. Sci Rep. 2021:11(1):722. 10.1038/s41598-020-80530-8. - DOI - PMC - PubMed
    1. Bennett PJ, Sekuler AB, Ozin L. Effects of aging on calculation efficiency and equivalent noise. J Opt Soc Am A Opt Image Sci Vis. 1999:16(3):654–668. 10.1364/JOSAA.16.000654. - DOI - PubMed

Publication types

Substances