. 2024 Sep;20(5):509-518.
doi: 10.3988/jcn.2024.0015.

Customized Visual Discrimination Digital Therapy According to Visual Field Defects in Chronic Stroke Patients

Affiliations

Customized Visual Discrimination Digital Therapy According to Visual Field Defects in Chronic Stroke Patients

Eun Namgung et al. J Clin Neurol. 2024 Sep.

Abstract

Background and purpose: Visual perceptual learning (VPL) may improve visual field defects (VFDs) after chronic stroke, but the optimal training duration and location remain unknown. This prospective study aimed to determine the efficacy of 8 weeks of VFD-customized visual discrimination training in improving poststroke VFDs.

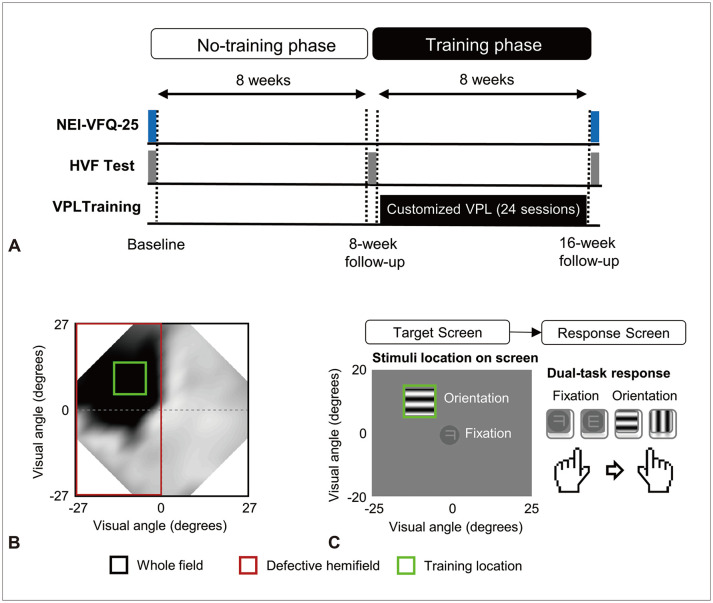
Methods: Prospectively enrolled patients with poststroke VFDs initially received no training for 8 weeks (no-training phase). They subsequently underwent our customized VPL program that included orientation-discrimination tasks in individualized blind fields and central letter-discrimination tasks three times per week for 8 weeks (training phase). We analyzed the luminance detection sensitivity and deviation as measured using Humphrey visual field tests before and after the no-training and training phases. The vision-related quality of life was assessed at baseline and at a 16-week follow-up using the National Eye Institute Visual Function Questionnaire-25 (NEI-VFQ-25).

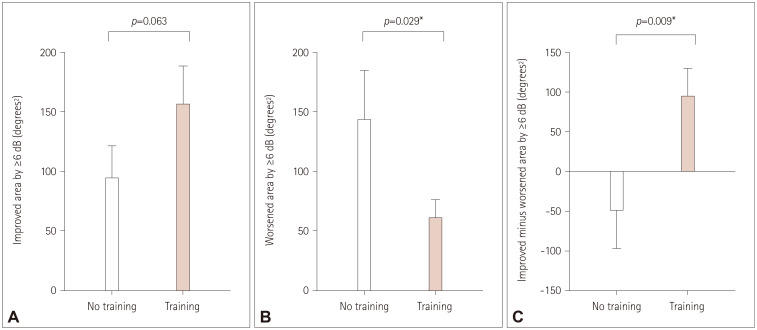
Results: Changes in mean total deviation (MTD) scores were greater during the training phase than during the no-training phase (defective hemifield, p=0.002; whole field, p=0.004). The MTD scores improved during the training phase (defective hemifield, p=0.004; whole field, p=0.016), but not during the no-training phase (defective hemifield, p=0.178; whole field, p=0.178). The difference between the improved and worsened areas (≥6 dB changes in luminance detection sensitivity) was greater during the training phase than during the no-training phase (p=0.009). The vision-specific social functioning subscore of the NEI-VFQ-25 improved after the 16-week study period (p=0.040).

Conclusions: Our 8-week VFD-customized visual discrimination training protocol may effectively improve VFDs and vision-specific social functioning in chronic stroke patients.

Keywords: cortical blindness; stroke; vision disorders; visual perception.


Conflict of interest statement

Eun-Jae Lee, a contributing editor of the Journal of Clinical Neurology, was not involved in the editorial evaluation or decision to publish this article. All remaining authors have declared no conflicts of interest.

Figures

Fig. 1
Fig. 1. Study design and customized VPL program. A: The enrolled patients underwent an 8-week period without training (no-training phase) followed by 24 sessions of a VFD-customized VPL program over 8 weeks implemented as 3 training sessions per week (training phase). HVF tests (gray box) were conducted before and after both the no-training and training phases. The NEI-VFQ-25 (blue box) was administered at baseline and at the 16-week follow-up. B: For one patient with quadrantanopia, an example blind field from the HVF test is shown along with the stimulus location for the VPL (green box). The defective hemifield (red box) and the whole field (black box) are also displayed. C: Our customized VPL program included orientation-discrimination training in the individualized blind field, based on the baseline HVF test, as well as letter-discrimination training for central fixation. HVF, Humphrey visual field; NEI-VFQ-25, National Eye Institute Visual Function Questionnaire-25; VFD, visual field defect; VPL, visual perceptual learning.
Fig. 2
Fig. 2. Changes in the defective visual hemifield after the customized VPL program. A: MTD scores for the defective hemifield did not change significantly during the no-training phase (p=0.178). Line graphs with scores (white circles) at baseline and at the 8-week follow-up are shown for each patient. B: MTD scores for the defective hemifield improved significantly after VFD-customized VPL training for 8 weeks (p=0.004). Line graphs with scores (black circles) at the 8- and 16-week follow-ups are shown for each patient. C: Changes in MTD scores after 8 weeks for the defective hemifield were significantly larger during the training phase than during the no-training phase (p=0.002). The bar graph shows the changes in scores as mean and standard-error values. *Statistical significance at p<0.05. MTD, mean total deviation; VFD, visual field defect; VPL, visual perceptual learning.
Fig. 3
Fig. 3. Changes in the whole visual field after the customized VPL program. A: MTD scores for the whole field did not change significantly during the no-training phase (p=0.178). Line graphs with scores (white circles) at baseline and at the 8-week follow-up are shown for each patient. B: MTD scores for the whole field improved significantly after VFD-customized VPL training for 8 weeks (p=0.016). Line graphs with scores (black circles) at the 8- and 16-week follow-ups are shown for each patient. C: Eight-week-induced changes in MTD scores for the whole field were significantly larger during the training phase than during the no-training phase (p=0.004). The bar graph shows the changes in scores as mean and standard-error values. *Statistical significance at p<0.05. MTD, mean total deviation; VFD, visual field defect; VPL, visual perceptual learning.
Fig. 4
Fig. 4. Changes in whole area after the customized VPL program. A: The area in which sensitivity improved by ≥6 dB after VPL did not differ significantly between the no-training and training phases (95.1±99.5 degrees2 vs. 157±119 degrees2, p=0.063). The bar graph shows the improved area as mean and standard-error values. B: The area in which sensitivity worsened by ≥6 dB after VPL was significantly larger during the no-training phase than during the training phase (144±153 degrees2 vs. 61.7±55.5 degrees2, p=0.029). The bar graph shows the worsened area as mean and standard-error values. C: The area in which the improved minus worsened sensitivity was ≥6 dB after VPL was significantly larger during the training phase than during the no-training phase (95.1±130.6 degrees2 vs. -48.9±177.3 degrees2, p=0.009). The bar graph shows the change in scores as mean and standard-error values. *Statistical significance at p<0.05. VPL, visual perceptual learning.

References

    1. Pollock A, Hazelton C, Henderson CA, Angilley J, Dhillon B, Langhorne P, et al. Interventions for visual field defects in patients with stroke. Cochrane Database Syst Rev. 2019;5:CD008388. - PubMed
    1. Saionz EL, Busza A, Huxlin KR. Rehabilitation of visual perception in cortical blindness. Handb Clin Neurol. 2022;184:357–373. - PMC - PubMed
    1. Sand KM, Wilhelmsen G, Naess H, Midelfart A, Thomassen L, Hoff JM. Vision problems in ischaemic stroke patients: effects on life quality and disability. Eur J Neurol. 2016;23(Suppl 1):1–7. - PubMed
    1. Gall C, Franke GH, Sabel BA. Vision-related quality of life in first stroke patients with homonymous visual field defects. Health Qual Life Outcomes. 2010;8:33. - PMC - PubMed
    1. Papageorgiou E, Hardiess G, Schaeffel F, Wiethoelter H, Karnath HO, Mallot H, et al. Assessment of vision-related quality of life in patients with homonymous visual field defects. Graefes Arch Clin Exp Ophthalmol. 2007;245:1749–1758. - PubMed

LinkOut - more resources