. 2024 Sep 3;14(1):20499.
doi: 10.1038/s41598-024-68684-1.

Optimising 4D imaging of fast-oscillating structures using X-ray microtomography with retrospective gating

Affiliations

Optimising 4D imaging of fast-oscillating structures using X-ray microtomography with retrospective gating

Antoine Klos et al. Sci Rep. .

Abstract

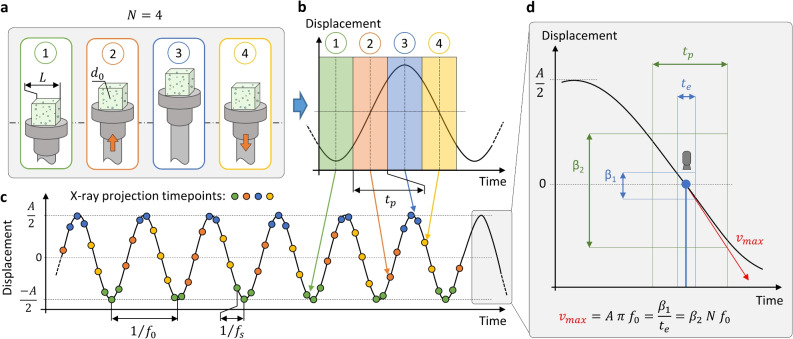
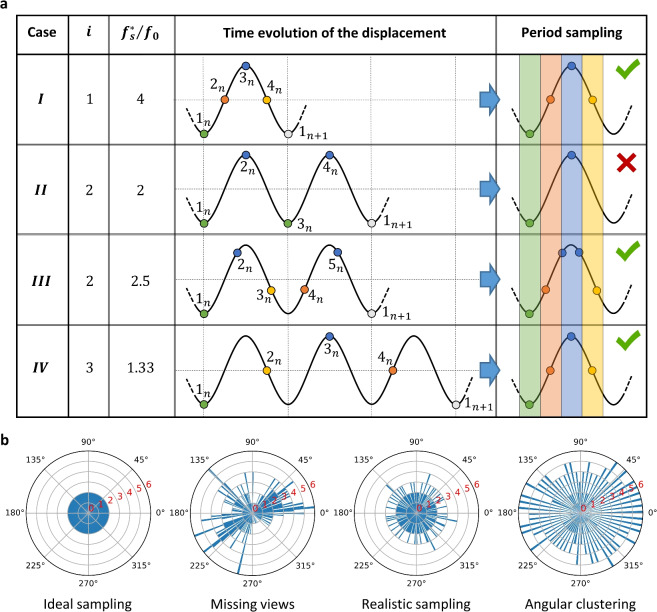
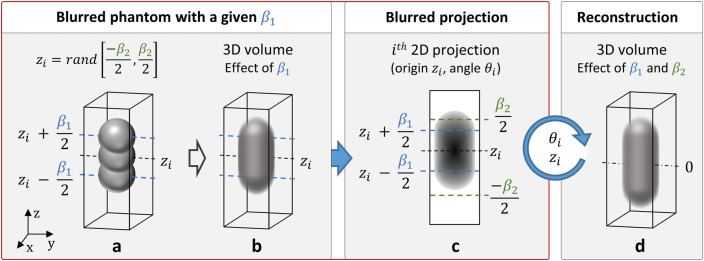
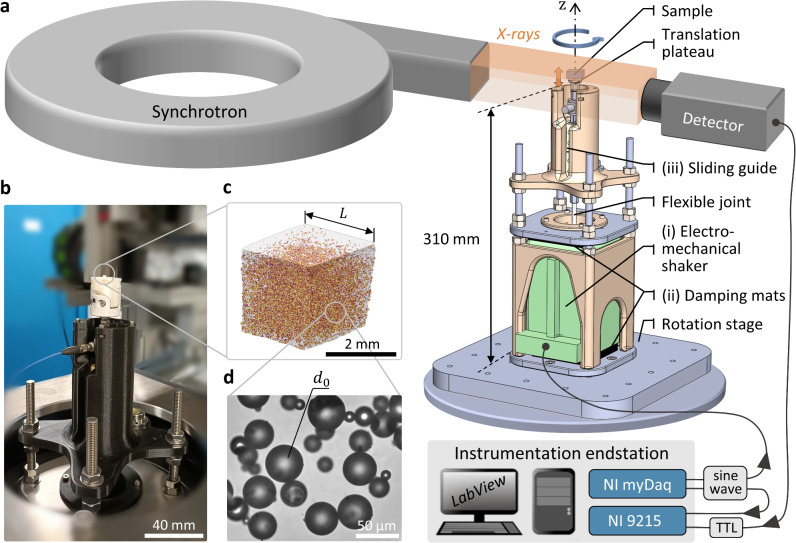
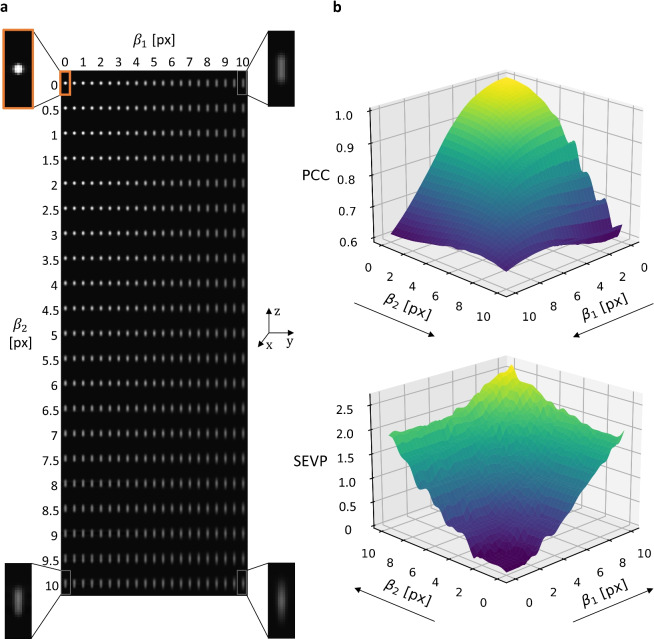
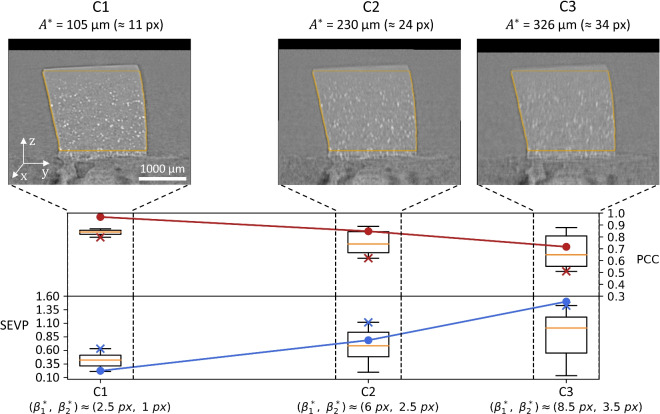
Imaging the internal architecture of fast-vibrating structures at micrometer scale and kilohertz frequencies poses great challenges for numerous applications, including the study of biological oscillators, mechanical testing of materials, and process engineering. Over the past decade, X-ray microtomography with retrospective gating has shown very promising advances in meeting these challenges. However, breakthroughs are still expected in acquisition and reconstruction procedures to keep improving the spatiotemporal resolution, and study the mechanics of fast-vibrating multiscale structures. Thereby, this works aims to improve this imaging technique by minimising streaking and motion blur artefacts through the optimisation of experimental parameters. For that purpose, we have coupled a numerical approach relying on tomography simulation with vibrating particles with known and ideal 3D geometry (micro-spheres or fibres) with experimental campaigns. These were carried out on soft composites, imaged in synchrotron X-ray beamlines while oscillating up to 400 Hz, thanks to a custom-developed vibromechanical device. This approach yields homogeneous angular sampling of projections and gives reliable predictions of image quality degradation due to motion blur. By overcoming several technical and scientific barriers limiting the feasibility and reproducibility of such investigations, we provide guidelines to enhance gated-CT 4D imaging for the analysis of heterogeneous, high-frequency oscillating materials.

Keywords: Fast-oscillating multiscale structures; Motion blur limitation; Retrospective gating; Synchrotron X-ray microtomography; Tomographic simulation; Vibration testing.


Conflict of interest statement

The authors declare no competing interests.

Figures

Figure 1
Figure 1
(a) Illustration of N=4 phases of a cubic sample subjected to a rigid body oscillation. (b) Representation of a typical oscillation period splitted into N=4 temporal phases. (c) Illustration of the phase-based projection sorting procedure for retrospectively gated-CT. (d) Definition of β1, β2 and vmax on a detailed view inside an oscillation period. The times te and tp are arbitrary. The red arrow represents the maximum slope during sinusoidal motion, and the blue point a projection acquisition shot-instant.
Figure 2
Figure 2
(a) Scheme of the different cases for the optimisation of the projection sampling rate, fs. N=4. (b) Polar histograms of typical angular distribution of the projections of a phase after the sorting process, for illustration purposes. The angle represents the angular position of the projections and the radial axis the number of projections per bin (n = 360 projections, bin width = 2). The ideal sampling is generally obtained in conventional CT. Angular clustering and missing views distribution produce strong image artefacts.
Figure 3
Figure 3
Procedure used for tomography simulation on a spherical phantom for a given couple of motion blur descriptors. The effect of β1 is visible when generating the projections whereas the one of β2 is only observable after the reconstruction.
Figure 4
Figure 4
(a) Schematic view of the vibratory setup and its simplified wiring diagram during in situ testing on the PSICHE beamline. (b) Picture of the setup on the motorised rotation stage. To deal with space requirement the setup was inserted inside the hollow stage. (c) 3D rendering of the imaged sample. (d) Optical microscopy image of a representative distribution of the glass beads filling the sample.
Figure 5
Figure 5
(a) Vertical slices of 3D images of a sphere (d0=4) obtained by tomography simulation, and artificially blurred to mimic various levels of motion artefacts β1 and β2. The orange box denotes the static reconstructed sphere (β1=β2=0). Detailed view of the slices are given extreme couples (β1=β2=0), (β1=10 px,β2=0), (β1=0,β2=10 px), (β1=β2=10 px). (b) (top) 3D surface plot of the PCC computed between each blurred simulation and the static one. (bottom) Idem for the SEVP with switched axis for better illustration.
Figure 6
Figure 6
Optimised projection sampling rate fs according to the number of phases N and to the minimum time between consecutive exposures tl (typically close to te). Represented values correspond to case I if applicable or to case III otherwise (Fig. 2a), for f0=100 Hz. White lines depict boundaries of iso-i regions, and the black cross highlights the value of fs/f0 for the presented experimental cases Ci.
Figure 7
Figure 7
Example of typical optimised result for case study C2. (a) Vertical slice of the static reference. (b) 10 out of 30 vertical slices of the vibrating sample, and corresponding polar histograms of the angular sampling of projections (bin width = 1). The supplementary Video “C2_Sphere_100Hz_MR.gif” provides a dynamic version of the vertical slices. (c) Plots of the measured 3D translation using rigid registration. Black arrows denote maximum slopes of the sinusoidal motion. d. Image quality metrics between the static reference and each of the 30 registered phases. Grey boxes depict phases with minimal image quality. (e) Barplot of the number of projections per phase n.
Figure 8
Figure 8
(Top) Vertical slices of registered volumes at maximum motion speed for each case studies. Orange outlines denote the boundaries of the ROI for PCC and SEVP computations. (Bottom) Boxplots of the result of image quality metrics between the static reference and each of the 30 registered phases for the three case studies, as a function of the blur descriptors. Crosses show the value for the specific phase that happened at the maximum speed, for which the blur descriptors are defined. The points denote the interpolated results of the tomography simulation for these specific couples β1, β2.
Figure 9
Figure 9
Spatiotemporal resolution expressed as pixel size versus phase width for state of the art CT applied to the imaging of periodic systems. The current limit for conventional time-resolved X-ray tomography was proposed by García-Moreno et al.. Boundaries for laboratory and clinical-CT were approximated from the latter trend. The database on which this figure is based is available in Supplementary Table S1. (1) Drangova et al., (2) Guo et al., (3) Murrie et al., (4) Schuler et al., (5) Dubsky et al., (6) Walker et al., (7) Mokso et al., (8) Hoshino et al., (9) Hoshino et al., (10) Tekawade et al., (11) Wu et al., (12) Fardin et al., (13) Maiditsch et al., (14) Matsubara et al., (15) Dejea et al., (16) Schmeltz et al..

Similar articles

References

    1. Ford, N. L. et al. Prospective respiratory-gated micro-CT of free breathing rodents. Med. Phys.32, 2888–2898. 10.1118/1.2013007 (2005). 10.1118/1.2013007 - DOI - PubMed
    1. Lovric, G. et al. Tomographic in vivo microscopy for the study of lung physiology at the alveolar level. Sci. Rep.7, 12545. 10.1038/s41598-017-12886-3 (2017). 10.1038/s41598-017-12886-3 - DOI - PMC - PubMed
    1. Dejea, H. et al. A tomographic microscopy-compatible Langendorff system for the dynamic structural characterization of the cardiac cycle. Front. Cardiovasc. Med.9, 1023483. 10.3389/fcvm.2022.1023483 (2022). 10.3389/fcvm.2022.1023483 - DOI - PMC - PubMed
    1. Maiditsch, I. P., Ladich, F., Heß, M., Schlepütz, C. M. & Schulz-Mirbach, T. Revealing sound-induced motion patterns in fish hearing structures in 4D: A standing wave tube-like setup designed for high-resolution time-resolved tomography. J. Exp. Biol.225, jeb243614. 10.1242/jeb.243614 (2022). 10.1242/jeb.243614 - DOI - PMC - PubMed
    1. Schmeltz, M. et al. The human middle ear in motion: 3D visualization and quantification using dynamic synchrotron-based X-ray imaging. Commun. Biol.7, 157. 10.1038/s42003-023-05738-6 (2024). 10.1038/s42003-023-05738-6 - DOI - PMC - PubMed

LinkOut - more resources