. 2024 Sep 3;15(1):7684.
doi: 10.1038/s41467-024-51991-6.

A molecular mechanism to diversify Ca2+ signaling downstream of Gs protein-coupled receptors

Affiliations

A molecular mechanism to diversify Ca2+ signaling downstream of Gs protein-coupled receptors

Julian Brands et al. Nat Commun. .

Abstract

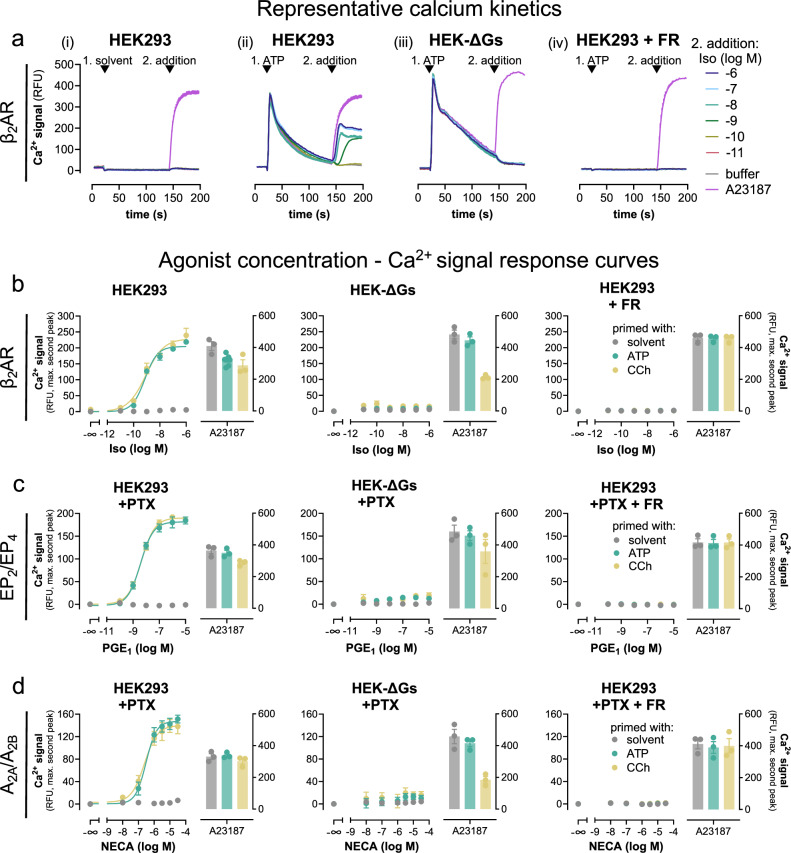
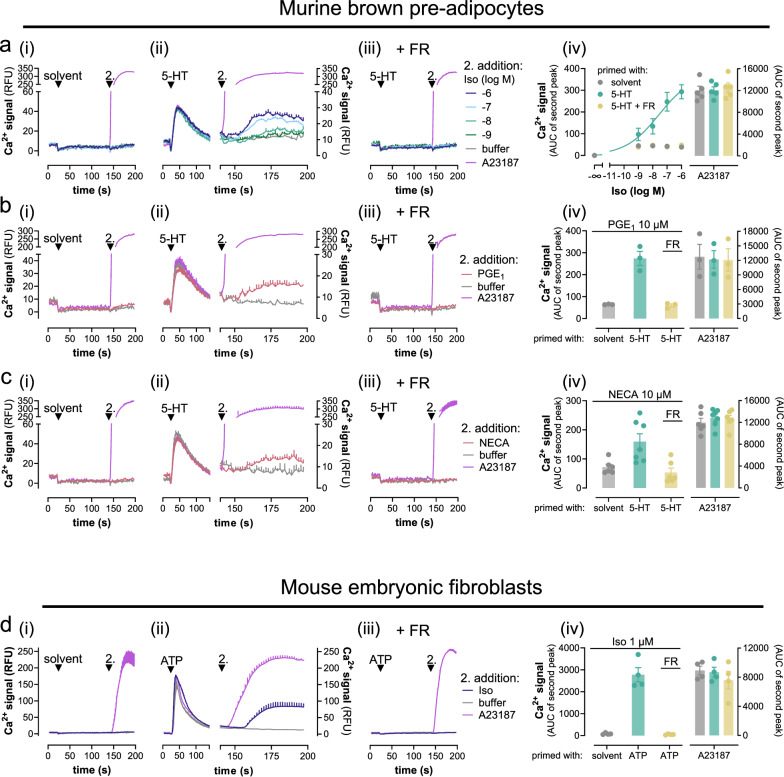
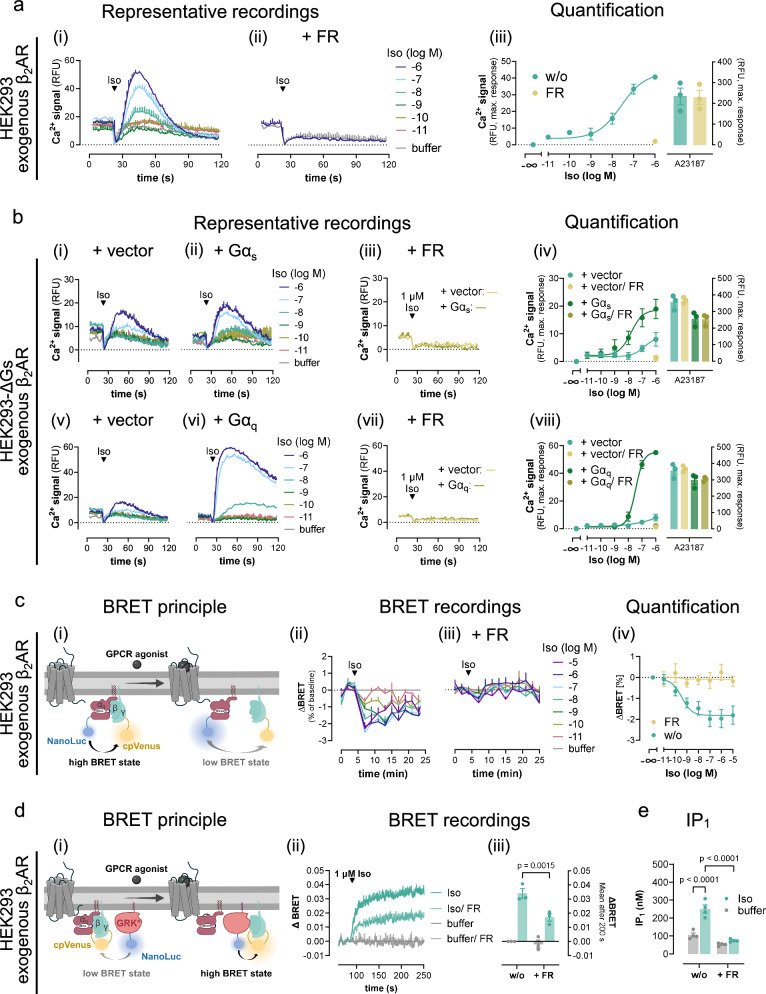
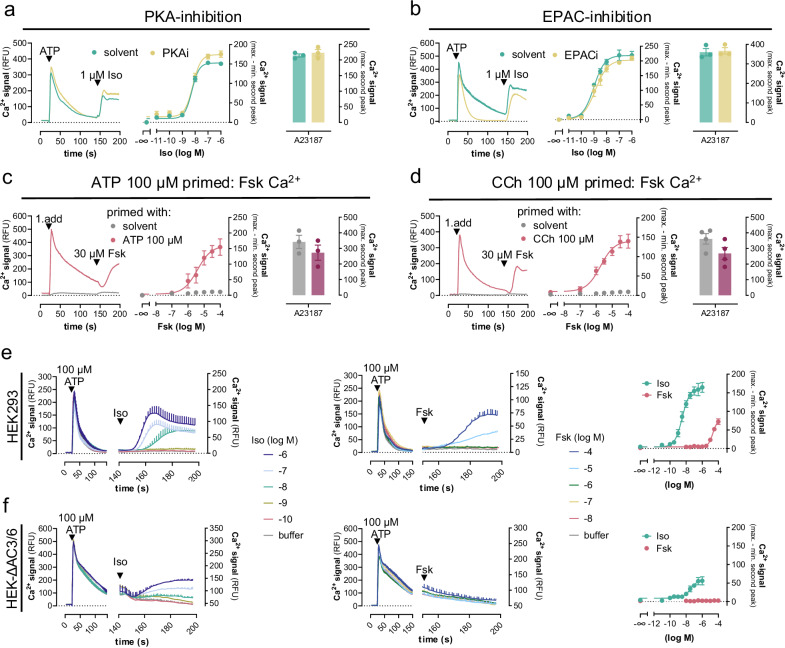
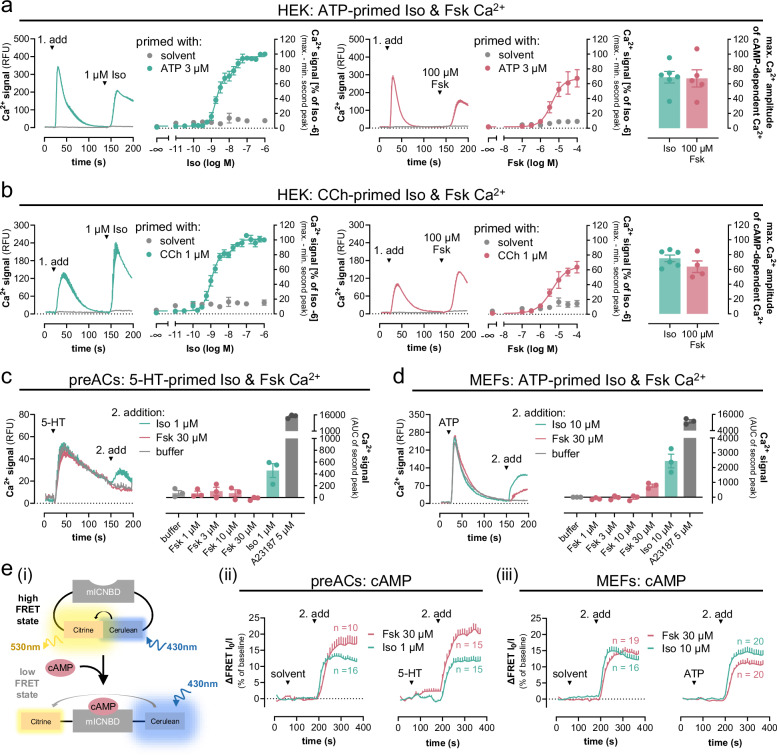
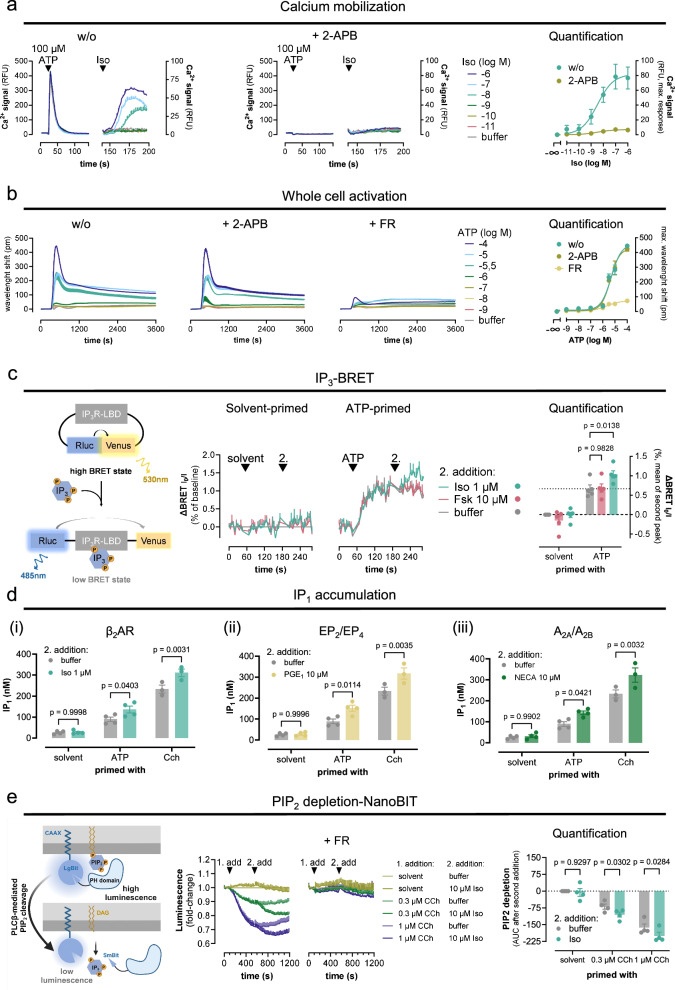
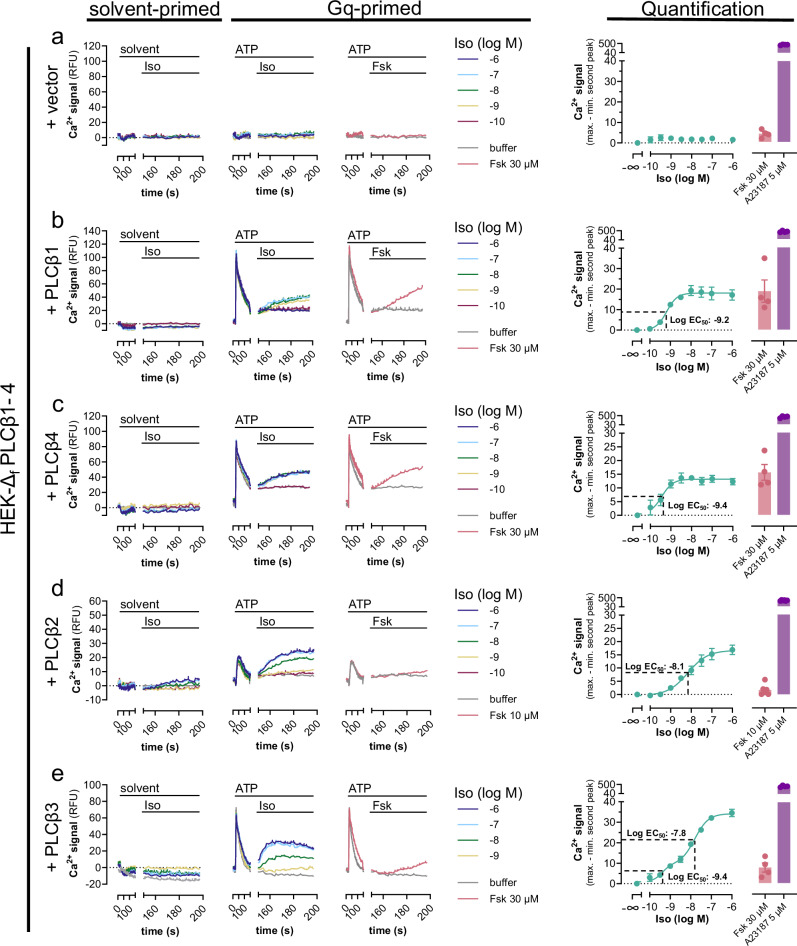
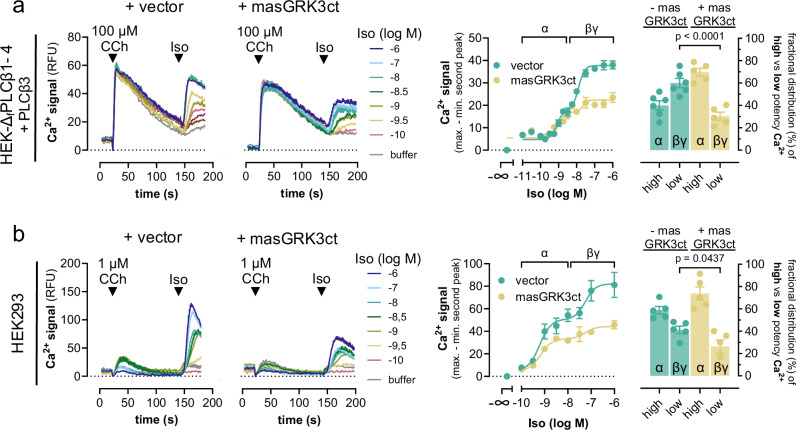
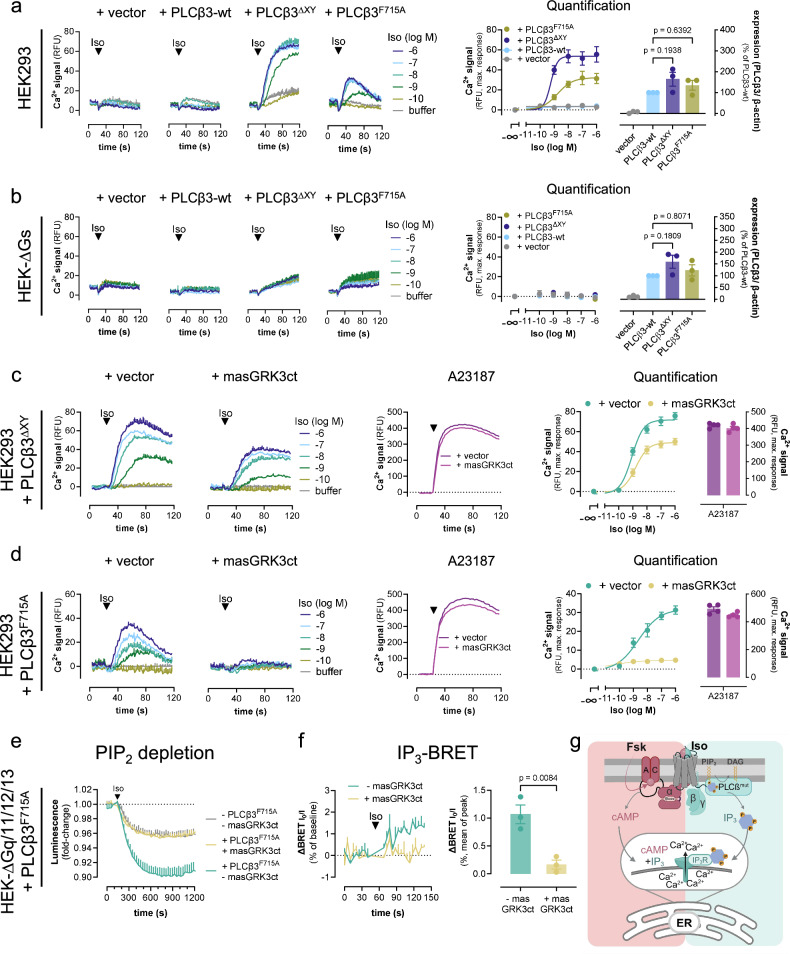
A long-held tenet in inositol-lipid signaling is that cleavage of membrane phosphoinositides by phospholipase Cβ (PLCβ) isozymes to increase cytosolic Ca2+ in living cells is exclusive to Gq- and Gi-sensitive G protein-coupled receptors (GPCRs). Here we extend this central tenet and show that Gs-GPCRs also partake in inositol-lipid signaling and thereby increase cytosolic Ca2+. By combining CRISPR/Cas9 genome editing to delete Gαs, the adenylyl cyclase isoforms 3 and 6, or the PLCβ1-4 isozymes, with pharmacological and genetic inhibition of Gq and G11, we pin down Gs-derived Gβγ as driver of a PLCβ2/3-mediated cytosolic Ca2+ release module. This module does not require but crosstalks with Gαs-dependent cAMP, demands Gαq to release PLCβ3 autoinhibition, but becomes Gq-independent with mutational disruption of the PLCβ3 autoinhibited state. Our findings uncover the key steps of a previously unappreciated mechanism utilized by mammalian cells to finetune their calcium signaling regulation through Gs-GPCRs.


Conflict of interest statement

The authors declare no competing interests.

Figures

Fig. 1
Fig. 1. Gs-GPCR mobilization of intracellular Ca2+ fully depends on active Gq.
In all HEK293 lines, calcium signals were recorded following a two-step addition protocol. This is exemplified in a for the β2AR. At t = 20 s, either solvent (ai) or Gq stimulus ATP 100 µM (aiiaiv) was added, followed by a second addition at t = 140 s of either Iso or Calcium ionophore A23187. aiv Cells were pretreated with 1 µM of the Gq inhibitor FR. bd Concentration-effect curves derived from the maximum calcium response of the second addition of b Iso on β2AR, c PGE1 on prostanoid EP2 and EP4, d NECA on A2A and A2B receptors, or A23187 (5 µM) after prior addition of solvent (no priming), ATP (100 µM) or CCh (100 µM). To exclude the contribution of endogenous Gi/o-coupled prostanoid and adenosine receptors to Gs-Ca2+, cells were pretreated overnight (16 h) with 100 ng/ml of the Gi/o inhibitor pertussis toxin (PTX). Representative traces are means + SEM, averaged data are mean ± SEM of n biologically independent experiments (b: CCh and solvent n = 3, ATP n = 7; c: n = 3; d: n = 3), each performed in duplicate. Source data are provided as a Source Data file.
Fig. 2
Fig. 2. Gs-Calcium demands Gq input in the endogenous signaling context.
Representative calcium recordings and their quantification obtained in primary murine brown pre-adipocytes (preACs) (ac) and mouse embryonic fibroblasts (MEFs) (d) following a two-step addition protocol. At t = 20 s, cells were primed with solvent (aidi), 10 µM 5-hydroxytryptamine (5-HT) (aii, iiicii, iii), or 1 µM ATP (dii,iii), followed by a second addition at t = 140 s of the Gs-GPCR stimuli Iso (a), 10 µM PGE1 (b), 10 µM NECA (c), or 10 µM Iso (d) in the presence and absence of 1 µM FR. aiv Concentration-effect relationships calculated from the data in (ai–iii) are plotted as the area under the curve (AUC) elicited by Iso stimulation. bivdiv Bar chart quantification of exemplary data from bi–iiidi–iii including the viability control A23187 (5 µM). Representative recordings are mean + SEM, averaged data are mean ± SEM of n biologically independent experiments (aiv: n = 5; biv: n = 3; civ: solvent and 5-HT + FR n = 6, 5-HT n = 7; div: n = 4), each performed in duplicate. Cells were pretreated with 100 ng/ml of the Gi/o inhibitor PTX 16 h prior to the calcium measurements (ad). Source data are provided as a Source Data file.
Fig. 3
Fig. 3. Direct Gq coupling of overexpressed β2AR eliminates the need for heterologous Gq priming.
a, b Representative Ca2+ recordings in response to Iso addition after t = 20 s and corresponding quantification of maximum Ca2+ peak responses collected in HEK293 (a) or HEK-∆Gs cells (b) transfected with the expression plasmid coding for the β2AR. HEK-∆Gs cells were cotransfected with either empty vector DNA (bi,v), or plasmids coding for Gαs (bii, iii), or Gαq proteins (bvi, vii), respectively. ci Cartoon representation of the BRET-based Gq-CASE biosensor which reports separation of Gαq from Gβγ after activation as a decrease of BRET. cii–iv Concentration-dependent activation of Gq protein BRET evoked in HEK293 cells with exogenous expression of the β2AR and the Gq-CASE biosensor, displayed as real-time BRET recordings and concentration-effect curve derived from the BRET changes after 9 min. di Schematic for the BRET-based Gβγ release assay monitoring freed Gβγ dimers after G protein activation of heterotrimers harboring unmodified Gα subunits. dii–iii Iso-induced BRET increase between Venus-labeled Gβγ and the membrane-associated C-terminal fragment of the G protein-coupled receptor kinase 3 fused to NanoLuciferase (masGRK3ct-NanoLuc), shown as real-time BRET recordings and their bar chart quantification. e Inositol monophosphate (IP1) accumulation measured in naive HEK293 cells transfected to express the β2AR. Where indicated, cells were pretreated with FR to silence the function of Gq proteins (1 µM in ad; 10 µM in e). Representative Ca2+ traces and real-time BRET recordings are mean + SEM, averaged data are mean ± SEM of n biologically independent experiments (aiii: n = 3; biv: n = 3; bviii: n = 3; civ: w/o n = 4, FR n = 5; diii: n = 3), each performed in duplicate. IP1 accumulation data (e) are mean ± SEM of four independent experiments performed in technical triplicates. Statistical significance was calculated with a two-way ANOVA with Fisher´s post-hoc analysis. Source data are provided as a Source Data file. ci and di, created with BioRender.com released under a Creative Commons Attribution-NonCommercial-NoDerivs 4.0 International license https://creativecommons.org/licenses/by-nc-nd/4.0/deed.en”.
Fig. 4
Fig. 4. Gs-GPCRs use two separable calcium release mechanisms, both of which depend on prior Gq priming.
Calcium mobilization in HEK293 and HEK-∆AC3/6 cells following the two consecutive addition protocol. Images show representative real-time Ca2+ recordings, concentration-effect curves derived therefrom, and bar chart quantification for the enhancement of cytosolic Ca2+ by the calcium ionophore A23187 (5 µM). a, b Ca2+ responses in HEK293 cells in the absence or presence of (a) 10 µM PKA-inhibitor (PKI14-22) or (b) 25 µM EPAC-inhibitor (HJC0197) after priming with 100 µM ATP and followed by addition of Iso. c, d Fsk-Ca2+ in HEK293 cells with and without prior Gq priming. e, f Iso- and Fsk-induced cytosolic Ca2+ increase in HEK293 (e) and HEK-∆AC3/6 cells (f) after ATP priming. Representative calcium traces are means + SEM. Quantified data are mean values ± SEM for n independent biological experiments (ac: n = 3; d: n = 4; e: Iso n = 4, Fsk n = 9; f: n = 4), each performed in duplicate. Source data are provided as a Source Data file.
Fig. 5
Fig. 5. Fsk is a proxy to discriminate cAMP-dependent from cAMP-independent Ca2+ after Gq priming in recombinant and primary cells.
ad Calcium mobilization in HEK293 cells (a, b), primary pre-adipocytes (preACs, c), and MEFs (d) following the two consecutive addition protocol. a, b Iso- and Fsk-induced cytosolic Ca2+ increase in HEK293 cells after priming with solvent, 3 µM ATP (a) or 1 µM CCh (b). c, d Iso- and Fsk-Ca2+ in preACs (c) and MEFs (d) after priming with 10 µM 5-HT (c) or 1 µM ATP (d). Data show representative real-time Ca2+ recordings and their quantification as either concentration-effect curves (a, b) or bar charts (c, d) including the calcium ionophore A23187 (5 µM). The two rightmost panels in a and b depict the maximum Ca2+ amplitudes of the Iso-mediated high-potency Ca2+ release response along with Fsk at a maximally active concentration. e Live-cell real-time cAMP imaging in preACs (eii) and MEFs (eiii) using the intramolecular FRET-based pcDNA3.1-mICNDB sensor. ei Cartoon illustration of the sensor principle: The sensor contains the cyclic nucleotide-binding domain from the bacterial MlotiK1 channel (mlCNBD) flanked by citrine and cerulean at its N- and C-terminus, respectively. At low cAMP abundance both fluorophores are in close proximity (high FRET state) but move further apart upon cAMP increases (low FRET state). FRET changes in response to Iso and Fsk under non-primed and primed conditions in preACs (eii) and MEFs (eiii) are means + SEM of the indicated n cells. FRET ratios are inverted to show enhanced cAMP abundance as increased FRET ratios. Pooled data are mean values ± SEM of n independent biological experiments (a: Iso n = 6, Fsk n = 5; b: Iso n = 6, Fsk n = 4; c, d: n = 3), each performed in duplicate. Representative calcium traces are means + SEM. Data in (a, b) were fit to a biphasic concentration-effect model to minimize the distance of the measured data points from the predicted data points without using constraints. Source data are provided as a Source Data file.
Fig. 6
Fig. 6. Gs-coupled β2AR drives IP3 formation, IP1 accumulation, and PIP2 depletion after Gq priming.
a Representative Iso-induced Ca2+ traces and their quantification in the absence or presence of 50 µM of the IP3R antagonist 2-APB in naive HEK293 cells after ATP priming. b Exemplary label-free whole cell activation profiles, based on detection of dynamic mass redistribution (DMR) in response to ATP-stimulated Gq-coupled P2Y receptors in untreated (w/o), 2-APB-treated (50 µM), and FR-treated (1 µM) HEK293 cells, and corresponding quantification. c BRET-based real-time IP3 detection following a two consecutive addition protocol. Cartoon illustrating the IP3 intramolecular BRET biosensor principle. In IP3-free conditions, energy donor Renilla luciferase (Rluc) and energy acceptor Venus, each fused to the IP3R ligand binding domain (LBD) are in close proximity (high BRET state). Binding of an IP3 molecule triggers donor:acceptor separation, resulting in a BRET decrease (low BRET state). BRET ratios are plotted as reciprocals of the I/Io values. di–iii Agonist-induced IP1 accumulation in HEK293 cells with and without ATP (100 µM) or CCh (100 µM) priming using Iso (di), PGE1 (dii), and NECA (diii) to stimulate β2AR, EP2/EP4, and A2A/A2B, respectively. e Iso-induced PIP2 depletion after Gq priming. Schematic of the PIP2 hydrolysis NanoBiT-based biosensor. PIP2 hydrolysis is reflected by rapid translocation of the Small BiT (SmBiT)-tagged PH domain of PLCδ1 from plasma membrane-localized Large BiT (LgBiT)-CAAX to the cytosol resulting in decreased luminescence. Real-time recordings in (a, b) are mean values + SEM. IP3 (c) and PIP2 (e) recordings, concentration-effect curves (a, b), and bar charts (ce) are mean values ± SEM for n independent biological experiments (a: n = 4; b: n = 3; c: n = 5; d: solvent and ATP n = 4, CCh n = 3; e: n = 4). Ca2+ measurements are duplicates; DMR, IP1 accumulation, and PIP2 depletion are triplicate, and IP3-BRET time-courses are quadruplicate determinations. Statistical significance was calculated with a two-way ANOVA with Dunnett’s (c) and Šídák’s (d, e) post-hoc analysis. Source data are provided as a Source Data file. c and e was created with BioRender.com released under a Creative Commons Attribution-NonCommercial-NoDerivs 4.0 International license https://creativecommons.org/licenses/by-nc-nd/4.0/deed.en”.
Fig. 7
Fig. 7. PLCβ2 and β3, but not PLCβ1 and β4, use an additional Gs-dependent, cAMP-independent Ca2+ release pathway.
HEK-∆fPLCβ1–4 cells transiently transfected with either empty expression vector (a) or plasmid cDNA coding for each individual PLCβ1–4 isoform (be) were primed with solvent or 100 µM ATP (first addition at t = 20 s) followed by a second addition at t = 140 s of Iso or Fsk as indicated. Solvent-primed representative Ca2+-fluorescence recordings are buffer-corrected, while Gq-primed exemplary Ca2+ fluorescence traces are not. Ca2+ responses are quantified as concentration-effect curves for net mean peak responses to Iso, or as bar charts for Fsk and calcium ionophore A23187. Inflection points are marked with the corresponding EC50 values. Representative traces are presented as mean values + SEM, averaged data are mean values ± SEM of n biological replicates (ac, e: n = 4; d: n = 6), each performed in duplicates. Data in e were fit to a biphasic concentration-effect model to minimize the distance of the measured data points from the predicted data points. Slope factors nH1 and nH2 were constrained to equal 2.0 and 1.3 (r2 = 0.97) respectively. Statistical significance was calculated with a two-way ANOVA with Šídák’s post-hoc analysis. Source data are provided as a Source Data file.
Fig. 8
Fig. 8. Gs-derived Gβγ drives the Gs-dependent, cAMP-independent Ca2+ release pathway.
a Representative Ca2+ traces and their quantification evoked in HEK-∆fPLCβ1–4 cells transiently transfected to re-express PLCβ3 in the absence and presence of the Gβγ-scavenger masGRK3ct. Cells were primed with CCh at t = 20 s followed by addition of Iso at t = 140 s. b Same experimental setup as in (a) using HEK293-wt cells and 1 µM CCh as the first stimulus. The concentration-response curves derived from the mean net peak responses are divided into a high-potency and a low-potency component, reflecting Gαs-cAMP “α” and Gs-βγ “βγ” contribution, respectively. Bar graphs represent the fractional distribution of high- and low-potency Iso-Ca2+ and its alteration with co-expressed masGRK3ct. Representative traces are mean + SEM, and data points in concentration-response curves are mean ± SEM of n biologically independent experiments (a: vector n = 6, masGRK3ct n = 5; b: n = 5), each performed in duplicate. Source data are provided as a Source Data file.
Fig. 9
Fig. 9. PLCβ3 variants with disabled autoinhibition empower Iso-mediated Gs-βγ-Ca2+ without Gq priming.
a, b Representative Ca2+ traces and corresponding quantification of maximum Ca2+ amplitudes in HEK293 (a) and HEK-ΔGs (b) cells transfected with either empty vector DNA or cDNA plasmids coding for PLCβ3-wt, PLCβ3ΔXY or PLCβ3F715A upon Iso stimulation. Rightmost panels: Western blot quantification of each PLCβ variant. The statistical significance of expression level differences was determined using a one-way ANOVA with Tukey´s post-hoc analysis. c, d Naive HEK293 cells were transfected to express either PLCβ3ΔXY (c) or PLCβ3F715A (d) in the absence (vector) or presence of the Gβγ scavenger masGRK3ct. e Iso-induced PIP2 depletion in HEK-ΔGq/11/12/13 cells transfected to express the PIP2 hydrolysis NanoBiT-based biosensor along with PLCβF715A, β2AR, and masGRK3ct or empty vector DNA as control. f IP3 BRET recordings and corresponding quantification in HEK-ΔGq/11/12/13 cells, transfected to express the IP3-BRET sensor along with PLCβF715A in the absence (empty vector) or presence of masGRK3ct upon addition of Iso or buffer. g Cartoon representation depicting the cellular consequences of cAMP production as well as IP3 formation on mobilization of cytosolic Ca2+ from ER sources. cAMP and IP3 synergize to sensitize ER-localized IP3R channels for mobilization of cytosolic Ca2+. Mutant PLCβ3 variants with crippled autoinhibition produce IP3 without Gq priming in response to Gβγ only. PLCβmut = PLCβ3ΔXY, or PLCβ3F715A. Cells in ad were FR-pretreated (1 µM) to exclude any potential Gq contribution. Representative Ca2+ recordings in ad are shown as mean + SEM, summarized data are mean ± SEM of n independent biological replicates (a, b: n = 3; c, d: n = 4), each performed in duplicate. PIP2 depletion data (e) are mean + SEM of n = 3 experiments, each performed in duplicate. BRET IP3 real-time recordings (f) are depicted as mean + SEM of n = 3 experiments, one performed in triplicate and two in nonuplicate; their summarized data are shown as mean ± SEM; statistical significance was determined using a two-tailed student’s t test. Source data are provided as a Source Data file. g was created with BioRender.com released under a Creative Commons Attribution-NonCommercial-NoDerivs 4.0 International license https://creativecommons.org/licenses/by-nc-nd/4.0/deed.en”.

References

    1. Clapham, D. E. Calcium signaling. Cell131, 1047–1058 (2007). 10.1016/j.cell.2007.11.028 - DOI - PubMed
    1. Bootman, M. D. & Bultynck, G. Fundamentals of cellular calcium signaling: a primer. Cold Spring Harb. Perspect. Biol.12, a038802 (2020). - PMC - PubMed
    1. Taylor, C. W. Regulation of IP3 receptors by cyclic AMP. Cell Calcium63, 48–52 (2017). 10.1016/j.ceca.2016.10.005 - DOI - PMC - PubMed
    1. Berridge, M. J., Bootman, M. D. & Roderick, H. L. Calcium signalling: dynamics, homeostasis and remodelling. Nat. Rev. Mol. Cell Biol.4, 517–529 (2003). 10.1038/nrm1155 - DOI - PubMed
    1. Sunahara, R. K., Dessauer, C. W. & Gilman, A. G. Complexity and diversity of mammalian adenylyl cyclases. Annu. Rev. Pharmacol. Toxicol.36, 461–480 (1996). 10.1146/annurev.pa.36.040196.002333 - DOI - PubMed

Publication types

MeSH terms

LinkOut - more resources