Randomized Controlled Trial
. 2024 Sep 3;15(1):7666.
doi: 10.1038/s41467-024-51453-z.

Long-term cellular immunity of vaccines for Zaire Ebola Virus Diseases

Collaborators, Affiliations
Randomized Controlled Trial

Long-term cellular immunity of vaccines for Zaire Ebola Virus Diseases

Aurélie Wiedemann et al. Nat Commun. .

Abstract

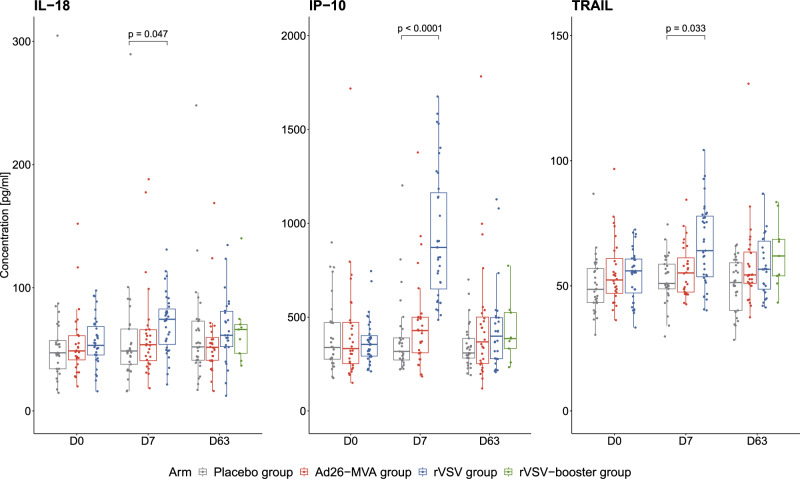
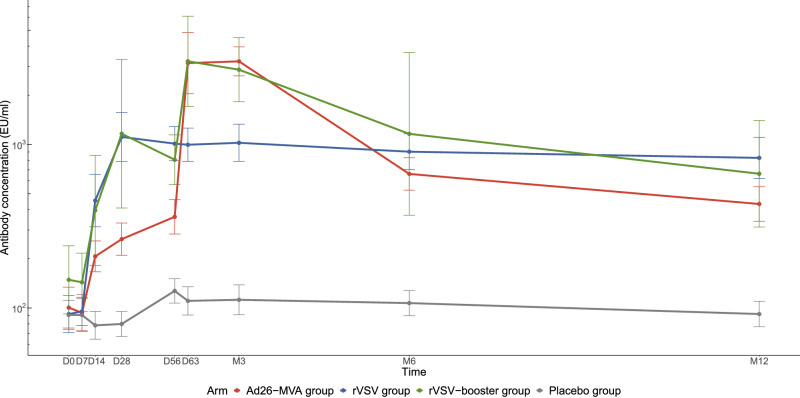
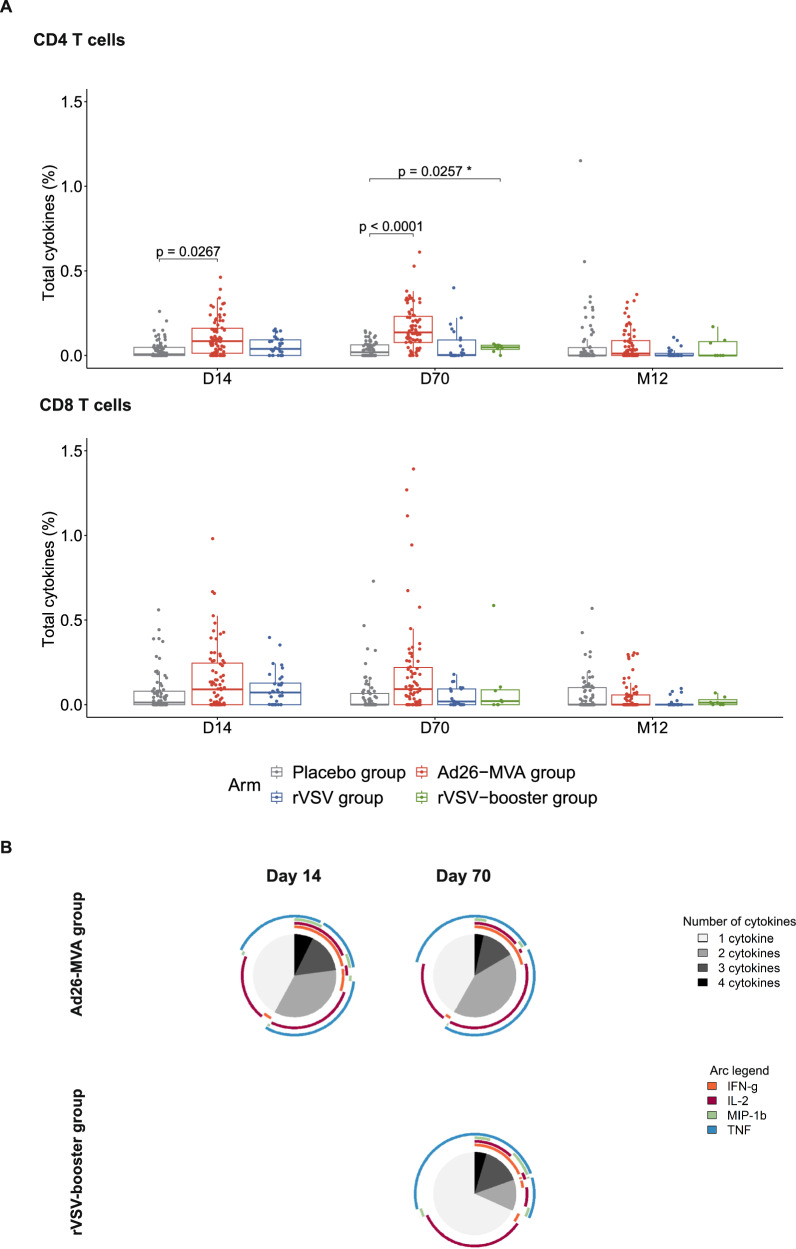
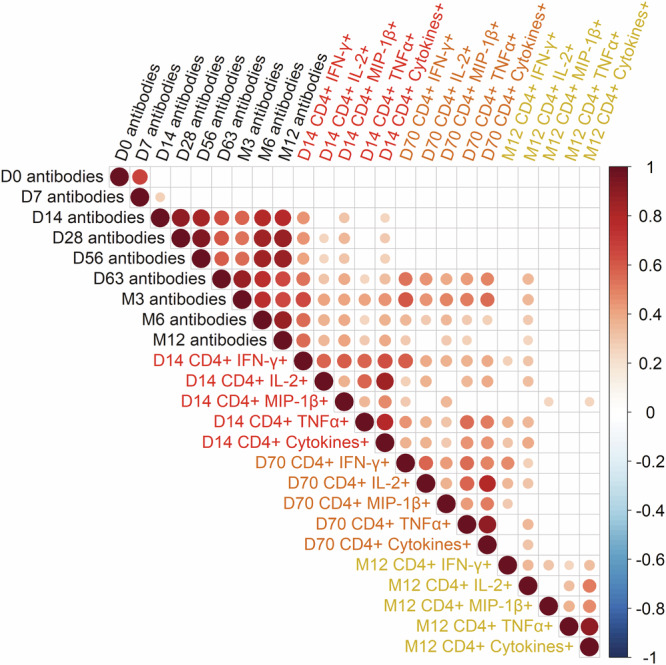
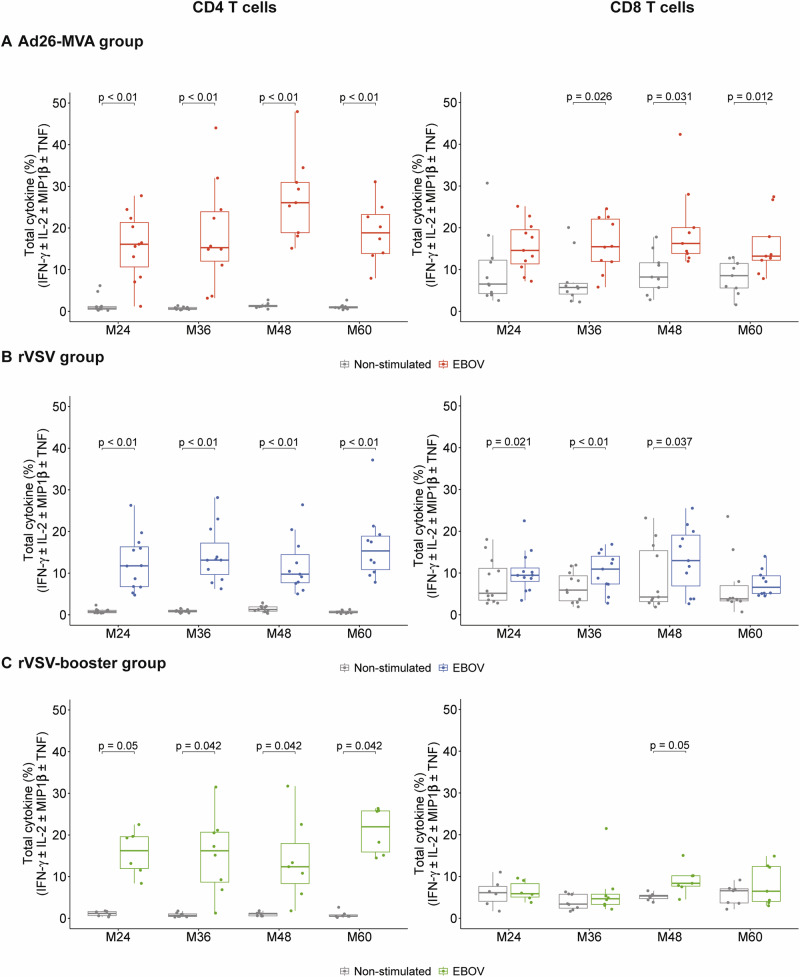
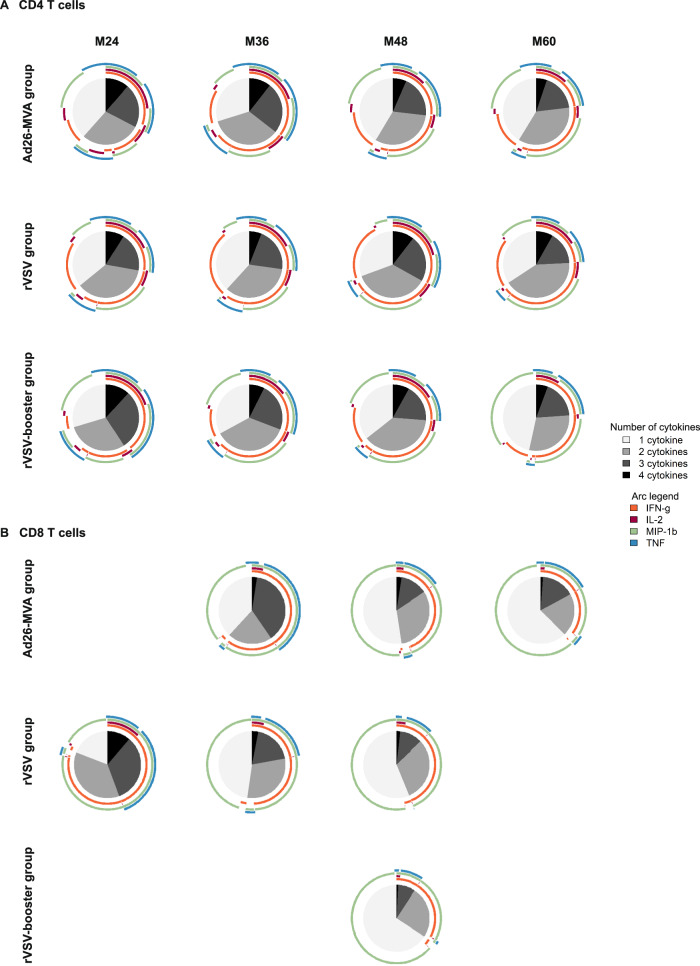
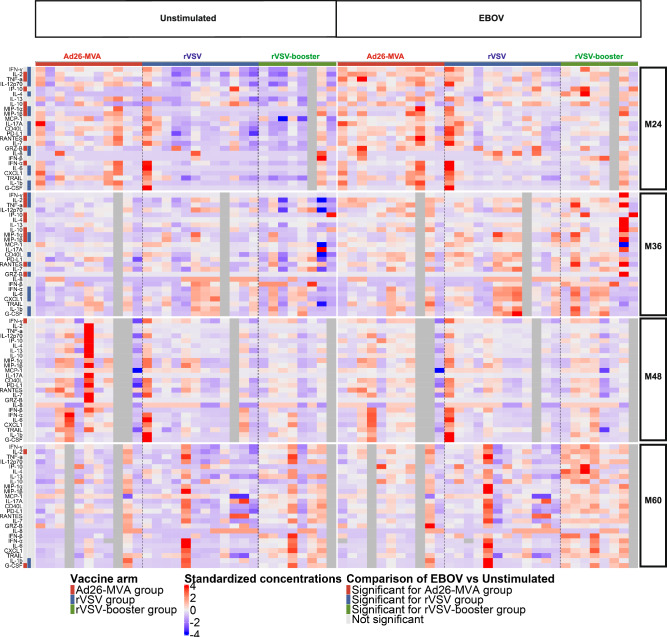
Recent Ebola outbreaks underscore the importance of continuous prevention and disease control efforts. Authorized vaccines include Merck's Ervebo (rVSV-ZEBOV) and Johnson & Johnson's two-dose combination (Ad26.ZEBOV/MVA-BN-Filo). Here, in a five-year follow-up of the PREVAC randomized trial (NCT02876328), we report the results of the immunology ancillary study of the trial. The primary endpoint is to evaluate long-term memory T-cell responses induced by three vaccine regimens: Ad26-MVA, rVSV, and rVSV-booster. Polyfunctional EBOV-specific CD4+ T-cell responses increase after Ad26 priming and are further boosted by MVA, whereas minimal responses are observed in the rVSV groups, declining after one year. In-vitro expansion for eight days show sustained EBOV-specific T-cell responses for up to 60 months post-prime vaccination with both Ad26-MVA and rVSV, with no decline. Cytokine production analysis identify shared biomarkers between the Ad26-MVA and rVSV groups. In secondary endpoint, we observed an elevation of pro-inflammatory cytokines at Day 7 in the rVSV group. Finally, we establish a correlation between EBOV-specific T-cell responses and anti-EBOV IgG responses. Our findings can guide booster vaccination recommendations and help identify populations likely to benefit from revaccination.


Conflict of interest statement

The authors declare no competing interests.

Figures

Fig. 1
Fig. 1. Quantification of serum-soluble mediators on day (D)0, D7, and D63 after prime vaccination.
Quantification of IL-18, IP-10, and TRAIL (pg/mL) in the serum of 92 vaccinated individuals at D0, D7, and D63 post vaccination (n = 29 placebo (grey), n = 28 Ad26-MVA (red), n = 26 rVSV (blue), n = 9 rVSV-booster (green)). The median values ± IQRs are shown. The box plots display the median (central line), the first and third quartiles (boxes), and the whiskers show 1.5 fold the interquartile range (IQR) above and below the boxes. Two-sided Wilcoxon Mann Whitney tests were used for comparisons between the active vaccine arms and the pooled placebo arms. FDR (Benjamini-Hochberg) method was used to adjust for test multiplicity. The exact p-values for IL-18, IP-10, and TRAIL at D7 in the comparison between the placebo group (grey) and the rVSV group (blue) are p = 0.047, p = 1.153e-07, and p = 0.033, respectively. Source data are provided as a Source Data file.
Fig. 2
Fig. 2. EBOV-GP antibody response induced by the three vaccine strategies up to months 12 after vaccination.
The geometric mean concentration was based on the log10 concentration with the baseline log10 titer and trial site as covariates. An antibody response was measured by FANG ELISA and defined as an antibody concentration of at least 200 enzyme-linked immunosorbent assay units (EU) per milliliter and an increase from baseline in the antibody concentration by at least a factor of 4. The geometric mean concentrations are shown for placebo (grey) n = 29; Ad26-MVA (red) n = 28; rVSV (blue) n = 27; rVSV-booster group (green) n = 9, respectively. The bars indicate 95% confidence intervals. Source data are provided as a Source Data file.
Fig. 3
Fig. 3. Characterization of EBOV-specific T-cell responses induced by the three vaccine strategies on day (D)14, D70, and month 12 after vaccination.
A Total cytokine (IFN-γ ± IL-2 ± MIP1β ± TNF) levels (sum of the Boolean gates) produced by EBOV-specific CD4+ or CD8+ T cells from the Placebo (grey, n = 76), Ad26-MVA (red, n = 79), rVSV (blue, n = 27), and rVSV-booster (green, n = 9) groups after in-vitro stimulation on D14, D70, and month 12 post-prime vaccination. Each dot represents an individual value of total cytokine. Results are presented with the background subtracted. The box plots show the median (middle line) and the first and third quartiles (boxes), and the whiskers show 1.5 fold the interquartile range (IQR) above and below the box. Bivariate model was used for inter-arm comparisons of total cytokine levels of active vaccine groups (rVSV group, rVSV-booster group, and Ad26-MVA group) vs placebo group (grey). FDR (Benjamini-Hochberg) method was used to adjust for test multiplicity for each arm comparison separately. The exact p-value for CD4 at D70 in the comparison between the placebo group (grey) and the Ad26-MVA group (red) is p = 5.5e-08. B Functional composition of EBOV-specific CD4+ T-cell responses induced by the Ad26-MVA vaccine on D14 and D70 and by the rVSV-booster vaccine on D70. Responses are color coded according to the combination of cytokines produced. The arcs identify cytokine-producing subsets (IFN-γ, IL-2, MIP-1b and TNF) within the CD4+ and CD8+ T-cell populations. Source data are provided as a Source Data file.
Fig. 4
Fig. 4. Correlation between antibody and T-cell responses.
Spearman’s correlation matrix between EBOV-GP antibody and CD4+ T-cell responses from day 0 to month 12 after vaccination in all vaccinated individuals. Correlation analyzes were performed using Spearman’s rank correlation with the two-tailed P-value. A FDR method (Benjamini-Hochberg) was used to adjust for test multiplicity. Colors indicate Spearman’s correlation coefficient. Only significant correlations after adjustment for test multiplicity (p < 0.05) are represented. Source data are provided as a Source Data file.
Fig. 5
Fig. 5. Characterization of EBOV-specific T-cell responses induced by the three vaccine strategies at months (M)24, M36, M48, and M60 after vaccination.
Total cytokine (IFN-γ ± IL-2 ± MIP1β ± TNF) levels (sum of the Boolean gates) produced by EBOV-specific CD4+ or CD8+ T cells from individuals in the Ad26-MVA (A), rVSV (B), and rVSV-booster (C) groups following in vitro stimulation on D0 and re-stimulation on D8 with the EBOV peptide pools (1 µg/mL of each) at M24 (n = 11 Ad26-MVA, n = 12 rVSV, n = 6 rVSV-booster), M36 (n = 10 Ad26-MVA, n = 11 rVSV, n = 8 rVSV-booster), M48 (n = 9 Ad26-MVA, n = 11 rVSV, n = 7 rVSV-booster), and M60 (n = 9 Ad26-MVA, n = 10 rVSV, n = 7 rVSV-booster) post-vaccination. The median values ± IQRs are shown. The box plots display the median (central line), the first and third quartiles (boxes), and the whiskers show 1.5 fold the interquartile range (IQR) above and below the boxes. Each dot represents an individual value of total cytokine. Two-sided Wilcoxon signed-rank test was used for comparisons between stimulated and unstimulated responses. FDR method (Benjamini-Hochberg) was used to adjust for test multiplicity for each arm comparison separately. The exact p-values for CD4 T cells in Ad26-MVA group at M24, M36, M48 and M60 in the comparison between the unstimulated condition (grey) and stimulated condition (red) are p = 0.008, for all time points. The exact p-values for CD4 T cells in the rVSV group at M24, M36, M48 and M60 comparing the unstimulated condition (grey) and stimulated condition (blue) are p = 0.002 from M24 to M48 and p = 0.003 for M60. The exact p-value for CD8 T cells at M36 is p = 0.002. Source data are provided as a Source Data file.
Fig. 6
Fig. 6. Polyfunctionality of EBOV-specific T-cell responses induced by the three vaccine strategies at months (M)24, M36, M48, and M60 after vaccination.
Functional composition of EBOV-specific CD4+ (A) and CD8+ (B) T-cell responses induced by the three vaccine strategies at M24, M36, M48, and M60. Responses are color coded according to the combination of cytokines produced. The arcs identify cytokine-producing subsets (IFN-γ, IL-2, MIP-1β, and TNF) within the CD4+ and CD8+ T-cell populations. Source data are provided as a Source Data file.
Fig. 7
Fig. 7. Standardized biomarker expression in culture supernatants induced by EBOV peptide pools at months (M)24, M36, M48, and M60 after vaccination.
Heatmap of supernatants from the PBMCs of vaccinated individuals at M24, M36, M48, and M60 after prime vaccination collected on day 2 after stimulation with EBOV peptide pools (sum of EBOV1 and EBOV2 peptide pools). The colors represent standardized expression values centered around the mean, with a variance equal to 1 for each cytokine and time point. The Wilcoxon U test for paired samples was used for comparisons between EBOV peptide pools and unstimulated responses for each vaccine strategy and time point. Significant differences are represented by colors according to the vaccine strategy. Grey columns represent missing data, when participants were not sampled at the specified time point. Source data are provided as a Source Data file.

References

    1. 2014–2016 Ebola Outbreak in West Africa. https://www.cdc.gov/vhf/ebola/history/2014-2016-outbreak/index.html.
    1. 10th Ebola outbreak in the Democratic Republic of the Congo declared over; vigilance against flare-ups and support for survivors must continue. https://www.who.int/news/item/25-06-2020-10th-ebola-outbreak-in-the-demo....
    1. Ebola virus disease: Vaccines. https://www.who.int/news-room/questions-and-answers/item/ebola-vaccines.
    1. Pollard, A. J. et al. Safety and immunogenicity of a two-dose heterologous Ad26.ZEBOV and MVA-BN-Filo Ebola vaccine regimen in adults in Europe (EBOVAC2): a randomised, observer-blind, participant-blind, placebo-controlled, phase 2 trial. Lancet Infect. Dis.21, 493–506 (2021). - PubMed
    1. Kuhn, J. H. et al. A prophylactic multivalent vaccine against different filovirus species is immunogenic and provides protection from lethal infections with Ebolavirus and Marburgvirus species in non-human primates. Plos One13, e0192312 (2018). - PMC - PubMed

Publication types

MeSH terms

Associated data