. 2024 Dec;30(12):3578-3589.
doi: 10.1038/s41591-024-03239-5. Epub 2024 Sep 3.

A framework for sharing of clinical and genetic data for precision medicine applications

Collaborators, Affiliations

A framework for sharing of clinical and genetic data for precision medicine applications

Ahmed Elhussein et al. Nat Med. 2024 Dec.

Abstract

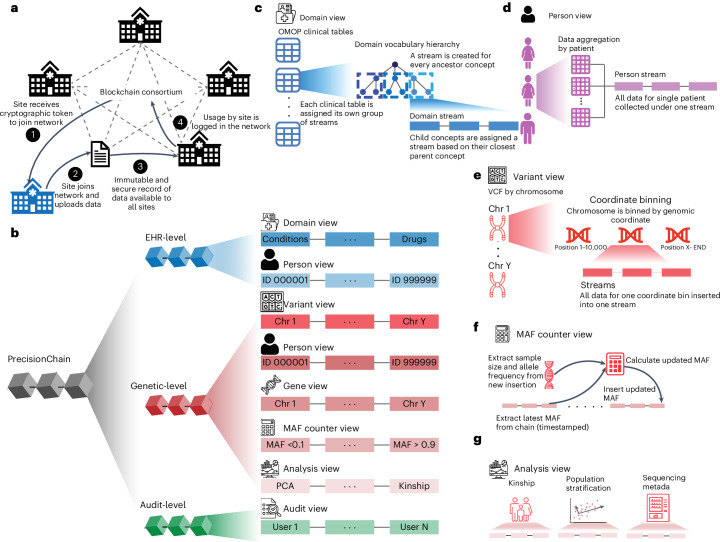
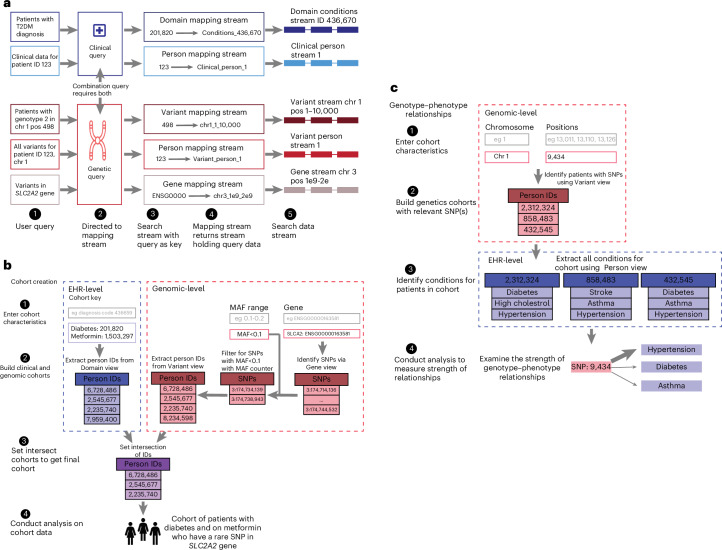
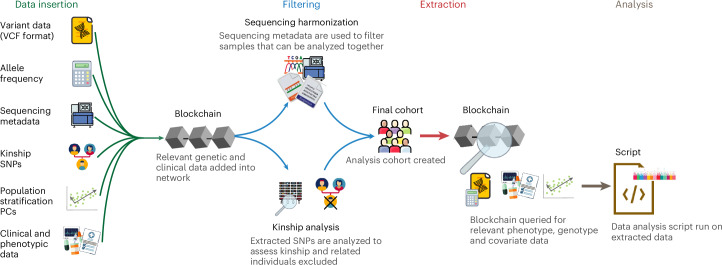
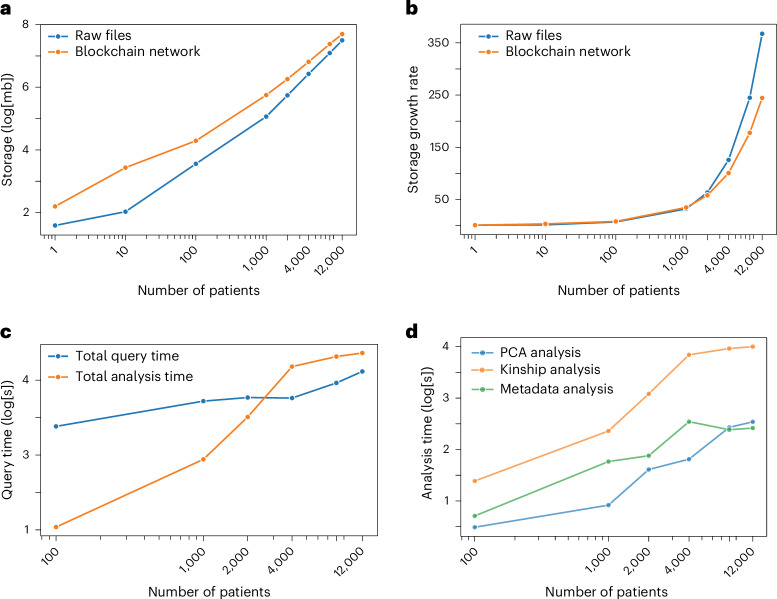
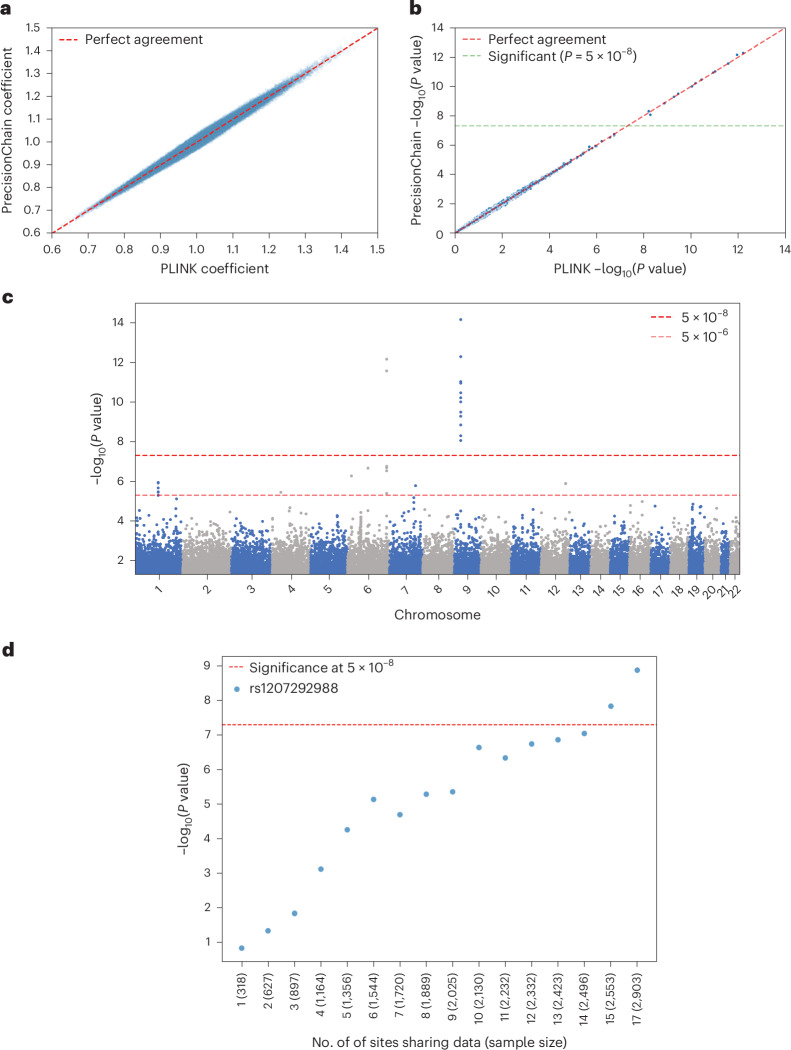
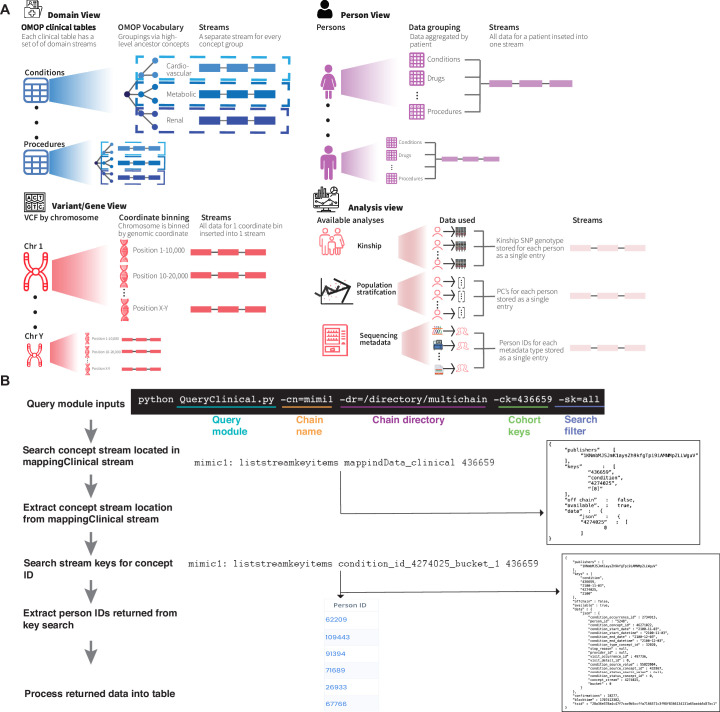
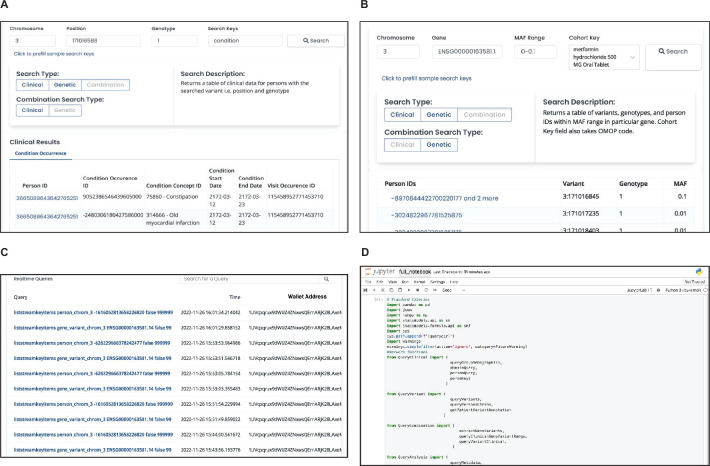
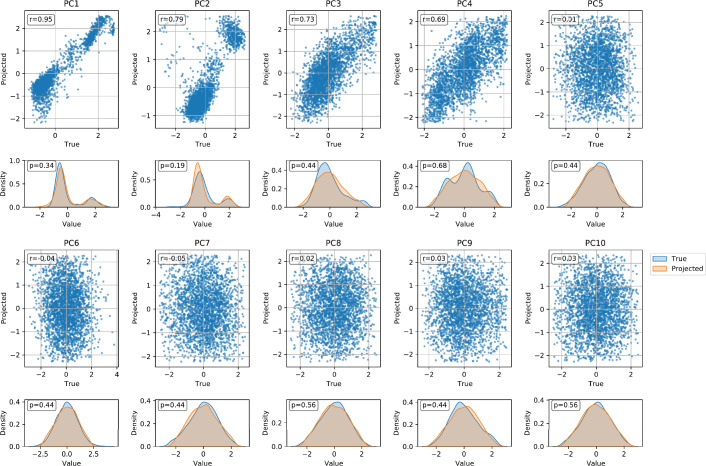
Precision medicine has the potential to provide more accurate diagnosis, appropriate treatment and timely prevention strategies by considering patients' biological makeup. However, this cannot be realized without integrating clinical and omics data in a data-sharing framework that achieves large sample sizes. Systems that integrate clinical and genetic data from multiple sources are scarce due to their distinct data types, interoperability, security and data ownership issues. Here we present a secure framework that allows immutable storage, querying and analysis of clinical and genetic data using blockchain technology. Our platform allows clinical and genetic data to be harmonized by combining them under a unified framework. It supports combined genotype-phenotype queries and analysis, gives institutions control of their data and provides immutable user access logs, improving transparency into how and when health information is used. We demonstrate the value of our framework for precision medicine by creating genotype-phenotype cohorts and examining relationships within them. We show that combining data across institutions using our secure platform increases statistical power for rare disease analysis. By offering an integrated, secure and decentralized framework, we aim to enhance reproducibility and encourage broader participation from communities and patients in data sharing.


Conflict of interest statement

Competing interests: A patent application has been filed by Columbia University with A.E. and G.G listed as inventors (application number: 18/419,923; status of application: pending; specific aspect of manuscript covered in patent application: blockchain-based harmonization of clinical and genetic data). All other authors declare no competing interests.

Figures

Fig. 1
Fig. 1. Conceptual framework.
a, Consortium network. Network is made up of biomedical institutions. All sites share data on a decentralized blockchain platform maintained by all nodes. New joining institutions are verified via cryptographic tokens. Once joined, they can upload new data and access existing data. b, High-level indexing. Indexing of data into three levels: EHR, Genetic and Audit. EHR and Genetic levels are further divided into Domain and Person views and Variant, Person, Gene, MAF counter and Analysis views, respectively. Each view is made up of multiple streams with streams organized by property. c, Indexing of Domain view is by OMOP clinical table. Within each clinical table, we index streams using the OMOP vocabulary hierarchy. d, Indexing of Person views is by person ID with all data for a patient under one stream. This is done for both clinical and genetic data. e, Indexing of Variant view is by chromosome and genomic coordinates. f, MAF counter is organized by MAF range. MAF calculation occurs at every insertion. g, Analysis view records metadata to harmonize sequencing data, assess relatedness among samples and conduct population stratification.
Fig. 2
Fig. 2. Indexing and analysis on PrecisionChain.
a, Mapping stream indexing. Based on the users’ query, search keys are directed to the appropriate stream. A mapping stream is created for every view. Entries in the mapping stream follow a Key:Value structure (Key is the user’s input; Value is the stream where the data are stored). b, Cohort creation. Users input desired clinical characteristics, genes of interest and a MAF filter into the search function. Using the EHR-level ‘Domain view’, patient IDs for those that meet clinical criteria are identified. Using the Genetic-level ‘Gene, MAF counter and Variant views’, the appropriate variants are identified, and patient IDs with those variants are extracted. A set intersection of the two cohorts is done to create a final cohort, which can be analyzed further. c, Genotype–phenotype relationships. Users input variants of interest into the search function. Using the Genetic-level ‘Variant view’, IDs for patients with that variant(s) are extracted. All diagnoses for each patient are retrieved using the EHR-level ‘Person view’. The strength of relationship between each SNP and condition can be examined. ‘Gene view’ can give further information on what genes are carrying the variants, linking the clinical information to detailed genetic information (chr, chromosome; pos, position).
Fig. 3
Fig. 3. Analysis pipeline and data insertion.
All relevant data are first inserted into the chain, including genetic and clinical data, sequencing metadata and population stratification PCs. Variant data are passed through a QC script before insertion. Filtering. Sequencing metadata are queried and filtered to extract patients who can be analyzed together. Patient relatedness is also assessed, and only unrelated samples are included in the final cohort. Extraction. Relevant phenotype, genotype and covariate information for the cohort is retrieved. Analysis. The data are analyzed and results are returned to the user.
Fig. 4
Fig. 4. Scalability.
a, Total data storage. Total data storage requirements (log[mb]) for the raw files and blockchain network at 100, 1,000, 2,000, 4,000, 8,000 and 12,000 patients. b, Storage growth rate. Growth rate in network storage requirements. Values are expressed as a ratio to storage requirements of a single patient network (baseline). c, Query time by query type (in log[s]). Query times broken down by query type. d, Analysis time by analysis type (in log[s]). Analysis times are broken down by analysis type.
Fig. 5
Fig. 5. Analysis results.
a, Effect size coefficient agreement between UK Biobank (UKBB) GWAS results from PLINK and PrecisionChain. Two-sided t-statistics were used. No multiple hypothesis testing was involved. b, P value agreement between UKBB GWAS results from PLINK and PrecisionChain. Two-sided t-statistics were used. No multiple hypothesis testing was involved. c, Manhattan plot for variants with P < 5 × 10−2 in ALS GWAS. Variants are ordered by genomic coordinates. y axis is the −log(P value). Dashed lines represent the significance line (5 × 10−8) and the suggestive line (5 × 10−6). Two-sided t-statistics were used with standard GWAS Bonferroni correction for multiple hypothesis testing with a cutoff of P < 5 × 10−8. d, Statistical strength of signal by the number of sites included in the ALS GWAS. Plot showing the signal strength (−log(P value)) for variant as a function of the number of sites (and sample size in parentheses) participating in the network. This variant is located on the FAM230C gene. Variant is labeled by rsID. Two-sided t-statistics were used with standard GWAS Bonferoni correction for multiple hypothesis testing with a cutoff of P < 5 × 10−8.
Extended Data Fig. 1
Extended Data Fig. 1. Indexing and Querying in PrecisionChain.
(A) Indexing in Domain view is done by clinical table and then OMOP vocabulary hierarchy. Each clinical domain has its own exclusive set of streams. Concepts are grouped by ancestor concept using the vocabulary hierarchy. Each ancestor group gets its own stream. Indexing in Person view is by person (person ID). All data (clinical or genetic) for a patient are inserted into the same stream. For clinical this is irrespective of domain and for variant this is irrespective of genomic coordinate bin. Note within a single stream, multiple patient data can be inserted. Indexing in Variant/Gene view is by genomic coordinate bin. All variants/genes within a set of continuous genomic coordinates are added to a single stream. Indexing in Analysis is by analysis type. Data for kinship and population stratification is stored per sample and data for sequencing metadata is stored by metadata type. (B) Flowchart of query process. User inputs required fields into the query module. The mapping stream is searched for the location of the stream holding data for that concept ID. The stream location is extracted from the mapping stream and the concept ID is searched in that stream. Person IDs returned from the stream search are retrieved and processed into a table. If additional search filters are added, these are processed on the returned data.
Extended Data Fig. 2
Extended Data Fig. 2. GUI.
(A) Combination Clinical Query. Users create a cohort using clinical and genetic data. In this example, a user is querying for patients with variants (MAF 0.0-0.1) in the SLC2A2 gene and are prescribed Metformin (SLC2A2 gene is known to influence metformin response). Variant level information for the cohort is returned. Clicking on the patient ID’s loads further demographic information (B) Combination Genetic Query. Extract clinical data for patients who have a specific variant of interest. In this example diagnosis information for patients with heterozygous genotype at position 3:17101658 (SLC2A2 gene) is returned. Clinical relationships with this variant can now be examined. (C) Administrative view. Administrators can view time-stamped logs of all queries conducted, filtering by user, query type and date. Information viewed is dependent on a user’s access level. (D) Analysis workbook. Users can leverage network functionality to build cohorts and conduct analysis that replicates traditional GWAS workflow.
Extended Data Fig. 3
Extended Data Fig. 3. Comparison of the top 10 actual and 1000GP projected PCs.
For each PC, we show a scatter plot and kernel density estimate (KDE) plot. In the scatter plots, the actual PC values are plotted on the x-axis and the projected PC values are plotted on the y-axis. The Pearson correlation coefficient is shown in the top left corner of each scatter plot. In the KDE plots, the true PC distribution is shown in blue and the projected PC distribution is shown in orange. The p-value of a two-sided Kolmogorov-Smirnov test comparing the two distributions is shown in the top left corner of each KDE plot. No multiple hypothesis correction was needed.
Extended Data Fig. 4
Extended Data Fig. 4. Data Storage in PrecisionChain.
(A) Per node data storage. Data storage requirements (gb) for nodes in a 1, 2, 4, 8, and 16 node network with 100 patients. (B) Per node storage growth rate. Growth rate in network storage requirements. Values expressed as a ratio to storage requirements of a single node network (baseline).
Extended Data Fig. 5
Extended Data Fig. 5. GWAS on PrecisionChain network.
(A) Manhattan plot for variants with p < 5e-2 in UKBB GWAS. In the original study two loci were found to be significant, 6q25 and 9p21. Two-sided t-statistics were used with standard GWAS Bonferroni correction for multiple hypothesis testing with a cut-off p < 5e-8. (B) QQ plot for all variants in UKBB GWAS. Lambda inflation factor=1.024. For GWAS p-values two-sided t-statistics were used with standard GWAS Bonferroni correction for multiple hypothesis testing with a cut-off p < 5e-8. (C) QQ plot for all variants in ALS GWAS. Lambda Inflation Factor = 1.011. For GWAS p-values two-sided t-statistics were used with standard GWAS Bonferroni correction for multiple hypothesis testing with a cut-off p < 5e-8.
Extended Data Fig. 6
Extended Data Fig. 6. GWAS comparison between PrecisionChain and PLINK.
(A) Effect size coefficient agreement between ALS GWAS results from PLINK and PrecisionChain. Two-sided t-statistics were used. There is no multiple hypothesis testing involved. (B) P-value agreement between ALS GWAS results from PLINK and PrecisionChain. Two-sided t-statistics were used. There is no multiple hypothesis testing involved.

References

    1. Ginsburg, G. S. & Phillips, K. A. Precision medicine: from science to value. Health Aff. (Millwood)37, 694–701 (2018). - PMC - PubMed
    1. Ward, R. & Ginsburg, G. S. Local and global challenges in the clinical implementation of precision medicine. In Genomic and Precision Medicine: Foundations, Translation, and Implementation 3rd edn (eds Ginsburg G. S. & Willard, H. F.) 105–117 (Academic Press, 2016).
    1. Precision Cancer Medicine: Challenges and Opportunities (eds Roychowdhury, S. & Van Allen, E. M.) (Springer, 2020).
    1. Acosta, J. N., Falcone, G. J., Rajpurkar, P. & Topol, E. J. Multimodal biomedical AI. Nat. Med.28, 1773–1784 (2022). - PubMed
    1. Haendel, M. A., Chute, C. G. & Robinson, P. N. Classification, ontology, and precision medicine. N. Engl. J. Med.379, 1452–1462 (2018). - PMC - PubMed