. 2024 Sep 3;148(1):37.
doi: 10.1007/s00401-024-02789-9.

Association of quantitative histopathology measurements with antemortem medial temporal lobe cortical thickness in the Alzheimer's disease continuum

Affiliations

Association of quantitative histopathology measurements with antemortem medial temporal lobe cortical thickness in the Alzheimer's disease continuum

Amanda E Denning et al. Acta Neuropathol. .

Abstract

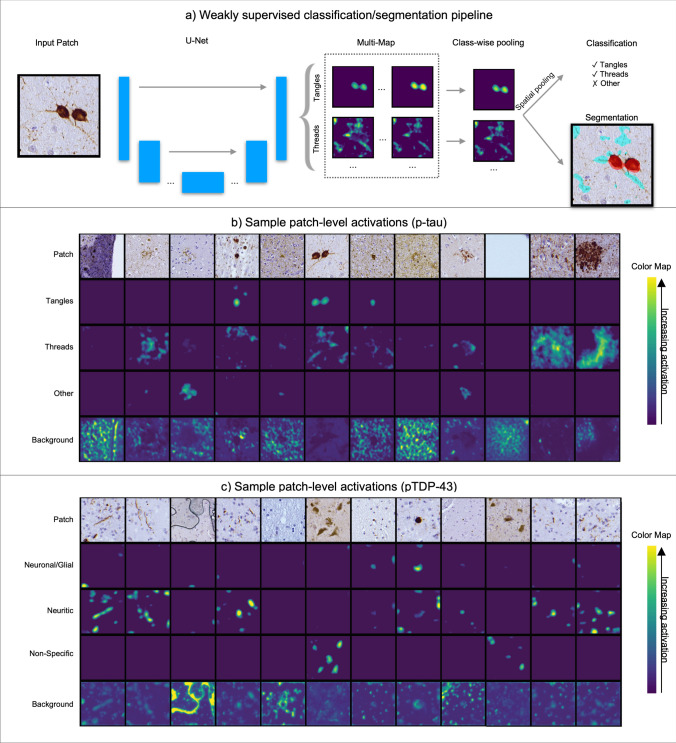
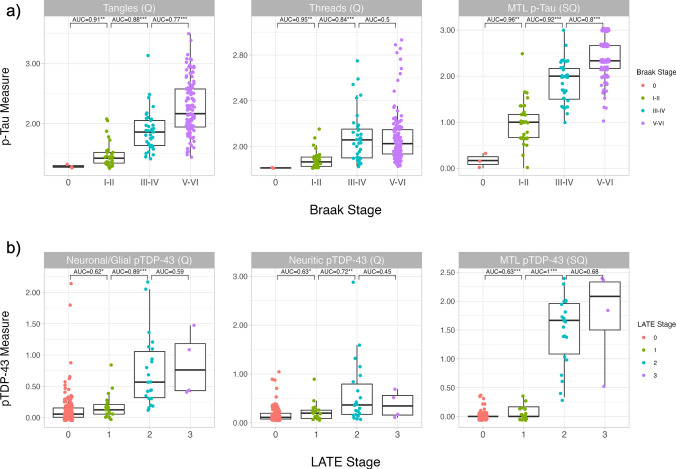
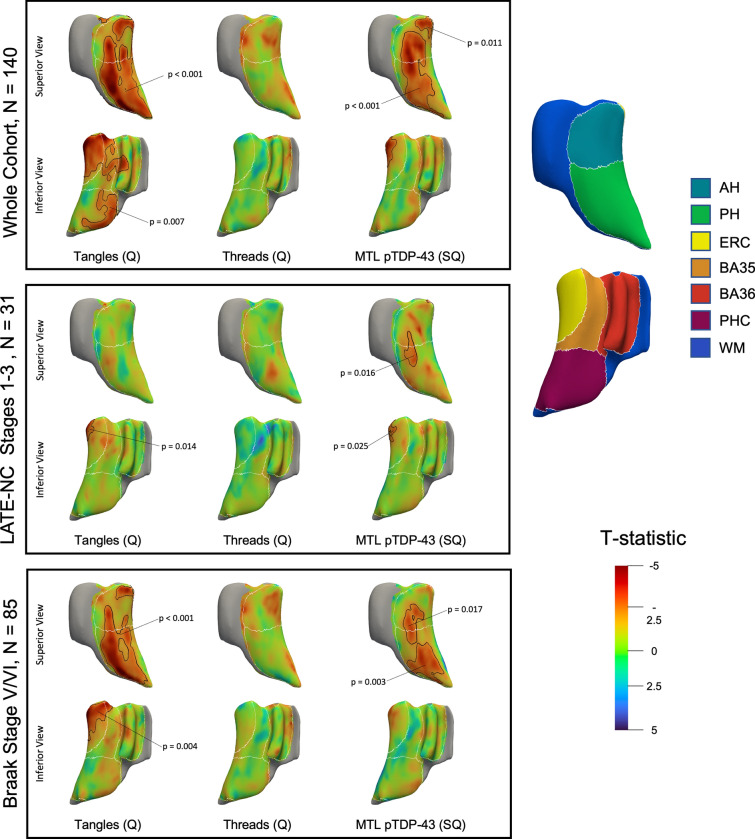
The medial temporal lobe (MTL) is a hotspot for neuropathology, and measurements of MTL atrophy are often used as a biomarker for cognitive decline associated with neurodegenerative disease. Due to the aggregation of multiple proteinopathies in this region, the specific relationship of MTL atrophy to distinct neuropathologies is not well understood. Here, we develop two quantitative algorithms using deep learning to measure phosphorylated tau (p-tau) and TDP-43 (pTDP-43) pathology, which are both known to accumulate in the MTL and are associated with MTL neurodegeneration. We focus on these pathologies in the context of Alzheimer's disease (AD) and limbic predominant age-related TDP-43 encephalopathy (LATE) and apply our deep learning algorithms to distinct histology sections, on which MTL subregions were digitally annotated. We demonstrate that both quantitative pathology measures show high agreement with expert visual ratings of pathology and discriminate well between pathology stages. In 140 cases with antemortem MR imaging, we compare the association of semi-quantitative and quantitative postmortem measures of these pathologies in the hippocampus with in vivo structural measures of the MTL and its subregions. We find widespread associations of p-tau pathology with MTL subregional structural measures, whereas pTDP-43 pathology had more limited associations with the hippocampus and entorhinal cortex. Quantitative measurements of p-tau pathology resulted in a significantly better model of antemortem structural measures than semi-quantitative ratings and showed strong associations with cortical thickness and volume. By providing a more granular measure of pathology, the quantitative p-tau measures also showed a significant negative association with structure in a severe AD subgroup where semi-quantitative ratings displayed a ceiling effect. Our findings demonstrate the advantages of using quantitative neuropathology to understand the relationship of pathology to structure, particularly for p-tau, and motivate the use of quantitative pathology measurements in future studies.

Keywords: Alzheimer’s disease; Quantitative neuropathology; TDP-43; Tau.


Conflict of interest statement

D.A.W has served as a paid consultant to Eli Lilly, GE Healthcare, and Qynapse. He serves on a DSMB for Functional Neuromodulation and GSK. He is a site investigator for a clinical trial sponsored by Biogen. D.J.I. is member of science advisory board of Denali Therapeutics. S.R.D. received consultation fees from Rancho Biosciences and Nia Therapeutics. The other authors have nothing to disclose.

Figures

Fig. 1
Fig. 1
WildCat pipeline and sample activation maps. a Pipeline for WildCat classification of p-tau inclusions. The pipeline is the same for the WildCat trained for pTDP-43 inclusions, replacing tangles and threads with neuronal/glial and neuritic pTDP-43. b Sample patch level activations for classification of p-tau inclusions. Shown are example patches and heatmaps showing the activation for each class (tangles, threads, other, and background). c Sample patch level activations for classification of pTDP-43 inclusions. Shown are example patches and heatmaps showing the activation for each class (neuronal/glial pTDP-43, neuritic pTDP-43, non-specific staining, and background). Green areas in (b) and (c) correspond to areas of higher activation
Fig. 2
Fig. 2
Examples of annotated hippocampus histology sections and corresponding WildCat activation maps. a A p-tau-stained section (left) and a pTDP-43-stained section (right) with sampling regions of interest annotated. The p-tau section is from a case with high ADNC; the pTDP-43 section is from a case with LATE-NC stage 2. The colors of each label are given to the right. b Shown is the EC-lat (lateral area of entorhinal cortex) region of interest labeled from the same section, the WildCat activation heat map for tangles and threads (p-tau) or neuronal/glial and neuritic pTDP-43, and the same ROI broken into approximately equal size contiguous segments from which the average activation measure is taken. These segments are obtained using the METIS graph partitioning algorithm [51]. Yellow and green areas indicate areas of higher activation. CA cornu ammonis, CA1-SUB cornu ammonis 1/subiculum, DG-H hilus of the dentate gyrus, DG-GCL granular cell layer of the dentate gyrus, SUB-PrS subiculum/presubiculum, EC-med medial portion of the entorhinal cortex visible on the section, EC-ctr central portion of entorhinal cortex visible on the section, EC-lat lateral portion of entorhinal cortex visible on the section, BA Brodmann area
Fig. 3
Fig. 3
Validation of single sampling region pathology measures with expert ratings. Quantitative pathology measures in individual sampling regions were grouped by the ordinal semi-quantitative rating assigned by a visual read of the same sampling region by an expert (S.A. for p-tau, J.R. for pTDP-43). Each panel represents a different pathology type: tangles (a), threads (b), neuronal/glial pTDP-43 (c), and neuritic pTDP-43 (d). The same set of sampling regions were evaluated for tangles and threads, and similarly for the pTDP-43 measures. One-sided AUC and Mann–Whitney U-tests are shown between adjacent ratings (*p < 0.05, **p < 0.01, ***p < 0.001). CA cornu ammonis, CA1-SUB cornu ammonis 1/subiculum, SUB/PrS subiculum/presubiculum, DG-H hilus of the dentate gyrus, DG-GCL granular cell layer of the dentate gyrus, EC-lat lateral portion of entorhinal cortex visible on the section, EC-ctr central portion of entorhinal cortex visible on the section, EC-med medial portion of the entorhinal cortex visible on the section, BA Brodmann area
Fig. 4
Fig. 4
Pathology measures compared to staging systems. a Quantitative summary measures and semi-quantitative ratings of p-tau pathology plotted across Braak stages for all patients with quantitative tau summary measurements (N = 196). b Quantitative summary measures and semi-quantitative ratings of pTDP-43 pathology plotted across LATE-NC stages for all cases with quantitative pTDP-43 summary measurements (N = 190). One-sided AUC and Mann–Whitney U-tests are shown between adjacent Braak and LATE-NC stages for each plot (*p < 0.05, **p < 0.01, ***p < 0.001). Tangles (Q) quantitative tangles summary measurement, Threads (Q) quantitative threads summary measurement, MTL p-Tau (SQ) semi-quantitative MTL p-tau rating, Neuronal/Glial pTDP-43 (Q) quantitative neuronal/glial pTDP-43 summary measurement, Neuritic pTDP-43 (Q) quantitative neuritic pTDP-43 summary measurement, MTL pTDP-43 (SQ) semi-quantitative MTL pTDP-43 rating
Fig. 5
Fig. 5
Scatterplots of summary pathology measures and semi-quantitative ratings of the same pathology in the MTL. a Scatterplots of the quantitative tangle and threads summary measures plotted against the semi-quantitative MTL p-tau rating (N = 196). b Scatterplots of the quantitative neuronal/glial and neuritic pTDP-43 summary measures plotted against the semi-quantitative MTL pTDP-43 rating (N = 190). Spearman correlations between each summary measure and its corresponding semi-quantitative rating are shown in the top left of each plot. Tangles (Q) quantitative tangles summary measurement, Threads (Q) quantitative threads summary measurement, Neuronal/Glial pTDP-43 (Q) quantitative neuronal/glial pTDP-43 summary measurement, Neuritic pTDP-43 (Q) quantitative neuritic pTDP-43 summary measurement
Fig. 6
Fig. 6
Scatterplots of tau and TDP-43 pathology measures compared to ipsilateral cortical thickness and volume measurements. The sample includes all cases with both quantitative p-tau and pTDP-43 summary pathology measures available and ipsilateral cortical thickness and volume data (N = 126). Cases with LATE-NC stages 1–3 (N = 24) are colored in red. Cases with Braak stages of V/VI (N = 75) are represented by a cross. A regression line without any covariates is also included in each plot. AH (vol) anterior hippocampus volume (mm3), PH (vol) posterior hippocampus volume (mm3), ERC (thk) entorhinal cortex median thickness (mm), BA35 (thk) Brodmann area 35 median thickness (mm), BA36 (thk) Brodmann area 36 median thickness (mm), PHC (thk) parahippocampal cortex median thickness (mm), Tangles (Q) quantitative tangles summary measurement, Threads (Q) quantitative threads summary measurement, MTL p-Tau (SQ) semi-quantitative MTL p-tau rating, Neuronal/Glial pTDP-43 (Q) quantitative neuronal/glial pTDP-43 summary measurement, Neuritic pTDP-43 (Q) quantitative neuritic pTDP-43 summary measurement, MTL pTDP-43 (SQ) semi-quantitative MTL pTDP-43 rating
Fig. 7
Fig. 7
Maps showing the association between pointwise cortical thickness and the tangles summary measure, threads summary measure, and the MTL pTDP-43 semi-quantitative rating. Each row represents a different cohort; top: the whole cohort (N = 140), middle: the subset of patients with LATE-NC stages 1–3 (N = 31), and bottom: the subset of patients with Braak staging of V/VI (N = 85). Each model is covaried for age, antemortem interval, MRI field strength, and sex. The clusters outlined in black indicate regions where a significant association was found (p < 0.05), and the p-values are indicated with a line. The white lines represent the borders between subfields. To the right, a 3-D representation of the MTL with the subregions labeled is shown; the white matter sections were not analyzed. Warm colors indicate areas with more negative t-statistics. AH anterior hippocampus, PH posterior hippocampus, ERC entorhinal cortex, BA35 Brodmann area 35, BA36 Brodmann area 36, PHC parahippocampal cortex, WM white matter

References

    1. Barnes J, Ridgway GR, Bartlett J, Henley SMD, Lehmann M, Hobbs N et al (2010) Head size, age and gender adjustment in MRI studies: a necessary nuisance? NeuroImage 53:1244–1255. 10.1016/j.neuroimage.2010.06.025 10.1016/j.neuroimage.2010.06.025 - DOI - PubMed
    1. Bejanin A, Murray ME, Martin P, Botha H, Tosakulwong N, Schwarz CG et al (2019) Antemortem volume loss mirrors TDP-43 staging in older adults with non-frontotemporal lobar degeneration. Brain J Neurol 142:3621–3635. 10.1093/brain/awz277 10.1093/brain/awz277 - DOI - PMC - PubMed
    1. Berron D, Vogel JW, Insel PS, Pereira JB, Xie L, Wisse LEM et al (2021) Early stages of tau pathology and its associations with functional connectivity, atrophy and memory. Brain 144:2771–2783. 10.1093/brain/awab114 10.1093/brain/awab114 - DOI - PMC - PubMed
    1. Botha H, Mantyh WG, Murray ME, Knopman DS, Przybelski SA, Wiste HJ et al (2018) FDG-PET in tau-negative amnestic dementia resembles that of autopsy-proven hippocampal sclerosis. Brain 141:1201–1217. 10.1093/brain/awy049 10.1093/brain/awy049 - DOI - PMC - PubMed
    1. Braak H, Braak E (1991) Neuropathological stageing of Alzheimer-related changes. Acta Neuropathol (Berl) 82:239–259. 10.1007/BF00308809 10.1007/BF00308809 - DOI - PubMed

Publication types

LinkOut - more resources