. 2024 Oct;25(10):1913-1927.
doi: 10.1038/s41590-024-01951-5. Epub 2024 Sep 3.

Mucosal adenovirus vaccine boosting elicits IgA and durably prevents XBB.1.16 infection in nonhuman primates

Affiliations

Mucosal adenovirus vaccine boosting elicits IgA and durably prevents XBB.1.16 infection in nonhuman primates

Matthew Gagne et al. Nat Immunol. 2024 Oct.

Abstract

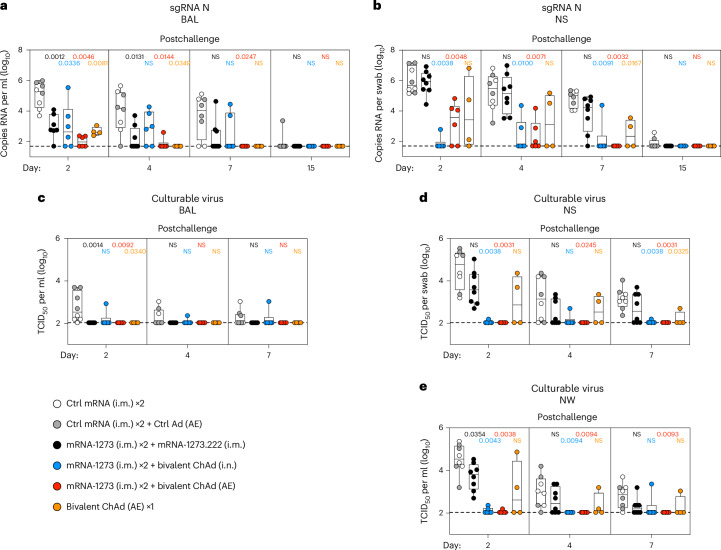
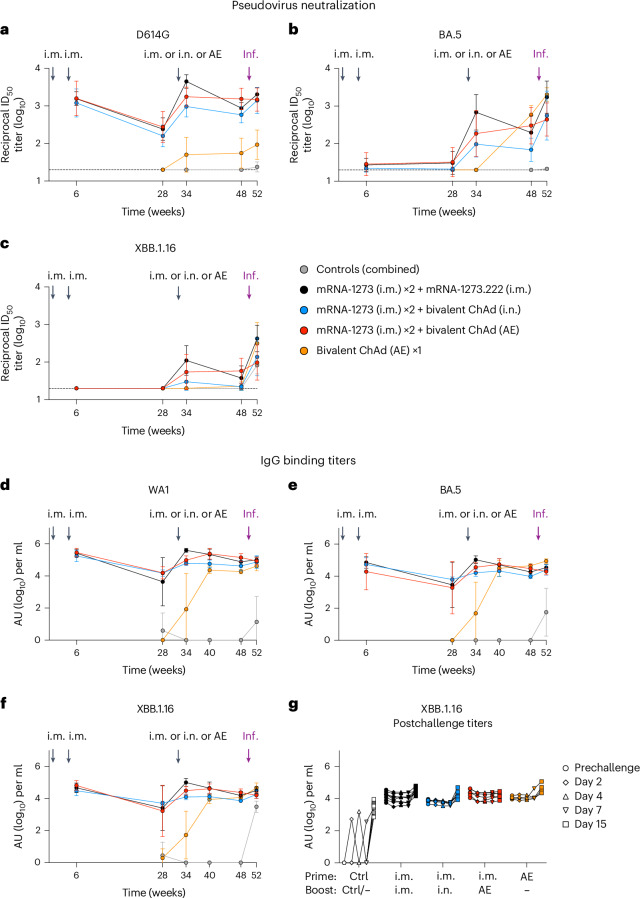
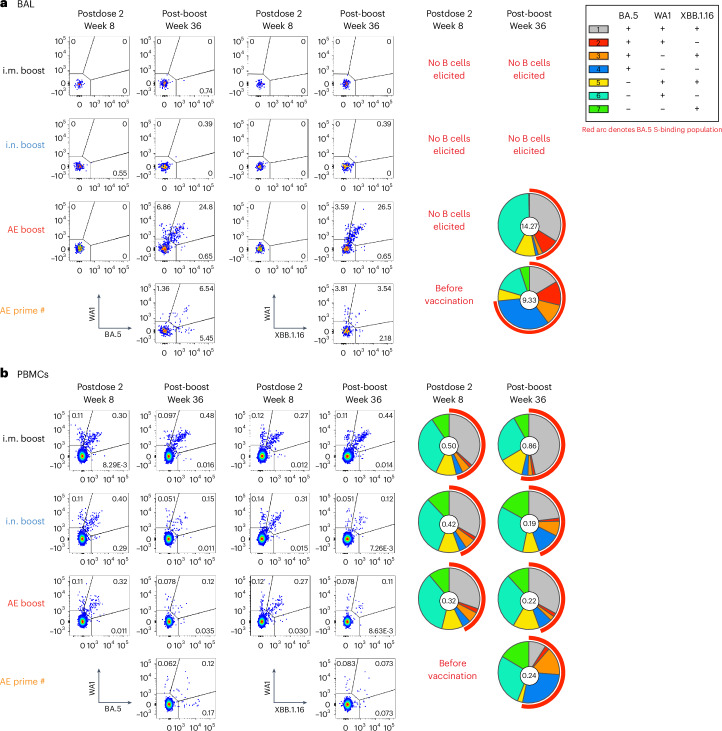
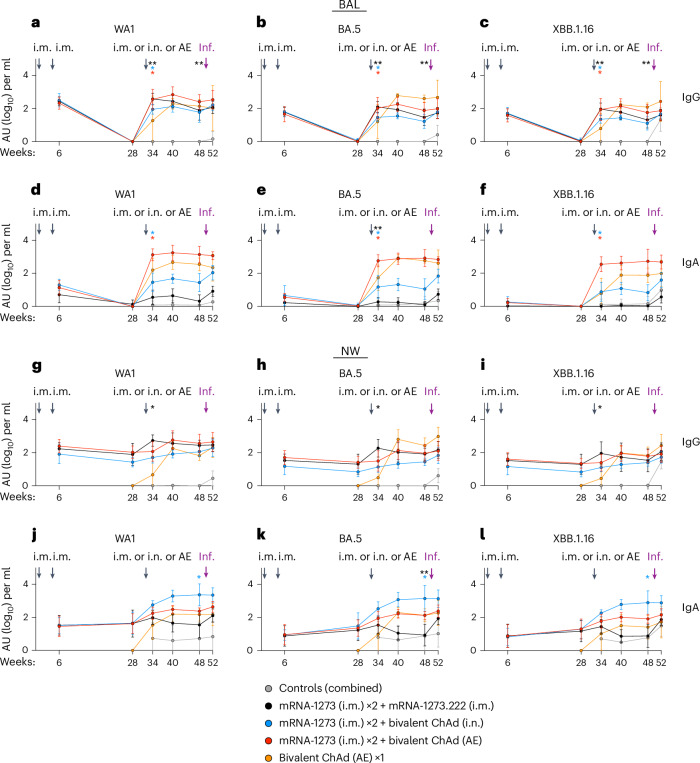
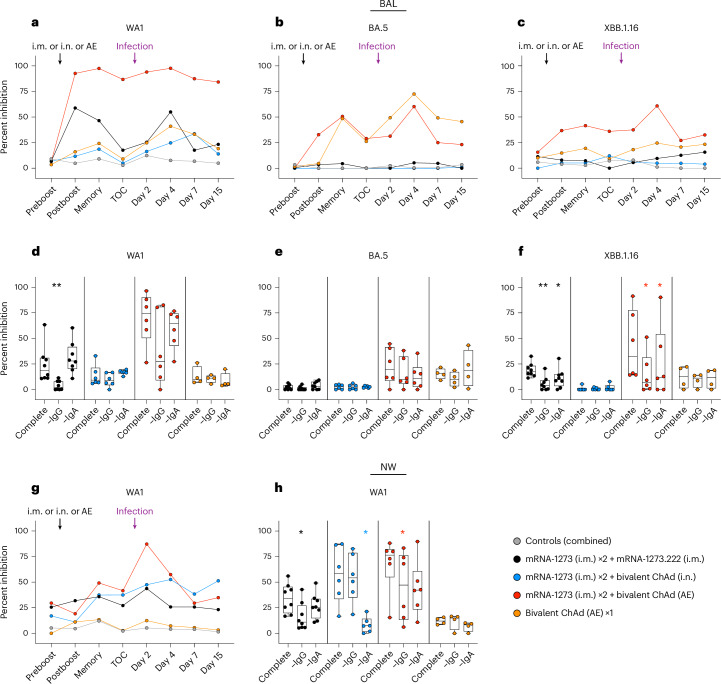
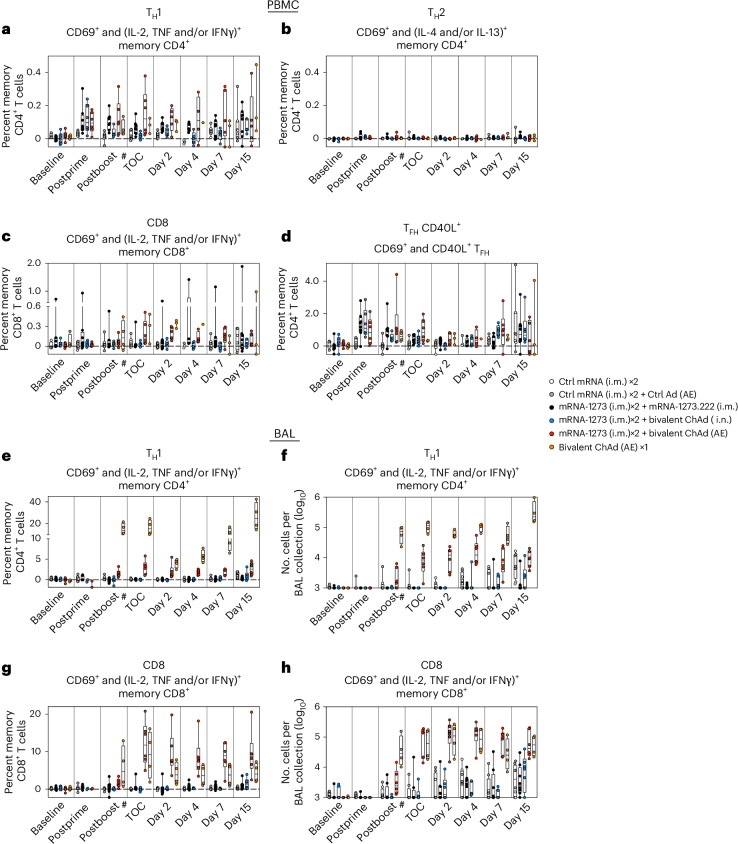
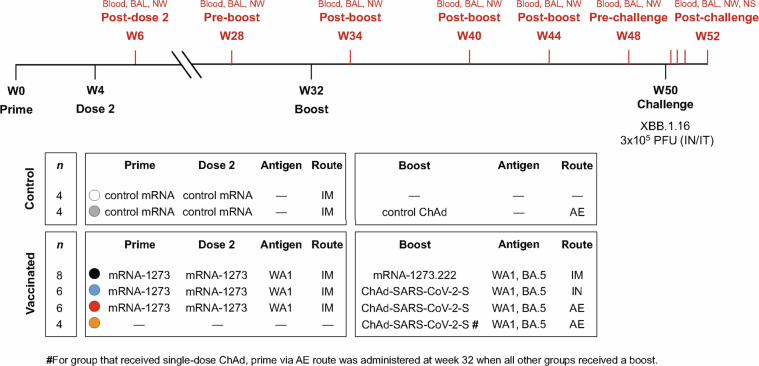
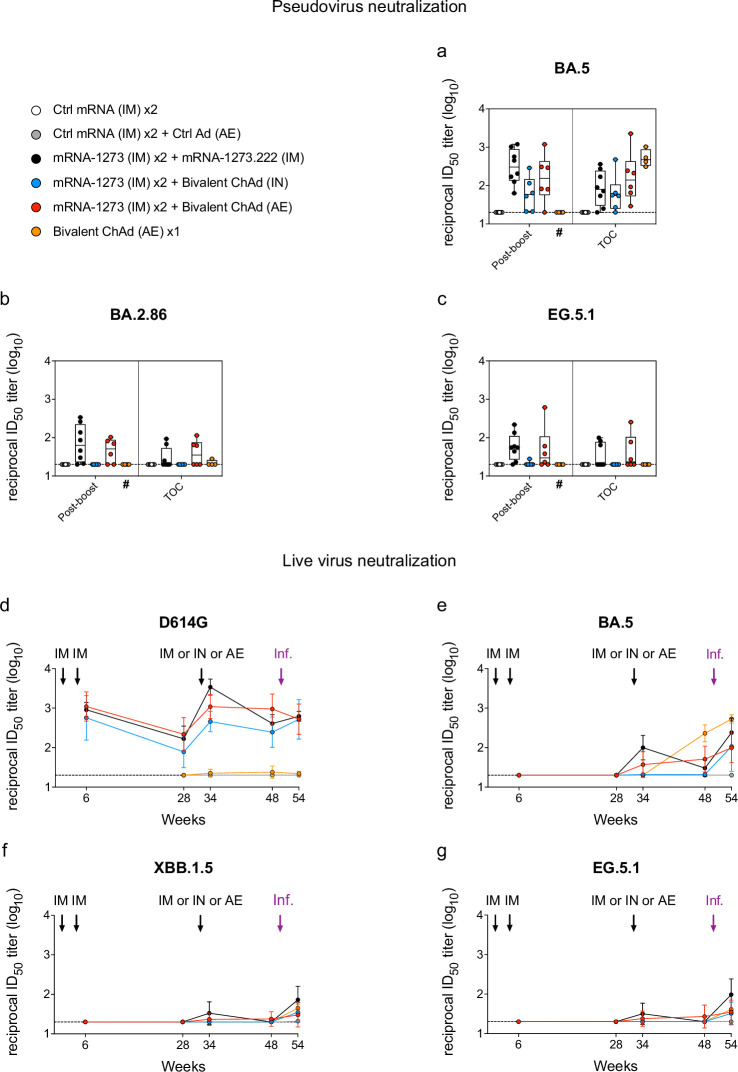
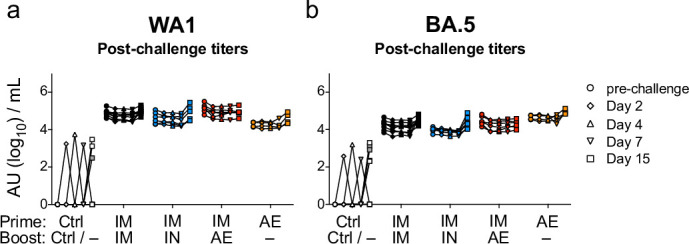
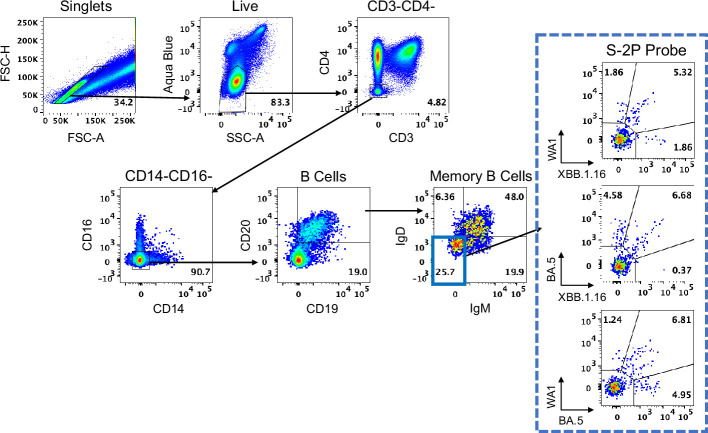
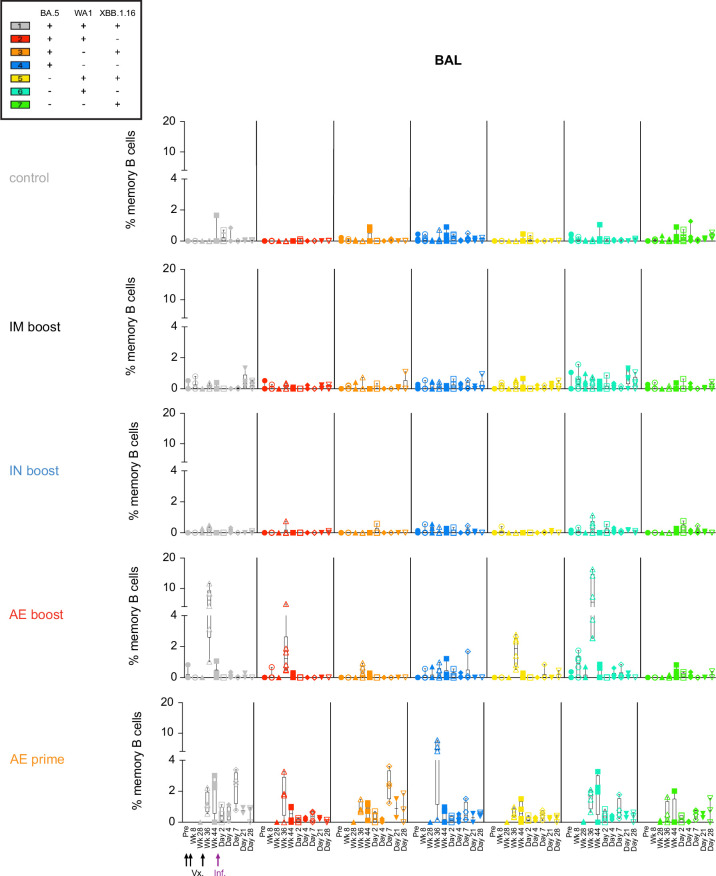
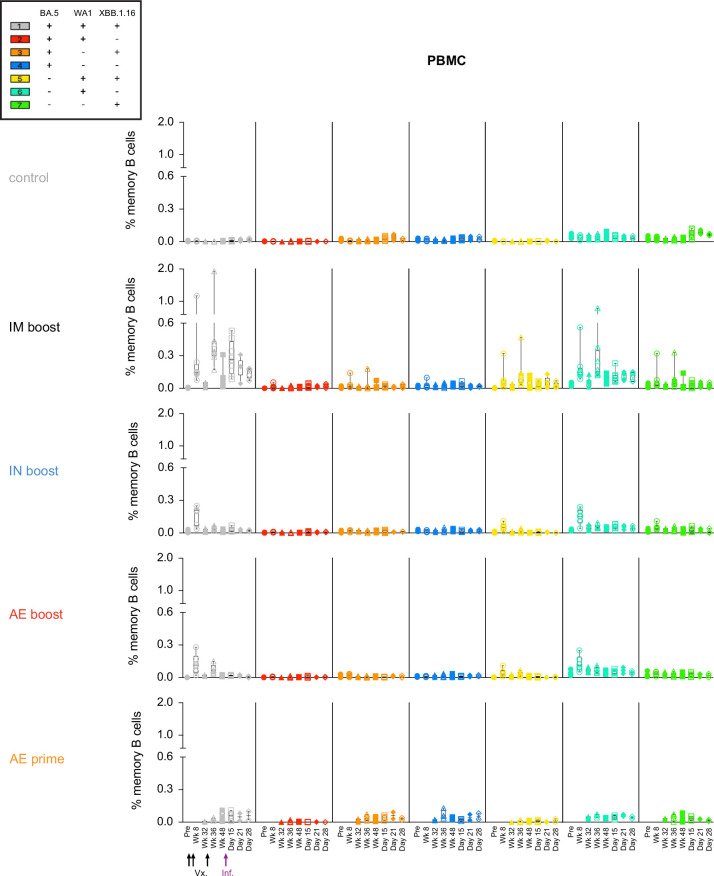
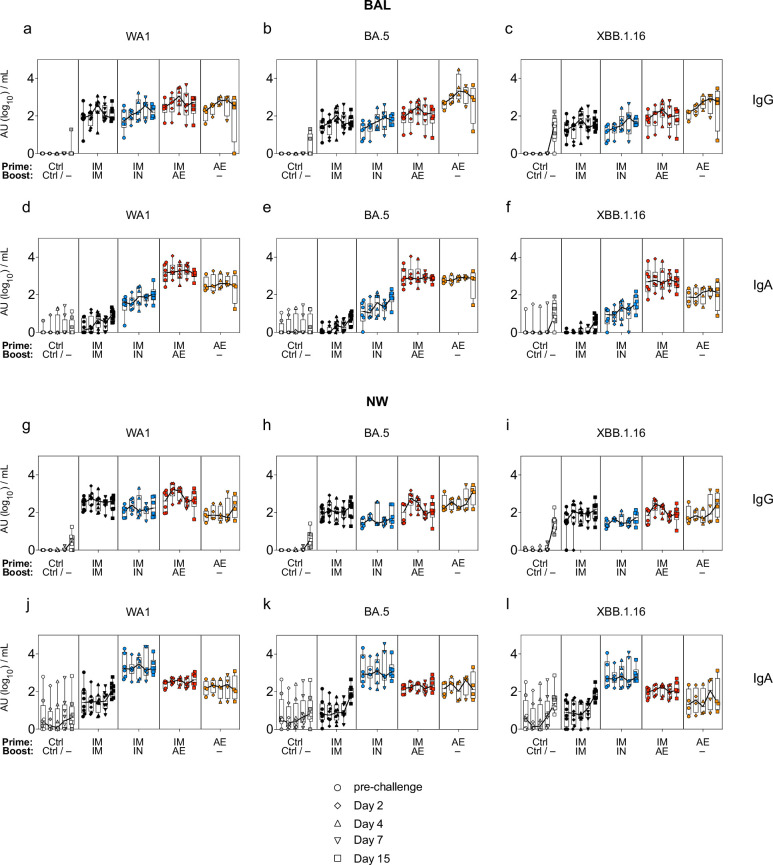
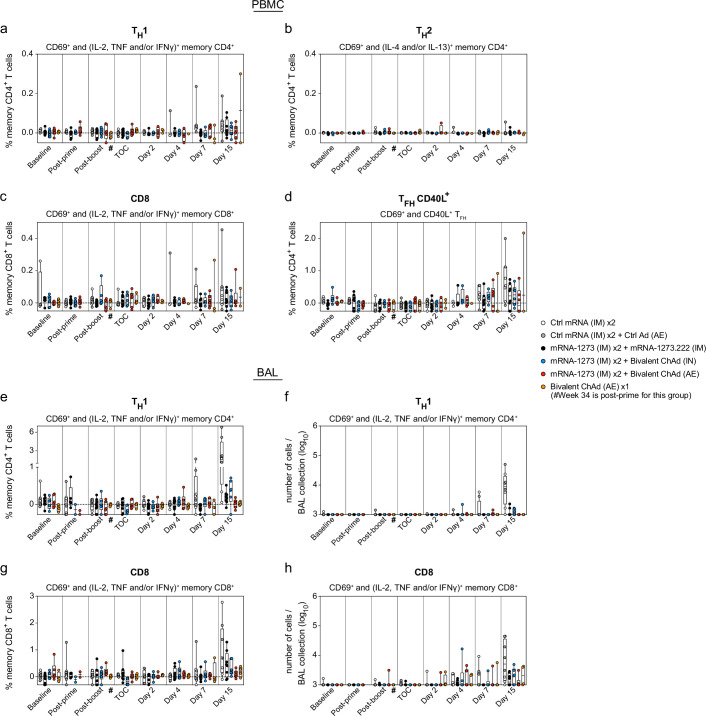
A mucosal route of vaccination could prevent severe acute respiratory syndrome coronavirus 2 (SARS-CoV-2) replication at the site of infection and limit transmission. We compared protection against heterologous XBB.1.16 challenge in nonhuman primates (NHPs) ~5 months following intramuscular boosting with bivalent mRNA encoding WA1 and BA.5 spike proteins or mucosal boosting with a WA1-BA.5 bivalent chimpanzee adenoviral-vectored vaccine delivered by intranasal or aerosol device. NHPs boosted by either mucosal route had minimal virus replication in the nose and lungs, respectively. By contrast, protection by intramuscular mRNA was limited to the lower airways. The mucosally delivered vaccine elicited durable airway IgG and IgA responses and, unlike the intramuscular mRNA vaccine, induced spike-specific B cells in the lungs. IgG, IgA and T cell responses correlated with protection in the lungs, whereas mucosal IgA alone correlated with upper airway protection. This study highlights differential mucosal and serum correlates of protection and how mucosal vaccines can durably prevent infection against SARS-CoV-2.


Conflict of interest statement

M.S.D. is a consultant for Inbios, Vir Biotechnology, Ocugen, Topspin Therapeutics, Merck, GSK and Moderna. The laboratory of M.S.D. has received unrelated funding support in sponsored research agreements from Vir Biotechnology, Emergent BioSolutions and Moderna. D.T.C. is a consultant for Ocugen, Circero, Asgard, Accession and Tome Biosciences. M.S.D., D.T.C. and I.P.D. are inventors of the ChAd-SARS-CoV-2 technology, which Washington University has licensed to Bharat Biotech and Ocugen for commercial development. M.S.S. serves on the scientific board of advisors for Moderna and Ocugen. A.R.H., P.D.K., M.R. and D.C.D. are inventors on US Patent Application 63/147,419 entitled ‘Antibodies targeting the spike protein of coronaviruses’. L.P., A.D., K.K., S.Z., A.V.R., M.G.L. and H.A. are employees of Bioqual. The other authors declare no competing interests.

Figures

Fig. 1
Fig. 1. Mucosal adenoviral-vectored vaccine protects against XBB.1.16 replication.
NHPs were administered mRNA-1273 or control mRNA at weeks 0 and 4 and were boosted at week 32 with the indicated vaccines. ae, Virus replication was measured by detection of sgRNA encoding N (sgRNA N; a and b), and culturable virus was assessed by TCID50 assay (c–e) in lower (a and c) and upper (b, d and e) airways at days 2, 4, 7 and 15 (for sgRNA only). Circles, boxes and horizontal solid lines represent individual animals, interquartile range and median, respectively, whereas minima and maxima are denoted at whisker termini. Assay LOD is represented as a dotted line. Wilcoxon rank-sum tests were conducted for each vaccinated group comparing to pooled controls at the indicated time points. Pairwise two-sided P values are shown. NS indicates that comparisons were not significant (P > 0.05). Additional details on the statistical analysis are listed in Methods. Immunizations include control mRNA (ctrl mRNA) via the i.m. route, control adenovirus vector (ctrl Ad) via the AE route, mRNA-1273 via the i.m. route, mRNA-1273.222 via the i.m. route and bivalent ChAd-SARS-CoV-2-S via the AE or i.n. route. The numbers of NHPs per group are as follows: control, n = 8; i.m. boost, n = 8 (except for day 2 in a, for which n = 7); i.n. boost, n = 6; AE boost, n = 6; AE prime, n = 4.
Fig. 2
Fig. 2. Mucosal adenoviral-vectored vaccine elicits durable systemic humoral responses.
NHPs were administered mRNA-1273 or control mRNA at weeks 0 and 4 and were boosted at week 32 with the indicated vaccine. ag, Sera were collected postprime (week 6), preboost (week 28), postboost (weeks 34 and 40), prechallenge (week 48) and postchallenge (days 2, 4, 7 and 15). Time of infection (Inf.) is noted by purple arrows. ac, Pseudovirus neutralizing responses measured against D614G (a), BA.5 (b) and XBB.1.16 (c). Circles indicate geometric means for each group. Error bars represent geometric standard deviation. The assay LOD is represented as a dotted line. df, Serum IgG binding titers to WA1 (d), BA.5 (e) and XBB.1.16 S (f) at the indicated times. Circles indicate geometric means for each group. Error bars represent geometric standard deviation and may extend beyond the range of the graph. g, Postchallenge binding titers to XBB.1.16 S for individual NHPs. Prechallenge samples were collected at week 48. In g, lines connect binding titers across time points, while symbols denote AU per ml of individual NHPs. An AU below a value of 1 was replaced with a value of 1 for the data shown in dg. Postchallenge fold increases in serum anti-XBB.1.16 IgG binding titers are described in Supplementary Table 1. Immunizations include control mRNA (ctrl mRNA) via the i.m. route, control adenovirus vector (ctrl Ad) via the AE route, mRNA-1273 via the i.m. route, mRNA-1273.222 via the i.m. route and bivalent ChAd-SARS-CoV-2-S via the AE or i.n. route. The number of NHPs per group are as follows: control, n = 8; i.m. boost, n = 8; i.n. boost, n = 6; AE boost, n = 6; AE prime, n = 4; IC50, reciprocal median infectious dose.
Fig. 3
Fig. 3. SARS-CoV-2 S-specific memory B cells elicited by vaccination.
BAL (a) and peripheral blood mononuclear cells (PBMCs; b) were collected 4 weeks following the second dose of the primary regimen (week 8) or following a boost (week 36) and were stained with fluorescently labeled WA1, BA.5 and XBB.1.16 S-2P probes. Representative flow cytometry dot plots are shown for memory B cell binding to WA1 and BA.5 probe pairs (first set of columns) and WA1 and XBB.1.16 probe pairs (second set of columns). The pie charts in the last set of columns indicate the proportion of S-binding memory B cells with specificities for various combinations of variants as determined using Boolean gating. The number shown in the center of the pie chart represents the geometric mean frequency of the entire S-binding memory B cell population for all NHPs within the indicated group at the indicated time point. The numbers of NHPs per group are as follows: control, n = 8; i.m. boost, n = 8; i.n. boost, n = 6; AE boost n = 6; AE prime, n = 4. Pie charts are only provided for groups with S-specific memory B cell frequencies that were clearly distinguished from background staining. Complete longitudinal analysis is shown for all groups in Extended Data Figs. 6 and 7. The number symbol (#) indicates that while sample collection for the AE prime cohort occurred on week 36, week 36 was 4 weeks following the single AE prime rather than 4 weeks following a boost, as in other groups. Complete statistical analyses for comparisons of S-specific memory B cell frequencies are shown in Supplementary Table 2.
Fig. 4
Fig. 4. Mucosal IgG and IgA responses following vaccination.
al, NHPs were administered mRNA-1273 or control mRNA at weeks 0 and 4 and were boosted at week 32 with the indicated vaccine. BAL (af) and NWs (gl) were collected postprime (week 6), preboost (week 28), postboost (weeks 34 and 40), prechallenge (week 48) and 2 weeks postchallenge (week 52). Time of infection (Inf.) is noted by purple arrows. IgG (ac and gi) and IgA (df and jl) binding titers were measured to WA1, BA.5 and XBB.1.16 S as indicated. Circles indicate geometric means for each group. Error bars represent geometric standard deviation and may extend beyond the range of the graph. AU values below 1 were replaced with a value of 1. Wilcoxon signed-rank tests were conducted for anti-S titers at week 34 (postboost) versus week 28 (preboost) and also for week 48 (prechallenge) versus week 34 (postboost) for each vaccinated group. Additional details on statistical analyses and corresponding fold changes in geometric mean serum neutralizing antibody titer are available in Supplementary Table 3. Asterisks (*) indicate pairwise two-sided P values (*P < 0.05 and **P < 0.01). All other comparisons were not significant (P > 0.05). Immunizations included control mRNA (ctrl mRNA) via the i.m. route, control adenovirus vector (ctrl Ad) via the AE route, mRNA-1273 via the i.m. route, mRNA-1273.222 via the i.m. route and bivalent ChAd-SARS-CoV-2-S via the AE or i.n. route. The numbers of NHPs per group are as follows: control, n = 8; i.m. boost, n = 8; i.n. boost, n = 6; AE boost, n = 6; AE prime, n = 4.
Fig. 5
Fig. 5. Functional IgG and IgA responses in the upper and lower airways following vaccination.
ah, NHPs were administered mRNA-1273 or control mRNA at weeks 0 and 4 and were boosted at week 32 with the indicated vaccine. BAL (ac) and NWs (g) were collected preboost (week 28), postboost (week 34), at a memory time point (week 40) and at time of challenge (TOC; week 48) and postchallenge (days 2, 4, 7 and 15). WA1 (a and g), BA.5 (b) and XBB.1.16 (c) S binding to ACE2 was measured with and without the addition of mucosal fluids to determine percent inhibition as a surrogate for neutralizing antibodies. Symbols in ac and g indicate median percent inhibition of each group. Mucosal fluids at a late memory time point prechallenge (week 44) from BAL (df) or NWs (h) were used to inhibit WA1 (d and h), BA.5 (e) or XBB.1.16 (f) S binding to ACE2 as complete fluid or after the selective depletion of either IgG or IgA. Symbols in df and h represent individual NHPs. Boxes and horizontal lines represent interquartile range and median, respectively, while minima and maxima are denoted at whisker termini. Wilcoxon signed-rank tests were conducted for ACE2–S binding inhibition at week 44 with complete or depleted mucosal fluids. Asterisks (*) indicate pairwise two-sided P values (*P < 0.05 and **P < 0.01). All other comparisons were not significant (P > 0.05). Additional details on statistical analyses and corresponding fold changes in median percent inhibition are provided in Supplementary Table 4. Immunizations include control mRNA (ctrl mRNA) via the i.m. route, control adenovirus vector (ctrl Ad) via the AE route, mRNA-1273 via the i.m. route, mRNA-1273.222 via the i.m. route and bivalent ChAd-SARS-CoV-2-S via the AE or i.n. route. The numbers of NHPs per group are as follows: control, n = 8; i.m. boost, n = 8; i.n. boost, n = 6; AE boost, n = 6; AE prime, n = 4.
Fig. 6
Fig. 6. AE immunization elicits durable CD4+ and CD8+ T cell responses in BAL.
ah, PBMCs (ad) and BAL fluid (eh) were collected before vaccination (baseline) and at weeks 6 (postprime), 34 (postboost) and 48 (time of challenge) as well as on days 2, 4, 7 and 15 postchallenge. Lymphocytes were stimulated with SARS-CoV-2 S1 and S2 peptide pools (WA1) and were then measured by intracellular staining. a,b,e, Percentage of memory CD4+ T cells with TH1 markers (IL-2, TNF or IFNγ; a and e) or type 2 helper T (TH2) cell markers (IL-4 or IL-13; b) following stimulation. c,g, Percentage of memory CD8+ T cells expressing IL-2, TNF or IFNγ following stimulation. d, Percentage of TFH cells that express CD40L following stimulation. Breaks in the y axis indicate a change in scale without a break in the range depicted. Dotted lines are set at 0%. Fold changes in S-specific T cell frequencies are provided in Supplementary Table 5. f,h, Absolute numbers of S-reactive TH1 CD4+ (f) or CD8+ T cells (h) in the BAL. Counts below a value of 1 (due to background subtraction) were replaced with a value of 1 for data in f and h. Circles, boxes and horizontal lines in ah represent individual animals, interquartile range and median, respectively, while minima and maxima are denoted at whisker termini. Reported values may be negative due to background subtraction and may extend below the range of the y axis. The number symbol (#) indicates that while sample collection for the AE prime cohort (orange) occurred on week 34, week 34 was 2 weeks following the single AE prime rather than 2 weeks following a boost, as in all other groups. Immunizations include control mRNA (ctrl mRNA) via the i.m. route, control adenovirus vector (ctrl Ad) via the AE route, mRNA-1273 via the i.m. route, mRNA-1273.222 via the i.m. route and bivalent ChAd-SARS-CoV-2-S via the AE or i.n. route. The numbers of NHPs per group are as follows: control, n = 8; i.m. boost, n = 8; i.n. boost, n = 6; AE boost, n = 6; AE prime, n = 4. Due to prespecified minimum cell numbers per sample required for analysis, some time points include data from fewer NHPs than the full group size.
Extended Data Fig. 1
Extended Data Fig. 1. Experimental scheme.
NHP (n = 8 for control groups and n = 24 for vaccine groups) were administered 30 μg of mRNA vaccine via IM route or 1 × 10¹¹ virus particles of adenoviral-vectored vaccine via IN or AE route according to immunization schedule shown above. Eighteen weeks after boosting, all primates were challenged with XBB.1.16. Sampling schedule indicated in red.
Extended Data Fig. 2
Extended Data Fig. 2. XBB.1.16 sequence.
Challenge virus was titered and sequenced to verify presence of canonical XBB.1.16 amino acid substitutions in comparison to ancestral Wuhan-1 strain. Substitutions shown for (a) S and (b) whole genome. NTD: N-terminal domain. RBD: receptor binding domain. RBM: receptor binding motif. FP: fusion peptide. HR1: heptad repeat 1. HR2: heptad repeat 2. FCS: furin cleavage site. S2′: S2′ site. *: premature stop codon in Orf8 (common to XBB descendant strains).
Extended Data Fig. 3
Extended Data Fig. 3. AE or IM boosting elicits durable serum neutralizing responses against emerging SARS-CoV-2 variants.
NHP were administered mRNA-1273 or control mRNA at weeks 0 and 4 and boosted at week 32 with the indicated vaccine. (a-c) Sera were collected post-boost (week 34) and at the time of challenge (TOC, week 48). Pseudovirus neutralizing responses measured against (a) BA.5, (b) BA.2.86 and (c) EG.5.1. Circles, boxes and horizontal lines represent individual animals, interquartile range and median, respectively, while minima and maxima are denoted at whisker termini. # indicates that while sample collection for AE prime cohort (orange) occurred on week 34, week 34 was two weeks following the single AE prime rather than two weeks following a boost as in other groups. Number of NHP per group (n) are as follows: control = 8; IM boost = 8; IN boost = 6; AE boost = 6; AE prime = 4. (d-g) Sera were collected post-prime (week 6), pre-boost (week 28), post-boost (week 34), pre-challenge (week 48) and post-challenge (day 28). Neutralizing responses measured against live virus (d) D614G, (e) BA.5, (f) XBB.1.5 and (g) EG.5.1. Circles indicate geometric means for each group. Error bars represent geometric standard deviation. Assay LOD in a-g represented as dotted line. Number of NHP per group are as follows with n listed for all pre-challenge timepoints followed by n at day 28 post-challenge in parentheses: control = 8 (4); IM boost = 8 (5); IN boost = 6 (3); AE boost = 6 (3); AE prime = 4 (2).
Extended Data Fig. 4
Extended Data Fig. 4. Post-challenge anamnestic responses in sera.
NHP were administered mRNA-1273 or control mRNA at weeks 0 and 4 and boosted at week 32 with the indicated vaccine. (a-b) Sera were collected pre-challenge (week 48) and post-challenge (days 2, 4, 7 and 15). (a) Anti-WA1 S and (b) anti-BA.5 S binding titers shown at indicated times. Lines connect binding titers across timepoints while symbols denote AU/mL of individual NHP. AU below a value of 1 were replaced with a value of 1. Number of NHP per group (n) are as follows: control = 8; IM boost = 8; IN boost = 6; AE boost = 6; AE prime = 4.
Extended Data Fig. 5
Extended Data Fig. 5. B cell gating strategy.
Representative flow cytometry plots showing gating strategy for memory B cells. Cells were gated as singlets and live cells based on forward and side scatter and a live/dead aqua blue stain. B cells were selected based on absence of CD3, CD4, CD14 and CD16 expression and on positive expression of CD20 and CD19. Memory B cells were selected based on lack of surface expression of IgD or IgM. Finally, pairs of variant S-2P probes were used to determine binding specificity.
Extended Data Fig. 6
Extended Data Fig. 6. Memory B cell specificity in BAL.
BAL was collected prior to vaccination (pre), post-prime (week 8), pre-boost (week 28), post-boost (weeks 36 and 44) and post-challenge (days 2, 4, 7, 21 and 28). Time of vaccinations and challenge indicated by arrows along bottom x-axis. Memory B cells were stained with fluorescently labeled WA1, BA.5 and XBB.1.16 S-2P probes. Symbols represent frequency of variant-specific memory B cells for individual NHP. Colors represent all potential variant-binding combinations as indicated in key at top left of figure. Boxes and horizontal lines represent interquartile range and median, respectively, while minima and maxima are denoted at whisker termini. Break in y-axis indicates a change in scale without a break in the range depicted. Number of NHP per group (n) varied based on the timepoint and are listed here, with the corresponding timepoints in parentheses. n for control group = 4 (day 21 and 28 post-challenge) and 8 (all preceding timepoints). n for IM boost = 7 (day 2 post-challenge), 4 (day 7 post-challenge), 5 (day 21 and 28 post-challenge) and 8 (all other timepoints). n for IN boost = 5 (day 2, 4 and 7 post-challenge), 3 (day 21 and 28 post-challenge) and 6 (all other timepoints). n for AE boost = 5 (day 2 post-challenge), 3 (day 21 post-challenge), 2 (day 28 post-challenge) and 6 (all other timepoints). n for AE prime = 2 (week 28 and day 21 post-challenge), 3 (day 28 post-challenge) and 4 (all other timepoints).
Extended Data Fig. 7
Extended Data Fig. 7. Circulating memory B cell specificity.
PBMC were collected prior to vaccination (pre), post-prime (week 8), pre-boost (week 32), post-boost (weeks 36 and 48) and post-challenge (days 15, 21 and 28). Time of vaccinations and challenge indicated by arrows along bottom x-axis. Memory B cells were stained with fluorescently labeled WA1, BA.5 and XBB.1.16 S-2P probes. Symbols represent frequency of variant-specific memory B cells for individual NHP. Colors represent all potential variant-binding combinations as indicated in key at top left of figure. Boxes and horizontal lines represent interquartile range and median, respectively, while minima and maxima are denoted at whisker termini. Break in y-axis indicates a change in scale without a break in the range depicted. Number of NHP per group are as follows with n first listed for pre-challenge and early post-challenge timepoints followed by n for days 21 and 28 post-challenge in parentheses: control = 8 (4); IM boost = 8 (5); IN boost = 6 (3); AE boost = 6 (3); AE prime = 4 (2).
Extended Data Fig. 8
Extended Data Fig. 8. XBB.1.16 challenge elicits rapid anamnestic antibody responses in the BAL of vaccinated NHP.
NHP were administered mRNA-1273 or control mRNA at weeks 0 and 4 and boosted at week 32 with the indicated vaccine. (a-f) BAL and (g-l) NW were collected pre-challenge (week 48) and on days 2, 4, 7 and 15 post-challenge. (a-c, g-i) IgG and (d-f, j-l) IgA binding titers measured to WA1, BA.5 or XBB.1.16 S as indicated. Symbols indicate individual NHP. Boxes and thin horizontal lines represent interquartile range and median, respectively, while minima and maxima are denoted at whisker termini. Thick solid lines connect median binding titers across timepoints. AU below a value of 1 were replaced with a value of 1. Number of NHP per group (n) are as follows: control = 8; IM boost = 8; IN boost = 6; AE boost = 6; AE prime = 4.
Extended Data Fig. 9
Extended Data Fig. 9. T cell gating strategy.
Representative flow cytometry plots showing gating strategy for ICS with (a) PBMC or (b) BAL lymphocytes following S or N peptide stimulation. Cells were gated as singlets and live cells on forward and side scatter and a live/dead aqua blue stain. CD3+ events were gated as CD4+ or CD8+ T cells. Total memory CD8+ T cells were selected based on expression of CCR7 and CD45RA. SARS-CoV-2-specific memory CD8+ T cells were gated according to co-expression of CD69 and IL-2, TNF or IFNγ. The CD4+ events were defined as naïve, total memory or central memory according to expression of CCR7 and CD45RA. CD4+ cells with a TH1 phenotype were defined as memory cells that co-expressed CD69 and IL-2, TNF or IFNγ. For PBMC only, CD4+ cells with a TH2 phenotype were defined as memory cells that co-expressed CD69 and IL-4 or IL-13, whereas TFH cells were defined as central memory CD4+ T cells that expressed CXCR5, ICOS and PD-1. TFH cells were further characterized as IL-21+, CD69+ or CD40L+, CD69+.
Extended Data Fig. 10
Extended Data Fig. 10. T cell responses to N peptides in PBMC and BAL following IM or mucosal boosting.
(a-d) PBMC and (e-h) BAL fluid were collected pre-vaccination (baseline) and at weeks 6 (post-prime), 34 (post-boost) and 48 (time of challenge, TOC) as well as on days 2, 4, 7 and 15 post-challenge. Lymphocytes were stimulated with SARS-CoV-2 N peptides (WA1) and then measured by intracellular staining. Percentage of memory CD4+ T cells with (a, e) TH1 markers (IL-2, TNF or IFNγ) or (b) TH2 markers (IL-4 or IL-13) following stimulation. (c, g) Percentage of memory CD8+ T cells expressing IL-2, TNF or IFNγ following stimulation. (d) Percentage of TFH cells that express CD40L following stimulation. Break in y-axis in e indicates a change in scale without a break in the range depicted. Dotted lines set at 0%. Absolute number of N-reactive (f) TH1 CD4+ or (h) CD8+ T cells in the BAL are also depicted. Counts below a value of 1 (due to background subtraction) were replaced with a value of 1 for data in f and h. Circles, boxes and horizontal lines in a-h represent individual animals, interquartile range and median, respectively, while minima and maxima are denoted at whisker termini. Reported values may be negative due to background subtraction and may extend below the range of the y-axis. # indicates that while sample collection for AE prime cohort (orange) occurred on week 34, week 34 was two weeks following the single AE prime rather than two weeks following a boost as in all other groups. Number of NHP per group (n) are as follows: control = 8; IM boost = 8; IN boost = 6; AE boost = 6; AE prime = 4. Due to pre-specified minimum cell numbers per sample required for analysis, some timepoints include data from fewer NHP than the full group size.

Update of

References

    1. Andrews, N. et al. Duration of protection against mild and severe disease by COVID-19 vaccines. N. Engl. J. Med.386, 340–350 (2022). - PMC - PubMed
    1. Tseng, H. F. et al. Effectiveness of mRNA-1273 vaccination against SARS-CoV-2 omicron subvariants BA.1, BA.2, BA.2.12.1, BA.4, and BA.5. Nat. Commun.14, 189 (2023). - PMC - PubMed
    1. Lin, D. Y. et al. Durability of bivalent boosters against omicron subvariants. N. Engl. J. Med.388, 1818–1820 (2023). - PMC - PubMed
    1. Bowe, B., Xie, Y. & Al-Aly, Z. Acute and postacute sequelae associated with SARS-CoV-2 reinfection. Nat. Med.28, 2398–2405 (2022). - PMC - PubMed
    1. Malahe, S. R. K. et al. Clinical characteristics and outcomes of immunocompromised patients with coronavirus disease 2019 caused by the Omicron variant: a prospective, observational study. Clin. Infect. Dis.76, e172–e178 (2023). - PMC - PubMed

MeSH terms