. 2024 Sep 3;15(9):643.
doi: 10.1038/s41419-024-07023-8.

Targeting POLRMT by IMT1 inhibits colorectal cancer cell growth

Affiliations

Targeting POLRMT by IMT1 inhibits colorectal cancer cell growth

Hao Wang et al. Cell Death Dis. .

Abstract

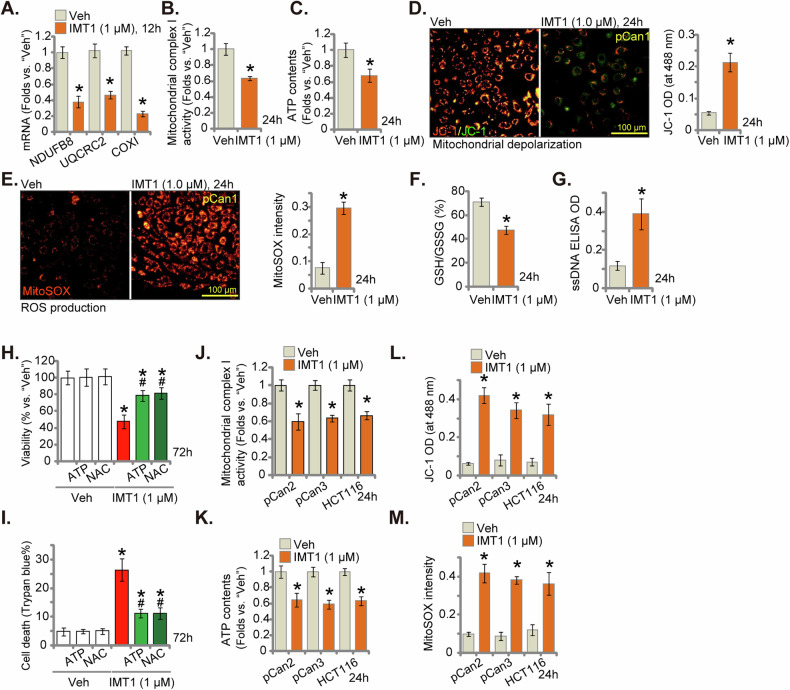
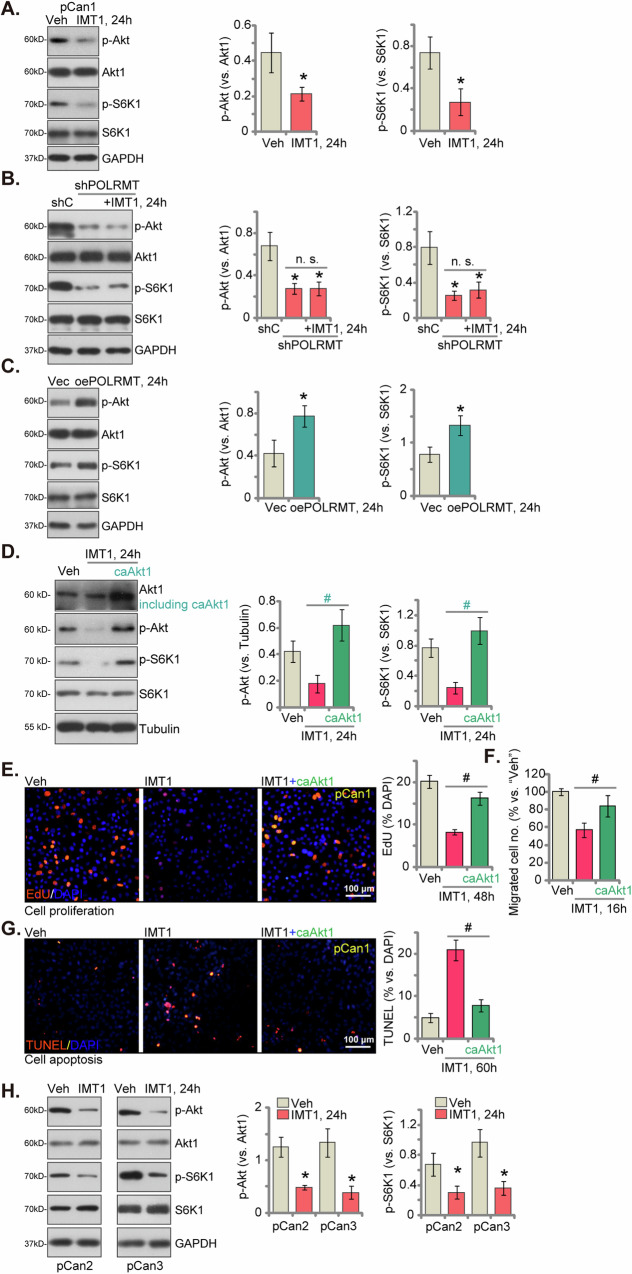
This study investigates the potential anti-colorectal cancer (CRC) activity of IMT1, a novel specific inhibitor of mitochondrial RNA polymerase (POLRMT). Single-cell RNA sequencing data reveal that POLRMT is overexpressed in CRC cells. Additionally, elevated POLRMT expression was observed in local CRC tissues and cells, while its expression remained relatively low in colon epithelial tissues and cells. IMT1 significantly inhibited colony formation, cell viability, proliferation, cell cycle progression, and migration in both primary and immortalized CRC cells. Furthermore, IMT1 induced apoptosis and cell death in CRC cells. The inhibition of POLRMT by IMT1 disrupted mitochondrial functions in CRC cells, leading to mitochondrial depolarization, oxidative damage, and decreased ATP levels. Using targeted shRNA to silence POLRMT closely mirrored the effects of IMT1, showing robust anti-CRC cell activity. Crucially, the efficacy of IMT1 was diminished in CRC cells with silenced POLRMT. Contrarily, boosting POLRMT expression externally by a lentiviral construct promoted the proliferation and migration of CRC cells. Importantly, treatment with IMT1 or silencing POLRMT in primary colon cancer cells decreased the phosphorylation of Akt1-S6K1, whereas overexpression of POLRMT had the opposite effect. In nude mice, orally administering IMT1 potently restrained primary colon cancer xenograft growth. IMT1 suppressed POLRMT activity, disrupted mitochondrial function, hindered Akt-mTOR activation, and prompted apoptosis within the xenograft tissues. In addition, IMT1 administration suppressed lung metastasis of primary colon cancer cells in nude mice. These combined results highlight the robust anti-CRC activity of IMT1 by specifically targeting POLRMT.


Conflict of interest statement

The authors declare no competing interests.

Figures

Fig. 1
Fig. 1. The scRNA-seq reveals POLRMT overexpression in CRC cells and cancer-associated endothelial cells.
Single-cell data analysis of CRC from the GSE132465 dataset, with cell annotations provided by the original authors (A, B). Dot plot illustrating the distribution of POLRMT in different cells of CRC and normal tissues, showing increased expression in the cancer group (C). The epithelial cell subgroup of CRC and normal tissues was extracted (D) and expression of POLRMT in different subgroups was shown (E, F). The stromal cell subgroup was also extracted from CRC and normal tissues (G) and expression of POLRMT in different subgroups was shown (H, I).
Fig. 2
Fig. 2. POLRMT overexpression in CRC tissues and cells.
POLRMT mRNA and protein levels were evaluated in colon cancer tissues (“T”) and corresponding adjacent normal colon tissues (“N”) obtained from a cohort of twenty primary colon cancer patients (AC). The expression of POLRMT mRNA and protein was assessed in listed primary human colon cancer cells (“pCan1”/”pCan2”) and primary human colon epithelial cells (“pEpi1”/”pEpi2”) (D, E). “pEpi1”/”pEpi2” cells were subjected to treatment with IMT1 (1 μM) for 72 h, followed by assessments of cell viability using CCK-8 (F) and determination of cell death through Trypan blue staining (G). The data were presented as mean ± standard deviation (SD, n = 5), with *indicating P < 0.05 compared to “N” tissues (A, C) or “pEpi1” (D, E). *Indicating P < 0.05 compared to “Veh” treatment (G) and “n. s.” non-statistical difference (P > 0.05) (F, G). The experiments were repeated five times, yielding consistent results.
Fig. 3
Fig. 3. IMT1 demonstrates substantial anti-CRC cell activity.
The primary human colon cancer cells, pCan1, underwent treatment with IMT1 at the specified concentrations. Cells were then cultivated for the designated duration, and the assessment included the examination of POLRMT mRNA (A) and protein (B) expression. Additionally, various parameters including cell viability (C), colony formation (D), cell death (measured by the ratio of Trypan blue-positive cells, E), and proliferation (evaluated through nuclear EdU incorporation, F) were tested. Cell cycle progression (PI-FACS assays, G) and in vitro cell migration (H) were evaluated using corresponding assays. Other primary colon cancer cells (“pCan-2/pCan-3”) or immortalized colon cancer cells (HCT116) were exposed to IMT1 (1 μM) for designated duration and assessments included POLRMT mRNA expression (I), cell viability (J), cell death (K), proliferation (L), and in vitro cell migration (M) were carried out using the similar protocols, with results quantified. “Veh” represents the vehicle control (0.1% DMSO). The data were presented as mean ± standard deviation (SD, n = 5), with *indicating P < 0.05 compared to “Veh” treatment (BH, JM) and “n. s.” denoting non-statistical difference (P > 0.05) (A, I). The experiments were repeated five times, yielding consistent results. The scale bar is set at 100 μm.
Fig. 4
Fig. 4. IMT1 induces apoptosis activation in CRC cells.
The primary human colon cancer cells, pCan1, underwent treatment with IMT1 (1 μM). Subsequently, they were cultivated for the designated duration, and the assessments including the Caspase-3 activity (A) and the Caspase-9 activity (B), expression of apoptosis-related proteins (C), and cytosol cytochrome C contents (ELISA assays, D) were performed. Cell apoptosis was tested through nuclear TUNEL staining assays (E). Preceding IMT1 (1 μM) treatment for the specified period, pCan1 cells underwent pretreatment with zDEVD-fmk (50 μM) or zVAD-fmk (50 μM) for 1 h. Subsequent assessments included the evaluation of apoptosis via nuclear TUNEL staining assays (F) and the determination of cell death through Trypan blue staining (G). Other primary colon cancer cells (“pCan-2/pCan-3”) or immortalized colon cancer cells (HCT116) were exposed to IMT1 (1 μM) for a designated duration and assessments included the Caspase-3 activity (H) and nuclear TUNEL staining (I). “Veh” represents the vehicle control (0.1% DMSO). The data were presented as mean ± standard deviation (SD, n = 5), with *indicating P < 0.05 compared to the “Veh” treatment (AI) and #indicating P < 0.05 compared to the IMT1 only treatment (F, G). The experiments were repeated five times, yielding consistent results. The scale bar is set at 100 μm.
Fig. 5
Fig. 5. IMT1 disrupts mitochondrial functions in CRC cells.
The primary human colon cancer cells, pCan1, underwent treatment with IMT1 (1 μM) for the specified period, and the mRNA expression of NDUFB8, COXI, and UQCRC2 was examined using qRT-PCR assays (A). Additionally, mitochondrial complex I activity (B) and cellular ATP levels (C) were tested. Mitochondrial depolarization was assessed through JC-1 fluorescence staining (D), while cellular ROS levels were determined using MitoSOX staining (E). Furthermore, GSH/GSSH contents were analyzed (F), and DNA damage was quantified through ssDNA ELISA (G). Preceding IMT1 (1 μM) treatment for the specified period, pCan1 cells underwent pretreatment with NAC (500 μM) or ATP (1 mM) for 0.5 h. Subsequent assessments included the examination of cell viability using CCK-8 (H) and the determination of cell death through Trypan blue staining (I). Other primary colon cancer cells (“pCan-2/pCan-3”) or immortalized colon cancer cells (HCT116) were exposed to IMT1 (1 μM) for designated duration, mitochondrial complex I activity (J), and cellular ATP levels (K) were quantified. Mitochondrial depolarization was assessed through JC-1 fluorescence staining (L), and cellular ROS levels were determined using MitoSOX fluorescence staining assay (M). “Veh” represents the vehicle control (0.1% DMSO). The data were presented as mean ± standard deviation (SD, n = 5), with *indicating P < 0.05 compared to “Veh” treatment (AM) and #indicating P < 0.05 compared to the IMT1 only treatment (H, I). The experiments were repeated five times, yielding consistent results. The scale bar is set at 100 μm.
Fig. 6
Fig. 6. POLRMT silencing exerts remarkable anti-cancer cell activity in CRC cells.
The primary colon cancer cells, pCan1, expressing the lentiviral POLRMT shRNA (“shPOLRMT”), were treated with IMT1 (1 μM) and further cultivated for designated time, the expression of POLRMT mRNA and protein was assessed (A, B); Cell proliferation, viability, migration and apoptosis were measured by nuclear EdU staining (C), CCK-8 (D), “Transwell” (E) and nuclear TUNEL staining (F) assays, respectively; The cellular ATP contents were quantified as well (G); mitochondrial depolarization was assessed through JC-1 fluorescence staining (H), with cellular ROS levels determined using MitoSOX fluorescence staining assay (I). “shC” stands for cells with scramble control shRNA. The data were presented as mean ± standard deviation (SD, n = 5), with *indicating P < 0.05 compared to “shC” treatment (AI) and “n. s.” denoting non-statistical difference (P > 0.05) (A-I). The experiments were repeated five times, yielding consistent results. The scale bar is set at 100 μm.
Fig. 7
Fig. 7. POLRMT overexpression exerts cancer-promoting activity in CRC cells.
The primary human colon cancer cells, “pCan-1/-2/-3,” and the immortalized cell line (HCT116) were engineered to express either the lentiviral POLRMT-overexpressing construct (“oePOLRMT”) or the vector (“Vec”). The expression of POLRMT mRNA and protein was assessed (A, B, and G). Following cultivation for specified durations, mitochondrial complex I activity (C) and cellular ATP levels (D, H) were quantified. Additionally, measurements were taken for nuclear EdU incorporation (E, I) and in vitro cell migration (F, J). “Pare” stands for parental control cells. The data were presented as mean ± standard deviation (SD, n = 5), with *indicating P < 0.05 compared to “Vec” cells (AJ). The experiments were repeated five times, yielding consistent results. The scale bar is set at 100 μm.
Fig. 8
Fig. 8. POLRMT inhibition by IMT1 suppresses Akt-mTOR activation in CRC cells.
Primary colon cancer cells (pCan1) were subjected to a 24 h treatment with IMT1 (1 μM) or vehicle control (“Veh”), and the protein composition in total cell lysates was analyzed (A). pCan1 cells expressing lentiviral POLRMT shRNA (“shPOLRMT”) were exposed to IMT1 (1 μM) and further cultured for 24 h. Additionally, control cells with scramble control shRNA (“shC”) were cultivated for the same duration. The listed protein in total cell lysates was assessed (B). pCan1 cells were modified to express either a lentiviral POLRMT-overexpressing construct (“oePOLRMT”) or a vector (“Vec”). These cells were cultured for 24 h, following which the listed protein in total cell lysates was analyzed (C). Stable pCan-1 cells containing the constitutively active S473D mutant Akt1 (caAkt1) were treated with IMT1 (1 μM) for specific periods, and control cells were treated with vehicle control (“Veh”). The proteins present in total cell lysates were examined (D); cell proliferation, migration, and apoptosis were examined by EdU-nuclei staining (E), “Transwell” (F), and TUNEL-nuclei staining (G) assays, respectively. Other primary colon cancer cells (pCan2 and pCan3) were subjected to a 24 h treatment with IMT1 (1 μM) or vehicle control (“Veh”), and the listed proteins in total cell lysates were analyzed (H). The data were presented as mean ± standard deviation (SD, n = 5), with *indicating P < 0.05 compared to “Veh” (A, H)/ “shC” (B)/“Vec” (C) and “n. s.” denoting non-statistical difference (P > 0.05) (B). #Indicating P < 0.05 (D-G). The experiments were repeated five times, yielding consistent results. The scale bar is set at 100 μm.
Fig. 9
Fig. 9. Oral administration of IMT1 impedes primary colon cancer xenograft growth in nude mice.
Nude mice bearing pCan1 xenografts were subjected to oral administration of either IMT1 (50 mg/kg body weight) or vehicle control (“Veh”). The volumes of pCan1 xenografts (A) and the body weights of the animals (D) were recorded at six-day intervals. The daily tumor growth rate, calculated in mm3 per day, was determined (B). At “Day-42,” all xenograft tumors were isolated and weighed (C). Additionally, one pCan1 xenograft from each group was isolated on Day 12 and Day 18 for the analysis of listed mRNA and protein expression (EG, L, and M). TBAR intensity (H), GSH/GSSG ratio (I), ATP levels (J), and Caspase-3 activity (N) were also measured. Furthermore, sections of pCan1 xenografts underwent IHC to test nuclear Ki-67 (K), as well as immunofluorescence detection of TUNEL-positive nuclei (O). Nude mice were injected via tail vein with pCan1 primary cells to establish the lung metastasis model. Mice were then subjected to oral administration of either IMT1 (50 mg/kg body weight) for two cycles (on Day 0 and Day 3) or vehicle control (“Veh”). After 40 days (“Day-40”), the number of lung metastases was quantified (P). Data were mean ± standard deviation (SD). In panels AD and P, every experimental group comprised ten mice (n = 10). For panels EO, measurements were conducted on five randomly selected tissue pieces within each xenograft (n = 5). *Indicating P < 0.05 compared to “Veh” treatment (A-E, GP) and “n. s.” denoting non-statistical difference (P > 0.05) (F). The scale bar is set at 100 μm.
Fig. 10
Fig. 10. The signaling carton of the study.
IMT1 blocks POLRMT activity, disrupts mitochondrial function, and hinders Akt-mTOR activation, thereby strongly inhibiting CRC cell growth in vitro and in vivo.

References

    1. Siegel RL, Wagle NS, Cercek A, Smith RA, Jemal A. Colorectal cancer statistics, 2023. CA Cancer J Clin. 2023;73:233–54. 10.3322/caac.21772 - DOI - PubMed
    1. Siegel RL, Miller KD, Wagle NS, Jemal A. Cancer statistics, 2023. CA Cancer J Clin. 2023;73:17–48. 10.3322/caac.21763 - DOI - PubMed
    1. Siegel RL, Miller KD, Fuchs HE, Jemal A. Cancer statistics, 2021. CA Cancer J Clin. 2021;71:7–33. 10.3322/caac.21654 - DOI - PubMed
    1. Dekker E, Tanis PJ, Vleugels JLA, Kasi PM, Wallace MB. Colorectal cancer. Lancet. 2019;394:1467–80. 10.1016/S0140-6736(19)32319-0 - DOI - PubMed
    1. Brenner H, Kloor M, Pox CP. Colorectal cancer. Lancet. 2014;383:1490–502. 10.1016/S0140-6736(13)61649-9 - DOI - PubMed

MeSH terms

Substances