. 2024 Sep 3;15(1):7627.
doi: 10.1038/s41467-024-51761-4.

Single-cell RNA sequencing illuminates the ontogeny, conservation and diversification of cartilaginous and bony fish lymphocytes

Affiliations

Single-cell RNA sequencing illuminates the ontogeny, conservation and diversification of cartilaginous and bony fish lymphocytes

Hong-Yan Wang et al. Nat Commun. .

Abstract

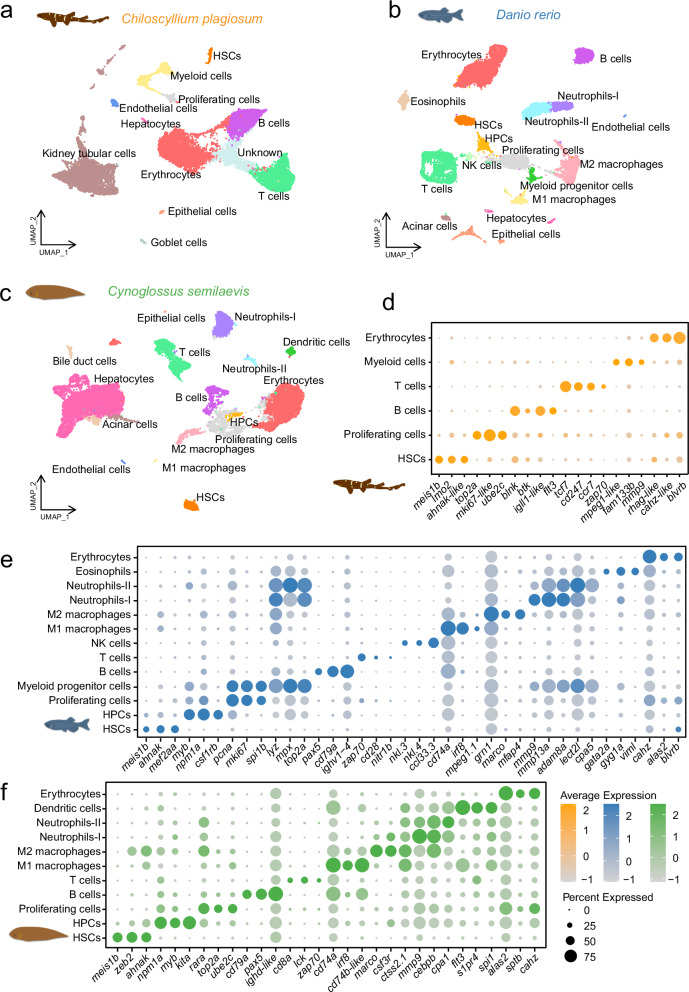
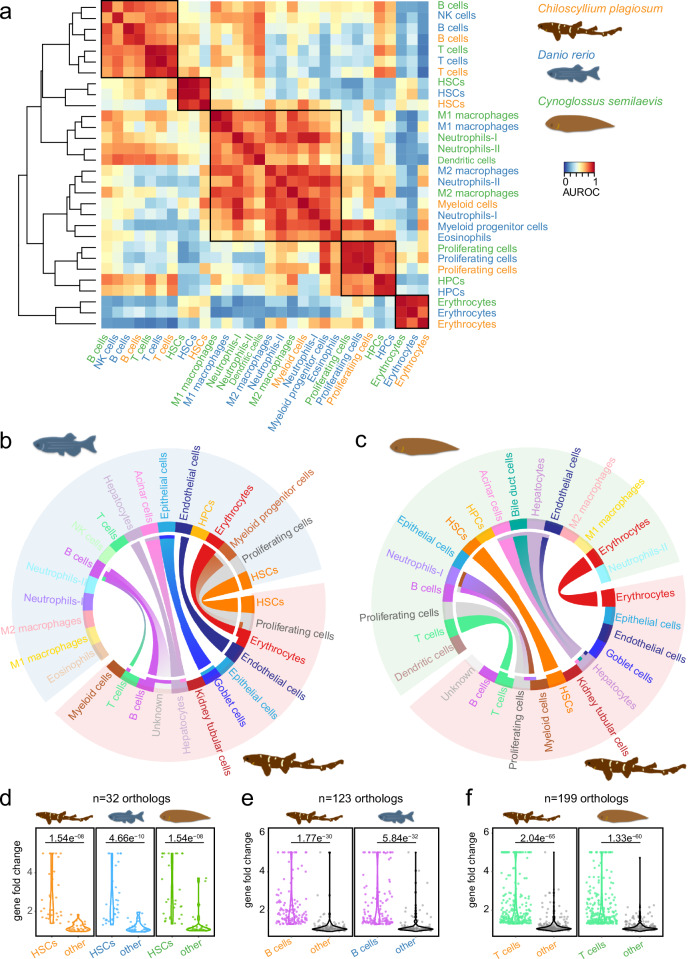
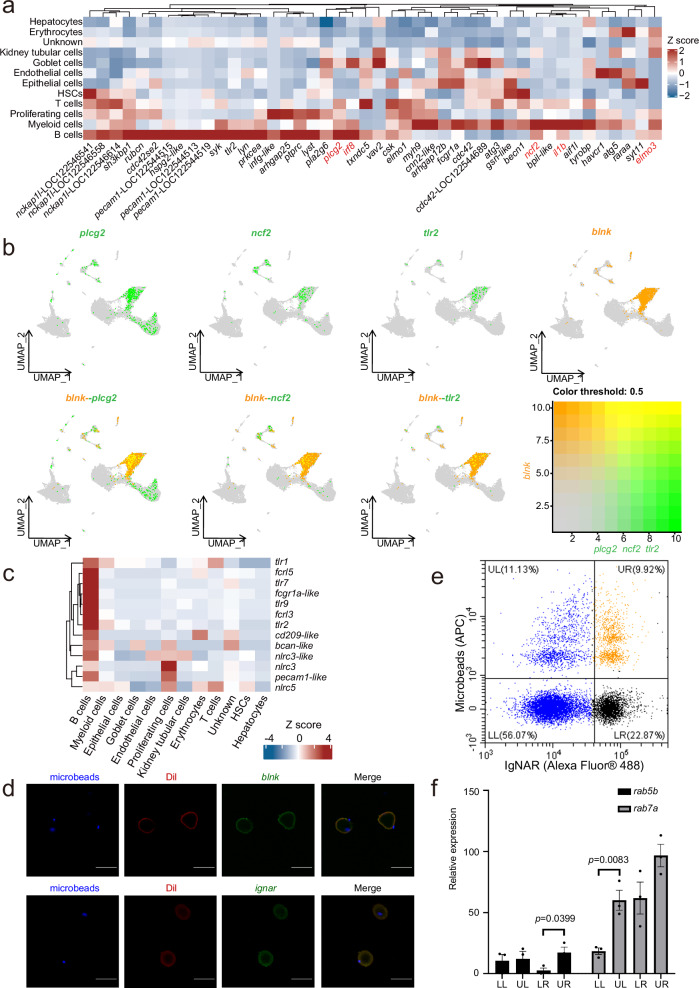
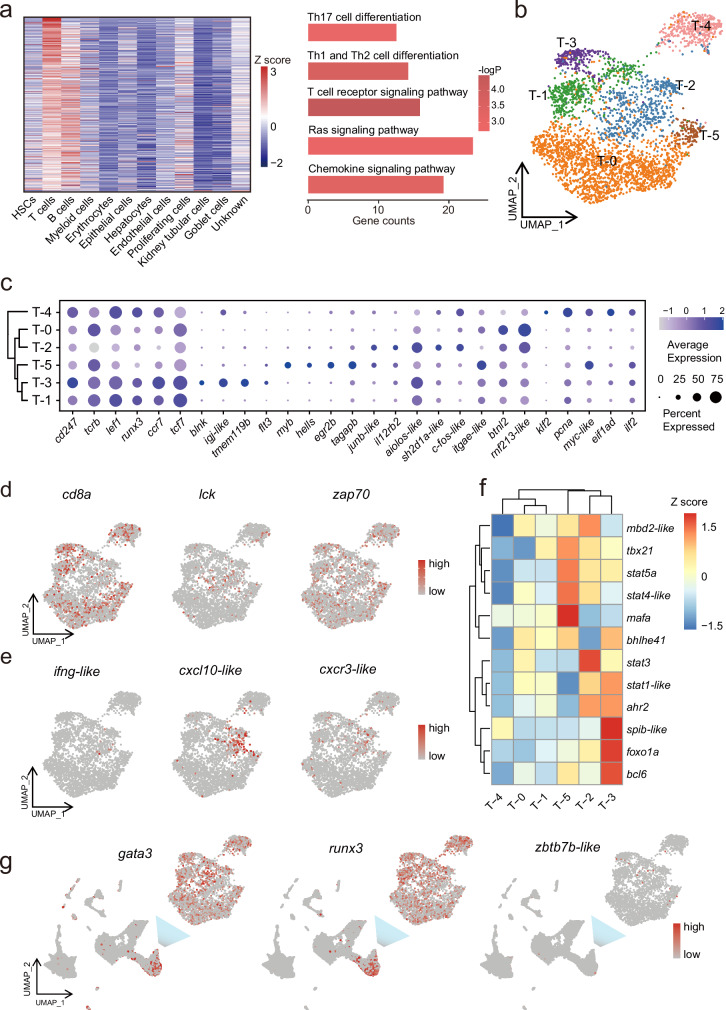
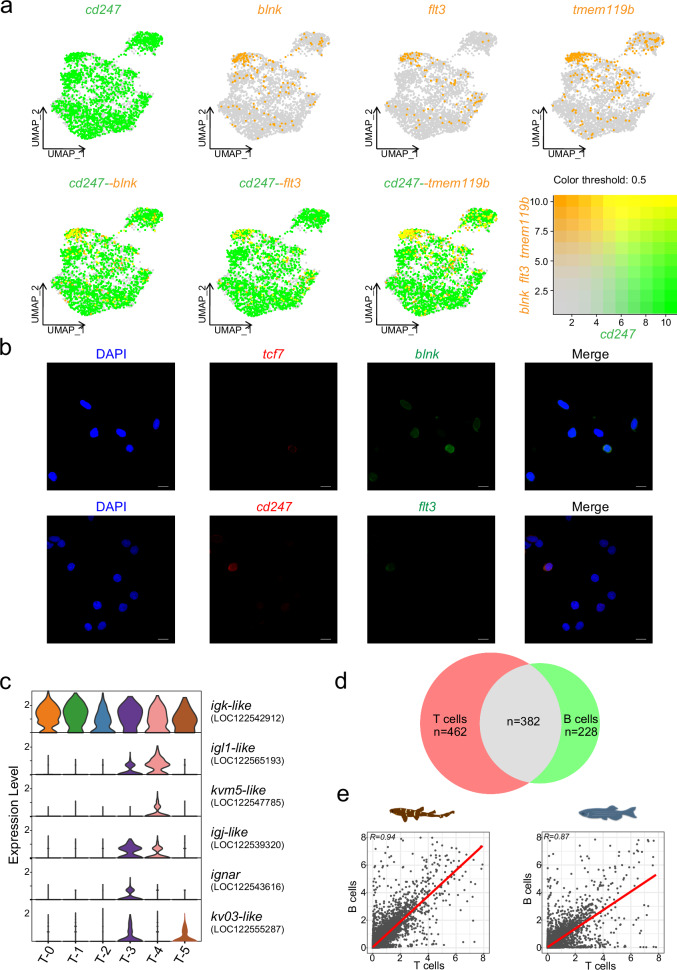
Elucidating cellular architecture and cell-type evolution across species is central to understanding immune system function and susceptibility to disease. Adaptive immunity is a shared trait of the common ancestor of cartilaginous and bony fishes. However, evolutionary features of lymphocytes in these two jawed vertebrates remain unclear. Here, we present a single-cell RNA sequencing atlas of immune cells from cartilaginous (white-spotted bamboo shark) and bony (zebrafish and Chinese tongue sole) fishes. Cross-species comparisons show that the same cell types across different species exhibit similar transcriptional profiles. In the bamboo shark, we identify a phagocytic B cell population expressing several pattern recognition receptors, as well as a T cell sub-cluster co-expressing both T and B cell markers. In contrast to a division by function in the bony fishes, we show close linkage and poor functional specialization among lymphocytes in the cartilaginous fish. Our cross-species single-cell comparison presents a resource for uncovering the origin and evolution of the gnathostome immune system.


Conflict of interest statement

The authors declare no competing interests.

Figures

Fig. 1
Fig. 1. Single-cell atlas of immune organs from white-spotted bamboo shark, zebrafish, and Chinese tongue sole.
ac UMAP visualization of all cells. Bamboo shark (a), zebrafish (b), and Chinese tongue sole (c). Each dot represents one cell, with labeled cell types being the predominant cell types in each cluster. df Dot plots showing the expression of key marker genes (x-axis) of major cell types (y-axis) in bamboo shark (d), zebrafish (e), and Chinese tongue sole (f). The depth of the color from light to dark and the size of the dots represent the average expression from low to high and the percentage of cells expressing the gene.
Fig. 2
Fig. 2. Analysis of the cell-type evolution of three species.
a Heatmap displays the ‘one versus best MetaNeighbour’ scores for immune cell types across three distinct species. AUROCs are determined by computing between the two closest neighbors in the test dataset, with the assumption that proximity equates to a higher scoring relationship. b, c Cross-species pairwise cell type similarities between bamboo shark and zebrafish (b), bamboo shark and Chinese tongue sole (c), based on Kullback-Leibler divergence (KLD). The top 5% highest values are depicted as arches linking different cell types, where the breadth of each arch corresponds to the degree of KLD-based similarity. df Violin plot showing the normalized expression of top shared orthologous genes (FC > 1.3, P-value < 0.001) in highly similar cell types across species, compared to the average expression of the same genes in all other cell types. Significance was calculated using paired Wilcoxon test between in- and outgroup cell types, Wilcoxon signed rank test adjusted P-value < 0.001 for all comparisons. d HSCs. e B cells in bamboo shark and zebrafish. f T cells in bamboo shark and Chinese tongue sole.
Fig. 3
Fig. 3. Conservation and divergence of B cell sub-types.
a UMAP plot showing the clustering of B cell subclusters from three species. b Dot plot showing the expression of most significant DEGs in each sub-cluster of B cells. c Heatmap showing the conserved and teleost-specific differentially expressed genes in B cell sub-clusters. Enriched Gene Ontology categories for DEGs of B-3 (colored green) and B-6 (colored purple), respectively. The enrichment analysis was generated using Fisher’s exact test on the Metasape web server, with Bonferroni correction for multiple hypotheses testing. P-values are indicated on the x-axis. d, e UpSet plots showing shared orthologs of three species in B-3 (d) and B-6 (e). f Heatmap showing the expression of conserved DEGs in B-6 sub-cluster of three species.
Fig. 4
Fig. 4. Phagocytic function of B cells in bamboo shark.
a Heatmap showing the expression of phagocytosis gene set in B cells of bamboo shark. b UMAP plots showing co-expression of blnk with plcg2, ncf2, and tlr2, respectively, in B cells of bamboo shark. The co-expression color threshold for all genes is based on the same standard of 0.5. c Heatmap showing the expression of pattern recognition receptors in B cell. d Confocal laser scanning microscopic images of phagocytosis of fluorescence-labeled microbeads by B cells (n = 3 biological replicates), B cells were detected by fluorescence in situ hybridization (FISH) with B cell markers (blnk and ignar). Cell membranes were stained with Dil.  Scale bar = 10 μm. e Flow cytometry identification of phagocytic B cells in bamboo shark spleen cells by the combination of fluorescence-labeled microbeads and anti-IgNAR antibody. LL, lower left: indicates IgNAR- non-phagocytic cells; UL, upper left: indicates IgNAR- phagocytic cells; LR, lower right: indicates IgNAR+ non-phagocytic cells; UR, upper right: indicates IgNAR+ non-phagocytic cells. f, RT-qPCR analysis of the expression of phagocytotic gene in FACS-sorted cells in Fig. 4e. n = 3 independent biological replicates. Bars represent mean values + /− SEM. P-values were determined using the two-tailed Mann–Whitney test.
Fig. 5
Fig. 5. Characterization of T cell sub-types in the bamboo shark.
a Heatmap showing the expression of all DEGs of T cells in bamboo shark. Gene expression levels utilize a Z score, which depicts variance from the mean, as defined on the color key in the right top corner (left). Histogram showing KEGG pathways enriched by these genes (right). The enrichment analysis was generated using Fisher’s exact test, with Benjamini-Hochberg (BH) corrected for multiple hypotheses testing. The P-values is represented by the depth of red. b UMAP plot showing 6 T cell subsets of bamboo shark. c Dot plot showing expression levels of selected signature genes in T cell subsets. Dot size indicates the fraction of expressing cells, colored based on normalized expression levels. d UMAP plot showing T cell activation-related gene expression in different T cell subsets. e UMAP plot showing Th2-related gene expression across T cell subsets. f Heatmap showing CD4+ T cell subset transcription factor expression across T cell subsets. g UMAP plot showing CD8+ T cell and CD4+ T cell key transcription factor expression across T cell subsets and immune cell lineages.
Fig. 6
Fig. 6. Co-expression of T cell and B cell marker genes in T-3 subsets.
a UMAP plots showing co-expression of cd247 and blnk, flt3, tmem119b, respectively, in T cell subsets of bamboo shark. The co-expression color threshold for all genes is based on the same standard of 0.5. b fluorescence in situ hybridization (FISH) showing co-expression of B cell markers (blnk and flt3) and T cell markers (cd247 and tcf7). c Violin plots showing immunoglobulin gene expression in T cell subsets. d Venn diagram showing the intersection of all DEGs in T cells and B cells of bamboo shark (n = 3 biological replicates), Scale bar = 10 μm. e Scatter plots show the correlation of gene expression in T cells and B cells in bamboo shark and zebrafish, respectively. The correlation coefficient R is calculated by Pearson correlation test (two-sided).

Similar articles

Cited by

References

    1. Arendt, D. et al. The origin and evolution of cell types. Nat. Rev. Genet17, 744–757 (2016). 10.1038/nrg.2016.127 - DOI - PubMed
    1. Network, B. I. C. C. A multimodal cell census and atlas of the mammalian primary motor cortex. Nature598, 86–102 (2021). 10.1038/s41586-021-03950-0 - DOI - PMC - PubMed
    1. Hodge, R. D. et al. Conserved cell types with divergent features in human versus mouse cortex. Nature573, 61–68 (2019). 10.1038/s41586-019-1506-7 - DOI - PMC - PubMed
    1. Shami, A. N. et al. Single-cell RNA sequencing of human, macaque, and mouse testes uncovers conserved and divergent features of mammalian spermatogenesis. Dev. Cell54, 529–547.e512 (2020). 10.1016/j.devcel.2020.05.010 - DOI - PMC - PubMed
    1. Flajnik, M. F. A cold-blooded view of adaptive immunity. Nat. Rev. Immunol.18, 438–453 (2018). 10.1038/s41577-018-0003-9 - DOI - PMC - PubMed

Publication types

Associated data

LinkOut - more resources