. 2024 Sep 3;15(1):7654.
doi: 10.1038/s41467-024-51882-w.

Citrullination modulation stabilizes HIF-1α to promote tumour progression

Affiliations

Citrullination modulation stabilizes HIF-1α to promote tumour progression

Rui Chen et al. Nat Commun. .

Abstract

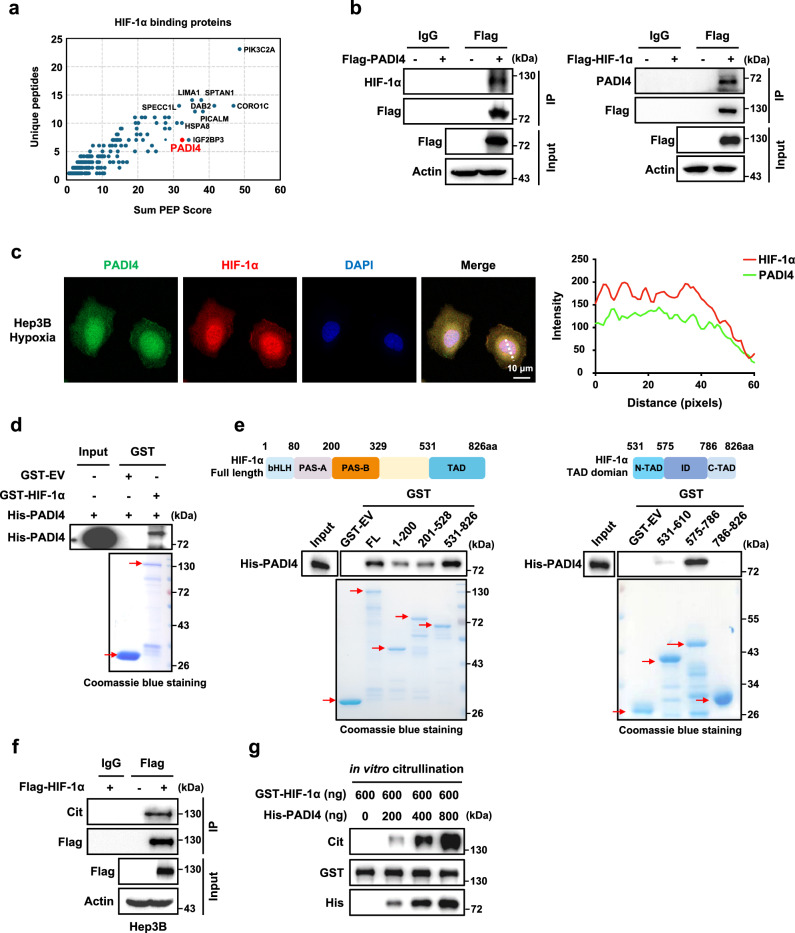
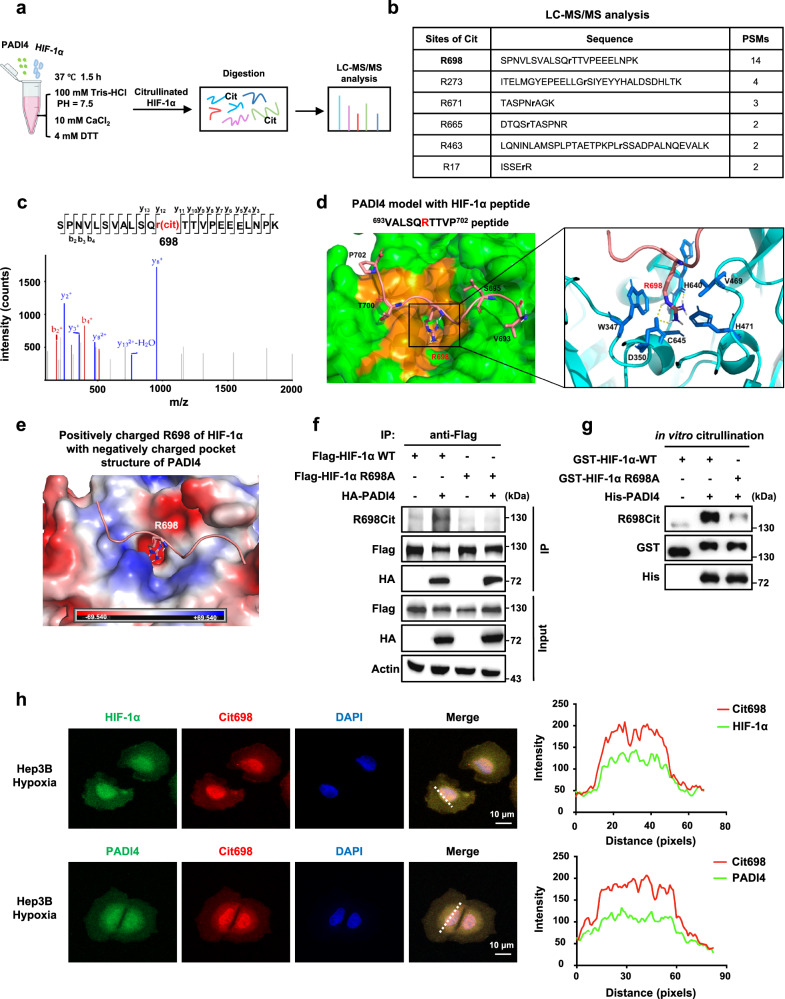
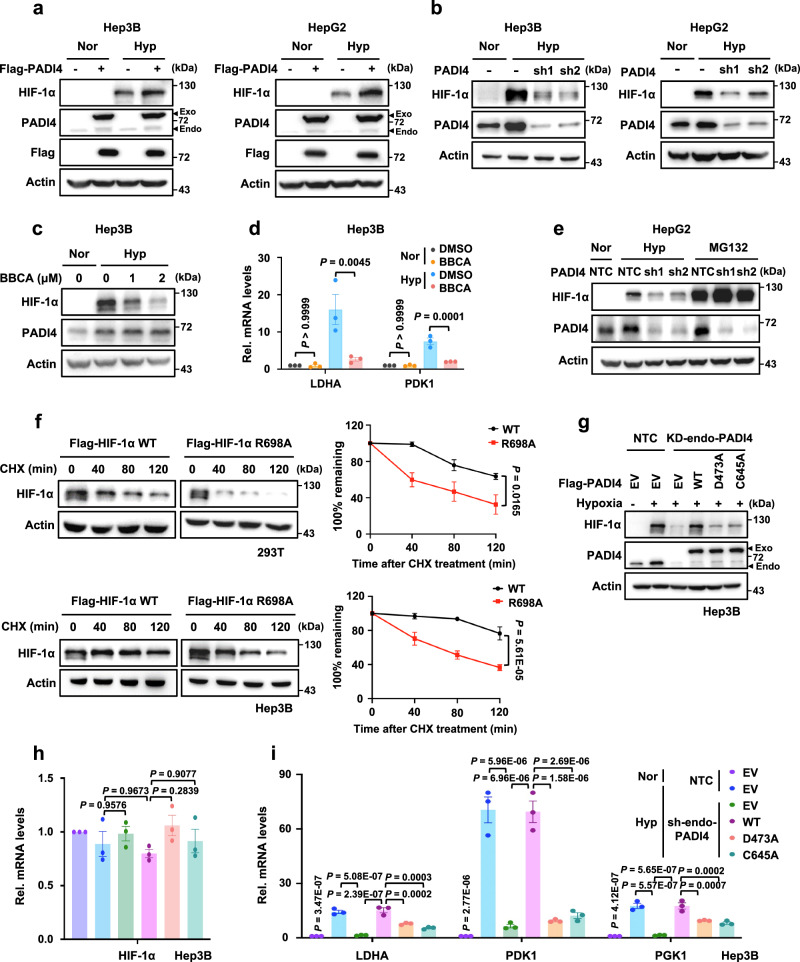
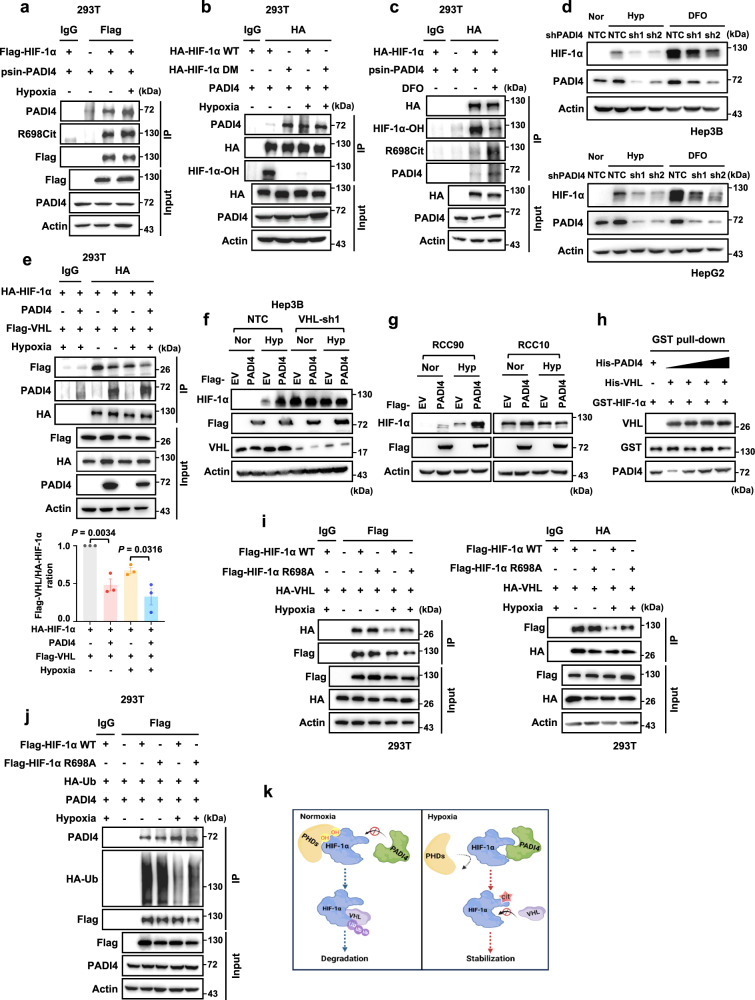
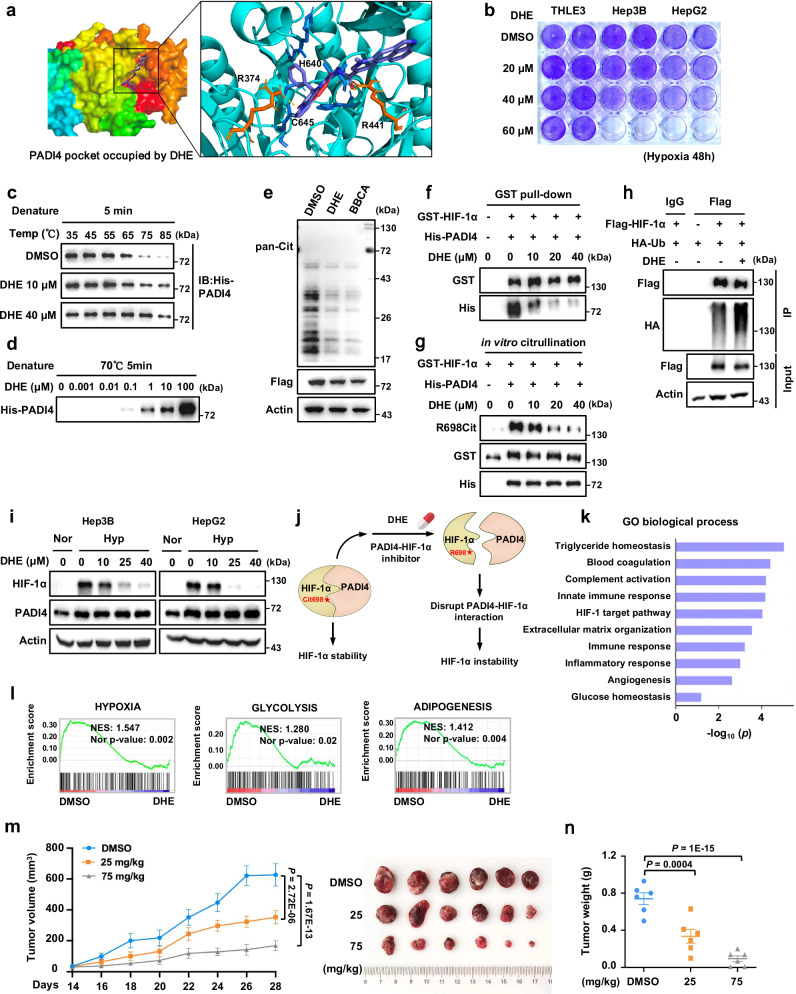
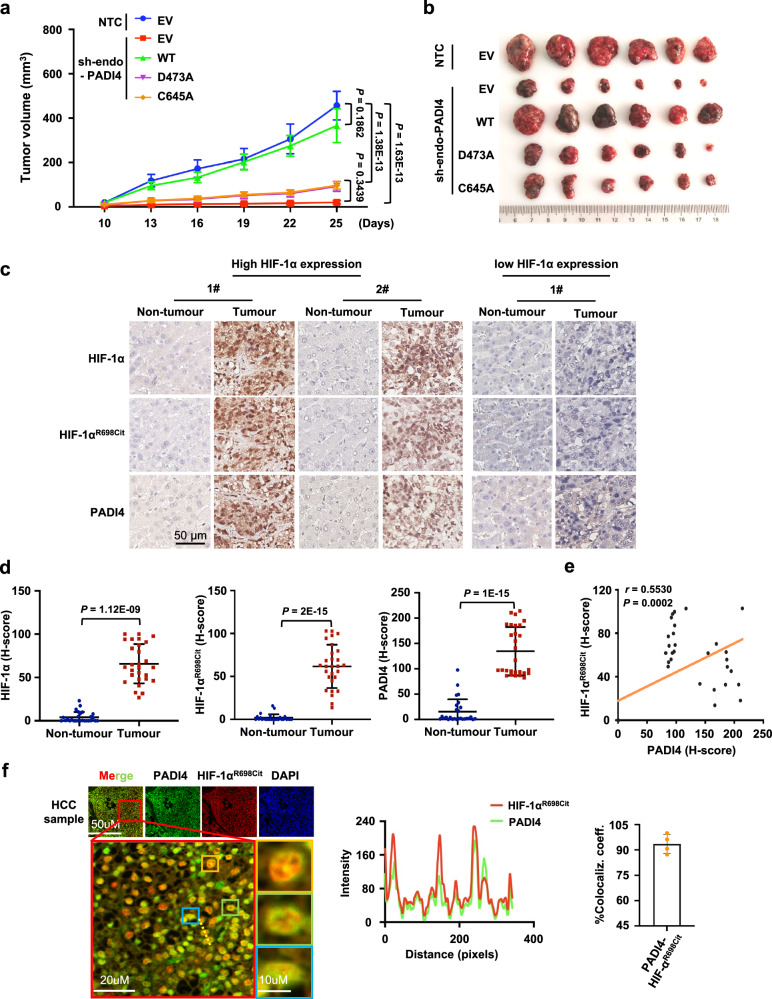
Citrullination plays an essential role in various physiological or pathological processes, however, whether citrullination is involved in regulating tumour progression and the potential therapeutic significance have not been well explored. Here, we find that peptidyl arginine deiminase 4 (PADI4) directly interacts with and citrullinates hypoxia-inducible factor 1α (HIF-1α) at R698, promoting HIF-1α stabilization. Mechanistically, PADI4-mediated HIF-1αR698 citrullination blocks von Hippel-Lindau (VHL) binding, thereby antagonizing HIF-1α ubiquitination and subsequent proteasome degradation. We also show that citrullinated HIF-1αR698, HIF-1α and PADI4 are highly expressed in hepatocellular carcinoma (HCC) tumour tissues, suggesting a potential correlation between PADI4-mediated HIF-1αR698 citrullination and cancer development. Furthermore, we identify that dihydroergotamine mesylate (DHE) acts as an antagonist of PADI4, which ultimately suppresses tumour progression. Collectively, our results reveal citrullination as a posttranslational modification related to HIF-1α stability, and suggest that targeting PADI4-mediated HIF-1α citrullination is a promising therapeutic strategy for cancers with aberrant HIF-1α expression.


Conflict of interest statement

The authors declare no competing interests.

Figures

Fig. 1
Fig. 1. PADI4 directly interacts with and citrullinates HIF-1α.
a Cellular extracts from Hep3B cells stably expressing empty vector (EV) or Flag-HIF-1α were immunoprecipitated with an anti-Flag antibody and then eluted. The eluted proteins were separated by SDS-PAGE and the protein bands were retrieved and analyzed by mass spectrometry (MS). b Hep3B cells stably expressing Flag-PADI4 (left panel) or Flag-HIF-1α (right panel) were cultured under hypoxic conditions for 6 h, followed by immunoprecipitation analysis. c Immunofluorescence (IF) analysis of the colocalization of endogenous HIF-1α (red) and PADI4 (green) in Hep3B cells cultured under hypoxic conditions for 6 h. Scale bars: 10 μm (left panel). Intensity profiles of each line were quantified with ImageJ software and drawn with GraphPad Prism 7.0 (right panel). d GST pull-down of His-PADI4 by GST-EV or GST-HIF-1α using proteins purified in Escherichia coli. e GST pull-down of His-PADI4 by GST-EV or GST fusion protein containing the full-length (FL) or indicated truncation mutants of HIF-1α. f Hep3B cells expressing Flag-EV or Flag-HIF-1α were immunoprecipitated with either IgG or anti-Flag antibody, followed by western blotting analysis with antibody against pan citrulline or Flag. g An in vitro citrullination assay was performed by incubating purified His-PADI4 and GST-HIF-1α proteins at 37 °C for 1.5 h in catalytic buffer and probing with an anti-pan citrulline antibody. The samples were derived from the same experiment, but different gels for Cit, His, and another for GST were processed in parallel. Immunoblots and immunofluorescence are representative of three independent experiments (bg). Source data are provided as a Source Data file.
Fig. 2
Fig. 2. PADI4 promotes HIF-1α citrullination at R698.
a Diagram showing the in vitro citrullination assay with His-PADI4 protein and GST-HIF-1α proteins in catalytic buffer at 37 °C for 1.5 h. Modified GST-HIF-1α proteins were separated by SDS-PAGE and subsequently subjected to liquid chromatography-mass spectrometry tandem mass spectrometry (LC-MS/MS) analysis. b The citrulline modification sites in HIF-1α were determined by LC-MS/MS. They were R17, R273, R463, R665, R671, and R698. c LC-MS/MS spectrum of the citrullinated peptide containing the R698 site in HIF-1α. d Molecular docking model for the interaction of PADI4 (RCSB PDB: 1WDA) with HIF-1α. A close-up view of the peptide binding site of PADI4 is shown in the cartoon, in which green represents the surface and orange represents the pocket structure. The HIF-1α 693VALSQRTTVP702 peptide is shown as a magenta ribbon and the stick represents side chains (coloured by atom type: oxygen, red; nitrogen, blue; C, grey). The interfacial regions between PADI4 (blue) and HIF-1α (magenta) indicate an interaction between R698 on HIF-1α and the pocket structure of PADI4. W347, D350, V469, H471, H640 and C645 of PADI4 come in close contact. e The surface electrostatic potential of the docking model. Positively charged R698 of the HIF-1α 693VALSQRTTVP702 peptide with the negatively charged pocket structure of PADI4. The electrostatic potential is colour-coded as −69.540 kcal/mol (red) to +69.540 kcal/mol (blue), thus displaying negative or positive charges, respectively. f HEK293T cells expressing WT Flag-HIF-1α or Flag-HIF-1α R698A together with HA-PADI4 were used for immunoprecipitation analysis. g An in vitro citrullination assay was performed by incubating purified WT GST-HIF-1α or GST-HIF-1αR698A with His-PADI4 at 37 °C for 1.5 h, followed by western blotting analysis. h IF analysis of the colocalization of citrullinated HIF-1αR698 with HIF-1α or PADI4 in Hep3B cells under hypoxic conditions. Scale bars: 10 μm (left panel). Intensity profiles of each line were quantified by ImageJ software and drawn with GraphPad Prism 7.0 (right panel). Immunoblots and immunofluorescence are representative of three independent experiments (fh). Figure 2a, created with BioRender.com, is released under a Creative Commons Attribution-NonCommercial-NoDerivs 4.0 International license. Source data are provided as a Source Data file.
Fig. 3
Fig. 3. PADI4-mediated citrullination of HIF-1α promotes HIF-1α stability and transactivation.
a Hep3B (left panel) and HepG2 cells (right panel) expressing Flag-EV or Flag-PADI4 were cultured under normoxic or hypoxic conditions for 6 h, followed by western blotting analysis. The samples were derived from the same experiment, but different gels for HIF-1α, Flag, Actin, and another for PADI4 were processed in parallel. b Hep3B and HepG2 cells expressing NTC or PADI4 shRNAs were cultured under normoxic or hypoxic conditions for 6 h, followed by western blotting analysis. c Hep3B cells were treated with DMSO or 1 or 2 μM BBCA for 24 h, followed by hypoxic treatment for another 6 h before western blotting analysis. d Hep3B cells were treated with DMSO or 2 μM BBCA for 24 h, followed by hypoxic treatment for another 24 h. The mRNA levels of LDHA and PDK1 were analyzed by qPCR. e Western blot analysis of HIF-1α and PADI4 protein levels in HepG2 cells expressing NTC and PADI4 shRNAs cultured under normoxic or hypoxic conditions in the presence or absence of 10 μM MG132 for 6 h. f Western blot analysis (left panel) of HIF-1α protein levels in HEK293T (upper panel) and Hep3B cells (lower panel) expressing Flag-HIF-1αWT or Flag-HIF-1αR698A treated with 20 μg/ml CHX for the indicated times. Quantification of HIF-1α protein levels relative to Actin. g, h Endogenous PADI4-knockdown Hep3B cells were infected with viruses expressing Flag-EV, Flag-PADI4WT, Flag-PADI4D473A, or Flag-PADI4C645A and further cultured under normoxic or hypoxic conditions for 6 h. Cell lysates were harvested, and the protein and mRNA levels of HIF-1α were analyzed by western blotting (g) or qPCR (h), respectively. i The cell lines described in Fig. 3g were cultured under normoxic or hypoxic conditions for 24 h. The mRNA levels of LDHA, PDK1, and PGK1 were analyzed by qPCR. Immunoblots are representative of three independent experiments (ac, eg). Data were presented as mean ± SEM of three independent experiments (d, f, h, i). Statistical analyses were performed by ordinary one-way ANOVA (d, h, i) or two-way ANOVA test (f) with Turkey’s multiple comparisons test. Source data are provided as a Source Data file.
Fig. 4
Fig. 4. Citrullination of HIF-1α disrupts the interaction of HIF-1α and VHL.
a HEK293T cells transfected with Flag-EV or Flag-HIF-1α plasmid together with PADI4 plasmid were cultured under normoxic or hypoxic conditions for 6 h, followed by immunoprecipitation analysis. The IP samples were derived from the same experiment, but different gels for PADI4, R698Cit, another for Flag were processed in parallel. b HEK293T cells transfected with HA-HIF-1αWT or HA-HIF-1αDM (double mutant, P402/564 A) plasmids together with PADI4 plasmids were cultured under normoxic or hypoxic conditions for 6 h, followed by immunoprecipitation analysis. The IP samples were derived from the same experiment, but different gels for PADI4, HA, and another for HIF-1α-OH were processed in parallel. c HEK293T cells were transfected with HA-EV or HA-HIF-1α plasmids together with psin-PADI4 plasmids with or without DFO in the presence of MG132 under normoxic condition for 6 h, followed by immunoprecipitation analysis. The IP samples were derived from the same experiment, but different gels for HA, another for HIF-1α-OH and another for R698Cit, PADI4 were processed in parallel. d Hep3B (upper panel) and HepG2 (lower panel) cells expressing NTC or PADI4 shRNAs were treated by hypoxia or DFO for 6 h, followed by western blotting analysis. e HEK293T cells transfected with EV or PADI4 together with HA-HIF-1α and Flag-VHL plasmids were cultured under normoxic or hypoxic conditions in the presence of 10 μM MG132 for 8 h, followed by immunoprecipitation analysis (upper panel). Quantification of Flag-VHL protein levels relative to HA-HIF-1α protein levels (lower panel). f Hep3B-Flag-EV or Flag-PADI4 cells infected with a virus expressing NTC or VHL shRNA were cultured under normoxic or hypoxic conditions for 6 h, followed by western blotting analysis. g RCC90 (VHL wild type) and RCC10 (VHL-null) cells expressing Flag-EV or Flag-PADI4 were cultured under normoxic or hypoxic conditions for 6 h, followed by western blotting analysis. h In vitro analysis of the interaction between purified GST-HIF-1α and His-VHL with increased amounts of His-PADI4. i HEK293T cells transfected with Flag-HIF-1αWT or Flag-HIF-1αR698A mutant and HA-VHL plasmids were cultured under normoxic or hypoxic conditions for 6 h, followed by immunoprecipitation analysis. j HEK293T cells transfected with Flag-HIF-1αWT or Flag-HIF-1αR698A mutant together with HA-Ub and PADI4 plasmids were cultured under normoxic or hypoxic conditions for 6 h, followed by immunoprecipitation analysis. The IP samples were derived from the same experiment, but different gels for PADI4, Flag, and another for HA were processed in parallel. k Diagram showing the mechanism by which PADI4 promotes the stability of HIF-1α. Immunoblots are representative of three independent experiments (aj). Error bars denote the mean ± SEM (e). Statistical analyses were performed by ordinary one-way ANOVA with Turkey’s multiple comparisons test (e). Figure 4k created with BioRender.com is released under a Creative Commons Attribution-NonCommercial-NoDerivs 4.0 International license. Source data are provided as a Source Data file.
Fig. 5
Fig. 5. Dihydroergotamine mesylate disrupts PADI4-HIF-1α interaction and represses HIF-1α expression.
a Molecular docking of dihydroergotamine (DHE) in the enzymatic pocket of PADI4. b THLE3, Hep3B and HepG2 cells were treated with DMSO or DHE as indicated concentration for 48 h under hypoxia, followed by crystal violet staining assay. c His-PADI4 proteins were incubated with DMSO or DHE under the indicated temperature before western blotting analysis. d His-PADI4 proteins were incubated with DHE as indicated concentration before western blotting analysis. e Cell lysates of Hep3B-Flag-PADI4 cells were incubated with DMSO, 50 μM DHE, or 50 μM BBCA at 37 °C for 20 min before western blotting analysis. The samples were derived from the same experiment, but different gels for pan-Cit, another for Flag, Actin were processed in parallel. f Pull-down of His-PADI4 by GST-HIF-1α in the presence of DMSO or DHE as indicated concentration. g An in vitro citrullination assay of GST-HIF-1α was performed in the presence of DMSO or DHE as indicated concentration. The samples were derived from the same experiment, but different gels for R698Cit, His, another for GST were processed in parallel. h HEK293T cells transfected with Flag-EV or Flag-HIF-1αWT together with HA-Ub were treated with DMSO or 25 μM DHE for 24 h and MG132 for 6 h, followed by immunoprecipitation analysis. The IP samples were derived from the same experiment, but different gels for Flag and another for HA were processed in parallel. i Hep3B and HepG2 cells were treated with DMSO or DHE as indicated concentration for 24 h and then cultured under normoxic or hypoxic conditions for another 6 h before western blotting analysis. j Diagram showing the working mechanism of DHE in regulating HIF-1α protein levels. k, l Total mRNA in Hep3B cells treated with DMSO or 20 μM, or 40 μM DHE under hypoxic conditions for 24 h were subjected to RNA-sequencing, followed by GO biological processes (k) and GSEA (l) analysis. m, n Parental Hep3B cells were injected subcutaneously into the flanks of BALB/c nude mice (n = 6 per group). After 12 days, the mice were treated with DMSO or DHE (25 mg/kg or 75 mg/kg) by i.g every 2 days. Tumour volume was determined starting on Day 14 and photographs show xenografts at the end of the experiment (m). Tumour weight was measured (n). Immunoblots are representative of three independent experiments (ci). Error bars denote the mean ± SEM (m, n). Statistical analyses were performed by ordinary one-way ANOVA (n) or two-way ANOVA (m) with Turkey’s multiple comparisons test. Source data are provided as a Source Data file.
Fig. 6
Fig. 6. PADI4-mediated HIF-1αR698 citrullination promotes HCC tumorigenesis.
a, b The cell lines described in Fig. 3g were injected subcutaneously into male BALB/c nude mice (n = 6 per group). Tumour volume was measured starting on Day 10 and determined based on calliper measurements every 3 days (a). Photographs show xenografts at the end of the experiment (Day 25) (b). c Representative results of the IHC analysis of HIF-1α, HIF-1αR698Cit and PADI4 in normal liver tissues (Non-tumour, n = 40) and HCC specimens (Tumour, n = 41) with low or high HIF-1α expression. Scale bars, 50 μm. d Statistical analysis of the IHC results shown in Fig. 6c. HIF-1α, HIF-1αR698Cit and PADI4 protein levels in high HIF-1α expression samples were quantified using HALO software (Non-tumour, n = 27; Tumour, n = 28). e HIF-1αR698Cit protein levels are positively correlated with PADI4 protein levels in clinical HCC lesions (n = 41). Pearson correlation analyses were performed. f Representative multiplex IHC (mIHC) image of HIF-1αR698Cit and PADI4 in HCC samples. Scale bars, 50 µm (upper panel), 20 µm (left layer panel) and 10 µm (right layer panel). The intensity profiles of each line were quantified with ImageJ software and drawn with GraphPad Prism 7.0. Experiments were performed in four HCC tumour specimens. The results are shown as the means of the colocalization coefficient of HIF-1αR698Cit and PADI4. Error bars denote the mean ± SEM (a) and mean ± SD (d). Statistical analyses were performed by ordinary two-way ANOVA with Turkey’s multiple comparisons test (a), two-tailed paired Student’s t-test (d), or Pearson correlation analyses (e). Source data are provided as a Source Data file.

References

    1. Harris, A. L. Hypoxia–a key regulatory factor in tumour growth. Nat. Rev. Cancer2, 38–47 (2002). 10.1038/nrc704 - DOI - PubMed
    1. Singleton, D. C., Macann, A. & Wilson, W. R. Therapeutic targeting of the hypoxic tumour microenvironment. Nat. Rev. Clin. Oncol.18, 751–772 (2021). 10.1038/s41571-021-00539-4 - DOI - PubMed
    1. Chen, Z., Han, F., Du, Y., Shi, H. & Zhou, W. Hypoxic microenvironment in cancer: molecular mechanisms and therapeutic interventions. Signal Transduct. Taget. Ther.8, 70 (2023).10.1038/s41392-023-01332-8 - DOI - PMC - PubMed
    1. Semenza, G. L. Targeting HIF-1 for cancer therapy. Nat. Rev. Cancer3, 721–732 (2003). 10.1038/nrc1187 - DOI - PubMed
    1. Semenza, G. L. HIF-1 mediates metabolic responses to intratumoral hypoxia and oncogenic mutations. J. Clin. Invest.123, 3664–3671 (2013). 10.1172/JCI67230 - DOI - PMC - PubMed

Publication types

MeSH terms

Substances

Associated data