Clinical Trial
. 2024 Sep 3;15(1):7695.
doi: 10.1038/s41467-024-52098-8.

Neoadjuvant immune checkpoint blockade in women with mismatch repair deficient endometrial cancer: a phase I study

Affiliations
Clinical Trial

Neoadjuvant immune checkpoint blockade in women with mismatch repair deficient endometrial cancer: a phase I study

Anneke L Eerkens et al. Nat Commun. .

Abstract

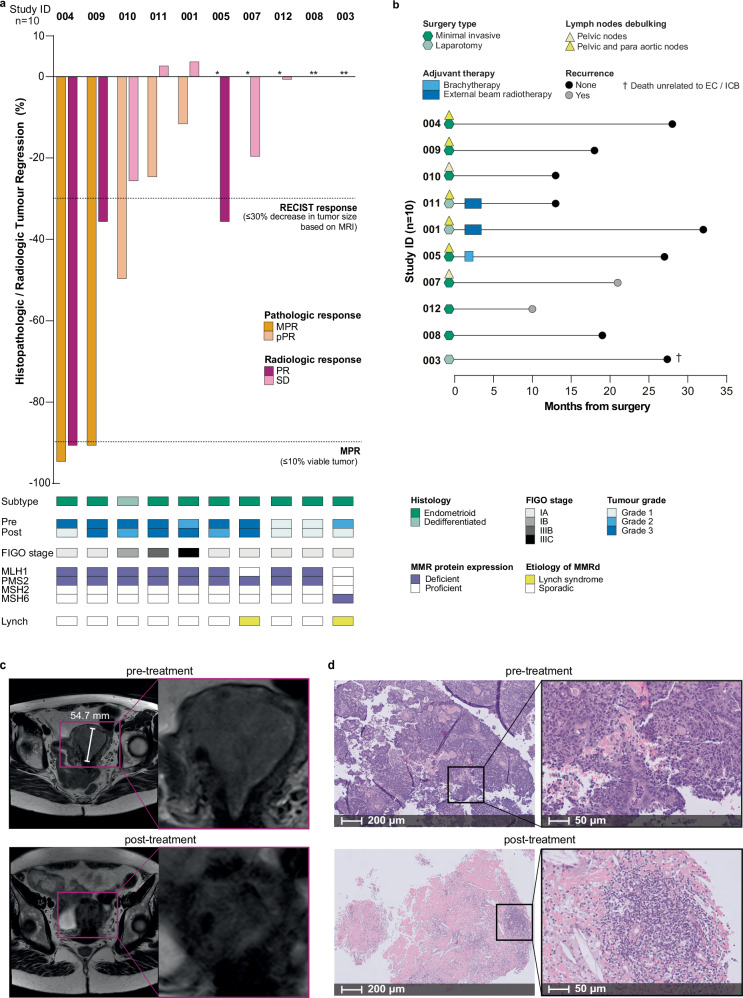
Neoadjuvant immune checkpoint blockade (ICB) has shown unprecedented activity in mismatch repair deficient (MMRd) colorectal cancers, but its effectiveness in MMRd endometrial cancer (EC) remains unknown. In this investigator-driven, phase I, feasibility study (NCT04262089), 10 women with MMRd EC of any grade, planned for primary surgery, received two cycles of neoadjuvant pembrolizumab (200 mg IV) every three weeks. A pathologic response (primary objective) was observed in 5/10 patients, with 2 patients showing a major pathologic response. No patient achieved a complete pathologic response. A partial radiologic response (secondary objective) was observed in 3/10 patients, 5/10 patients had stable disease and 2/10 patients were non-evaluable on magnetic resonance imaging. All patients completed treatment without severe toxicity (exploratory objective). At median duration of follow-up of 22.5 months, two non-responders experienced disease recurrence. In-depth analysis of the loco-regional and systemic immune response (predefined exploratory objective) showed that monoclonal T cell expansion significantly correlated with treatment response. Tumour-draining lymph nodes displayed clonal overlap with intra-tumoural T cell expansion. All pre-specified endpoints, efficacy in terms of pathologic response as primary endpoint, radiologic response as secondary outcome and safety and tolerability as exploratory endpoint, were reached. Neoadjuvant ICB with pembrolizumab proved safe and induced pathologic, radiologic, and immunologic responses in MMRd EC, warranting further exploration of extended neoadjuvant treatment.


Conflict of interest statement

HWN and MB received grants from the Dutch Cancer Society (KWF), the European Research Council (ERC), Health Holland (HH), Mendus, BioNovion, Aduro Biotech, Vicinivax, Genmab and IMMIOS (all paid to the institute); received non-financial support from BioNTech, Surflay Nanotec and Merck Sharp & Dohme; are stock option holders in Sairopa. DC reports to be part of the advisory board for Merck Sharp & Dohme, his immediate family member is an Amgen employee, and received funding from HalioDx, unrelated to the subject of this manuscript. VHK served as an invited speaker on behalf of Sharing Progress in Cancer Care (SPCC) and Indica Lab, reports to be part of the advisory board of Takeda, and has sponsored research agreements with Roche and IAG, all unrelated to the current trial. TB received grants from the Dutch Cancer Society, unrelated to the subject of this manuscript. JB received grants from the Dutch Cancer society and AstraZeneca. MJ reports to be part of the advisory board of Pierre Fabre, AstraZeneca, BMS, and GSK. All other authors declare no competing interests.

Figures

Fig. 1
Fig. 1. Pathologic and radiologic responses to neoadjuvant ICB.
a Waterfall plots showing the percentage pathologic regression and the percentage radiographic change from baseline in the sum of the target lesion after neoadjuvant administration of 2 cycles of pembrolizumab (n = 10). The first dotted line indicates the cutoff for radiological partial response (PR) according to RECIST 1.1. The second dotted line depicts the threshold for major pathological response (MPR) corresponding to 90% regression. The orange bar colours reflect the pathologic response (dark orange: MPR; light orange: pathological Partial Response (pPR)). The pink bar colours represent the radiologic response (dark pink: partial response (PR); light pink: stable disease (SD)). Pathological features are annotated for each patient and include histological subtype, tumour grade at baseline and in the resection specimen, (pathologic) FIGO stage after treatment, expression of MisMatch Repair (MMR) proteins, and the aetiology of MMR deficiency (MMRd). The numbers above the bars represent the study ID of each patient. *: no pathologic response; **: no pathologic response and radiologic response not measurable and/or not determined due to Covid restrictions. b Swimmer plot depicting per patient the timeline of follow-up, type of surgery, lymph nodes debulking at time of surgery, type of adjuvant therapy, and recurrence / mortality (n = 10). c Representative MRI images of the uterus pre- versus post-treatment with 2 cycles of neoadjuvant pembrolizumab from PAM-004. Similar experiments conducted for 8 patients d Representative H&E images of pre- versus post-treatment biopsy tissue from PAM-004. The pretreatment biopsy shows a grade 3 endometrioid adenocarcinoma. The post-treatment biopsy shows the fibrotic tumour bed with immune-cell infiltration. Similar experiments conducted for all 10 patients. Source data are provided as a source data file. Abbreviations: ICB immune checkpoint blockade, MRI magnetic resonance imaging, MPR major pathological response, pPR partial pathological response, PR partial response, SD stable disease.
Fig. 2
Fig. 2. Clinicopathologic predictors and correlates of response to ICB.
a Violin plots showing the percentage of pathologic and radiologic tumour regression among patients with pre-operative low-grade tumour (grade 1 and 2) (n = 4) versus patients with a pre-operative high-grade tumour (grade 3) (n = 6). The white dots represent the means of the data, and the error bars indicate the 95% confidence intervals around the means. Statistical significance was assessed using the Mann–Whitney U test. b Violin plots depicting the percentage of pathologic and radiologic tumour regression among patients with MMRd caused by Lynch syndrome (n = 2) versus patients with a sporadic mutation (n = 8). The white dots represent the means of the data, and the error bars indicate the 95% confidence intervals around the means. Statistical significance was assessed using the Mann–Whitney U test. c Violin plots showing the percentage of pathologic and radiologic tumour regression among patients with a mutation in their MMR genes (n = 4) versus patients with hypermethylation of their MMR genes (n = 6). The white dots represent the means of the data, and the error bars indicate the 95% confidence intervals around the means. Statistical significance was assessed using the Mann–Whitney U test. d Dot plot showing the mutations per megabase (Mbase) among patients with a mutation in their MMR genes (n = 4) versus patients with hypermethylation of their MMR genes (n = 6) and showing the mutations per Mbase among patients with a MPR/pPR (n = 5) versus patients with NR (n = 5). e, Analysis of (potentially) pathogenic variants using TSO500, represented in an oncoprint format (n = 10). Mutations are visually differentiated by type, with the frequency of mutations per gene and per patient depicted. Source data are provided as a Source Data file. Abbreviations: G1,2,3 grade, MMRd mismatch repair deficiency, MPR major pathological response, pPR partial pathological response, NR non-responders.
Fig. 3
Fig. 3. Immunologic predictors and correlates of response to ICB.
a Representative H&E, CD3, CD8, and CD19 staining images of pre- (top) and post-treatment biopsy tissue (bottom) from PAM-004. Similar experiments conducted for all 10 patients. b Pre- to post-treatment changes in CD3+, CD8+, CD19+ densities in patients with a radiologic partial response (PR) (n = 3) and patients with stable disease (SD) on MRI (n = 5). Statistical significance was assessed using a mixed-effects model. c Pre- to post-treatment changes in CD3+, CD8+, CD19+ densities in patients with a pathologic response (pPR and MPR) (n = 5) and patients without a pathologic response (Non-pPR) (n = 5). Statistical significance was assessed using a mixed-effects model. d Heatmap of included patients with data on pathologic and radiologic response, location of immune infiltrate, TLS, and CD3+, CD8+ and CD19+ densities. Clustering of CD3+, CD8+ and CD19+ densities stratified by location was done by hierarchical clustering using Ward’s method. Source data are provided as a Source Data file. MPR major pathological response, pPR partial pathological response, PR partial response, SD stable disease, TLS tertiary lymphoid structure.
Fig. 4
Fig. 4. Single-cell expression and bulk TCR analysis of resected tumours from patients treated with neoadjuvant ICB.
a Paired dot plot of bulk TCR CDR3 sequencing from pre- and post-treatment biopsy tissues (n = 8). Individual patients are annotated by their pathologic and radiologic response. b Heatmap showing correlation between TCR CDR3 sequences in post-treatment biopsies and resection specimens (n = 6), corresponding to those used for IHC in Fig. 3. c UMAP visualization of 11,870 T cells with identical CDR3 TCRs present in bulk TCR sequencing data from the same patient. Clusters are colour-coded by inferred identity. d Bubble plot showing expression and abundance of key canonical marker genes for T cell clusters. e Bar graph of cell subset fractions within significantly expanded and non-expanded populations as determined by bulk TCR sequencing. f Bar graph of clone sizes within expanded and non-expanded populations from bulk TCR sequencing. g UMAP visualization of 199 significantly expanded CD4 T cells, colour-coded by inferred identity. h Circle plot showing shared full-length TCR sequences between significantly expanded CD4 T cells from different clusters. i UMAP visualization of 3014 CD8 T cells with significantly expanded CDR3 TCRs from pre- vs post-treatment bulk TCR sequencing. Clusters are colour-coded by inferred identity. j Bubble plot of marker gene expression and abundance differentially expressed among CD8 T cell subsets. k Scatter plot showing clonal diversity as a function of clone size for significantly expanded CD8 T cells, colour-coded by most abundant cluster. l Bar graph of cell subset fractions within the most abundant ( > 10 identical TCRs) expanded CD8 T cell clones, with each bar representing an individual clone. m Bar graph showing inferred identity of cycling T cells within individual expanded CD8 T cell clones, with each bar representing cycling T cells from an individual clone. Abbreviations: MPR major pathological response, pPR partial pathological response, PR partial response, SD stable disease. Source data are provided as a Source Data file.
Fig. 5
Fig. 5. Single-cell expression and bulk TCR analysis of T cell clones shared between tumour and draining (sentinel) lymph nodes.
a Scatter plot of bulk TCR CDR3 sequencing from patients with post-treatment biopsy and TDLN tissue (n = 5). Significantly expanded clones (pre- vs post-treatment bulk TCR sequencing) are highlighted in orange. Dot size represents BH-adjusted P-value for ICB-induced clonal expansion. Patients are annotated by pathological and radiological response. b Projection of significantly expanded CD8 T cells onto the global T cell UMAP, colour-coded by inferred CD8 T cell identity. Non-expanded CD8 and CD4 T cells are shown in grey. c Left: UMAP of 2910 T cells with identical CDR3 TCRs in bulk TCR sequencing from at least one TDLN of the same patient. Clusters are colour-coded by inferred identity. T cell clones not detected in any TDLN are shown in grey. Right: Bar graph showing the fraction of indicated cell subsets within clones detected or not detected in a TDLN by bulk TCR CDR3 sequencing. d UMAP visualization of 2910 T cells with identical CDR3 TCRs in bulk TCR sequencing data from the same patient. Cells from a given T cell clone are colour-coded by their relative frequency in the TDLN. T cell clones not detected in any TDLN are shown in grey. e UMAP of 519 T cells from patient PAM-007 with identical CDR3 TCRs in bulk TCR sequencing. T cell clones are colour-coded by CDR3 sequence. Left: Clones in ‘left’ sentinel TDLN. Middle: Clones in ‘right’ sentinel TDLN. Right: Clones in both TDLNs. f Venn diagram showing overlap of T cell clones in 3 sentinel TDLNs from patient PAM-004. g Venn diagram showing overlap of T cell clones in 4 TDLNs from the Obturator station of patient PAM-004. h Alluvial plot showing distribution of significantly expanded T cell clones from patient PAM-004 across post-treatment biopsy and indicated (sentinel) TDLNs. Source data are provided as a Source Data file. Abbreviations: BH Benjamini–Hochberg, MPR major pathological response, pPR partial pathological response, PR partial response, SD stable disease, TDLN tumour-draining lymph node, SLN sentinel lymph node.
Fig. 6
Fig. 6. Comparison of T and tumour cell gene signatures by spatial transcriptomics in MMRd vs. subclonal MMRp regions post-neoadjuvant ICB.
a Representative H&E image of PAM-004 hysterectomy sample showing MPR after two ICB cycles (n = 1). b CD3 staining on PAM-004 hysterectomy sample. c MLH1 staining on PAM-004 hysterectomy sample showing MMRp (left) and fibrotic tumour bed (FTB) (right) regions (n = 1). d Fluorescent staining of PAM-004 hysterectomy sample: CD3 (red/orange), CD20 (yellow), DNA (green), PanCK (blue) (n = 1). e Spatial transcriptomics of PAM-004 hysterectomy sample with ROIs: ROI005, ROI001, ROI003 in MMRp (left) and ROI006, ROI002, ROI004 in FTB. f,g Images of ROI006 in FTB (upper row) and ROI005 in MMRp (upper row): f CD3 mask for T cells (orange), g PanCK mask for tumour cells (blue). h Representative H&E image of pretreatment biopsy from PAM-004 (n = 1). i Fluorescent staining of PAM-004 pretreatment biopsy: ROIs ROI008, ROI013, ROI007, ROI009. CD3 (red/orange), CD20 (yellow), DNA (green), PanCK (blue) (n = 1). j Image of ROI009 with CD3 mask for T cells (orange). k,l Volcano plots comparing gene signatures in T cell areas (CD3 mask) of pretreatment biopsy vs. hysterectomy sample from FTB or MMRp regions. Blue dots: genes enriched in pretreatment biopsy. Orange dots: genes enriched in FTB or MMRp hysterectomy sample. Differential expression analysis was done using a linear mixed model with fixed effects for condition and random effects for subject-specific variability. P-values adjusted by Benjamini–Hochberg procedure. m Volcano plot comparing gene signatures in T cell areas (CD3 mask) within FTB vs. MMRp regions of hysterectomy sample. Blue dots: genes enriched in FTB region. Differential expression analysis was done using a linear mixed model with fixed effects for condition and random effects for subject-specific variability. P-values adjusted by Benjamini–Hochberg procedure. n Scatter plot of genes expressed in MLH1+ cells within tumour cell areas (PanCK mask) of FTB vs. MMRp region. Source data are provided as a source data file. Abbreviations: FTB fibrotic tumour bed, MMRp mismatch repair proficient. Source data provided as a Source Data file.

References

    1. Crosbie, E. J. et al. Seminar Endometrial Cancer. www.thelancet.com vol. 399 (1995).
    1. Sung, H. et al. Global Cancer Statistics 2020: GLOBOCAN estimates of incidence and mortality worldwide for 36 cancers in 185 countries. CA Cancer J. Clin.71, 209–249 (2021). 10.3322/caac.21660 - DOI - PubMed
    1. Nout, R. A. et al. Five-year quality of life of endometrial cancer patients treated in the randomised Post Operative Radiation Therapy in Endometrial Cancer (PORTEC-2) trial and comparison with norm data. Eur. J. Cancer48, 1638–1648 (2012). 10.1016/j.ejca.2011.11.014 - DOI - PubMed
    1. Chalabi, M. et al. Neoadjuvant immunotherapy leads to pathological responses in MMR-proficient and MMR-deficient early-stage colon cancers. Nat. Med. 202026, 566–576 (2020). - PubMed
    1. O'Malley, D.M. et al. Pembrolizumab in patients with microsatellite instability-high advanced endometrial cancer: results from the KEYNOTE-158 study. J. Clin. Oncol.40, 752–761 (2022). - PMC - PubMed

Publication types

Substances

Associated data

LinkOut - more resources