. 2024 Sep 3;15(1):7626.
doi: 10.1038/s41467-024-51763-2.

Discovery of an unconventional lamprey lymphocyte lineage highlights divergent features in vertebrate adaptive immune system evolution

Affiliations

Discovery of an unconventional lamprey lymphocyte lineage highlights divergent features in vertebrate adaptive immune system evolution

Yingyi Huang et al. Nat Commun. .

Abstract

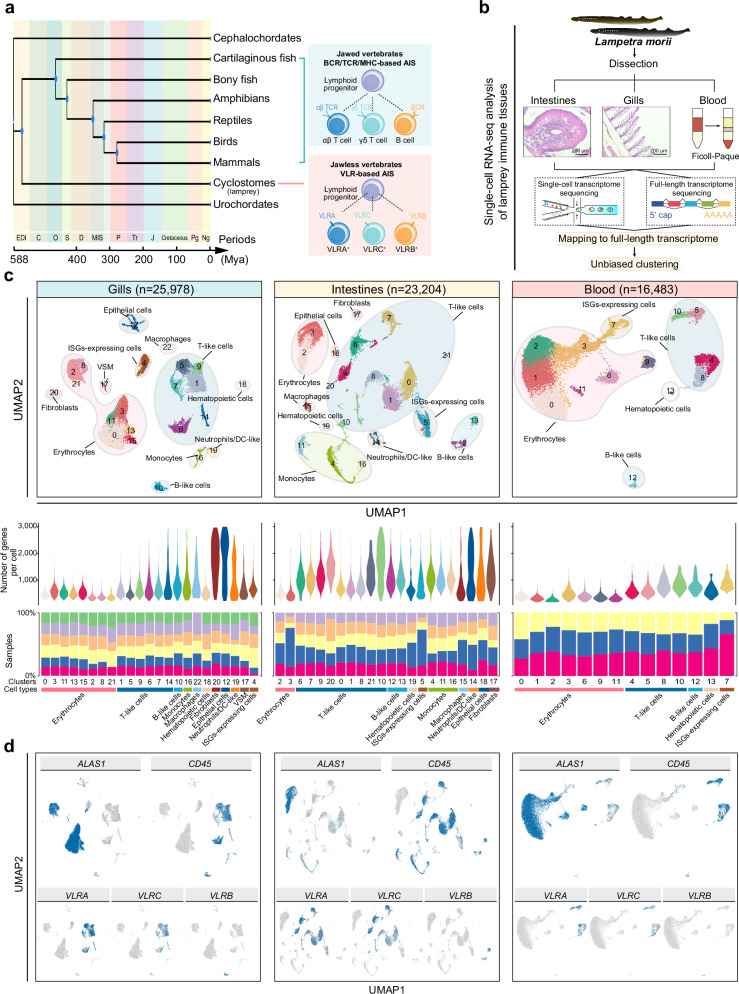
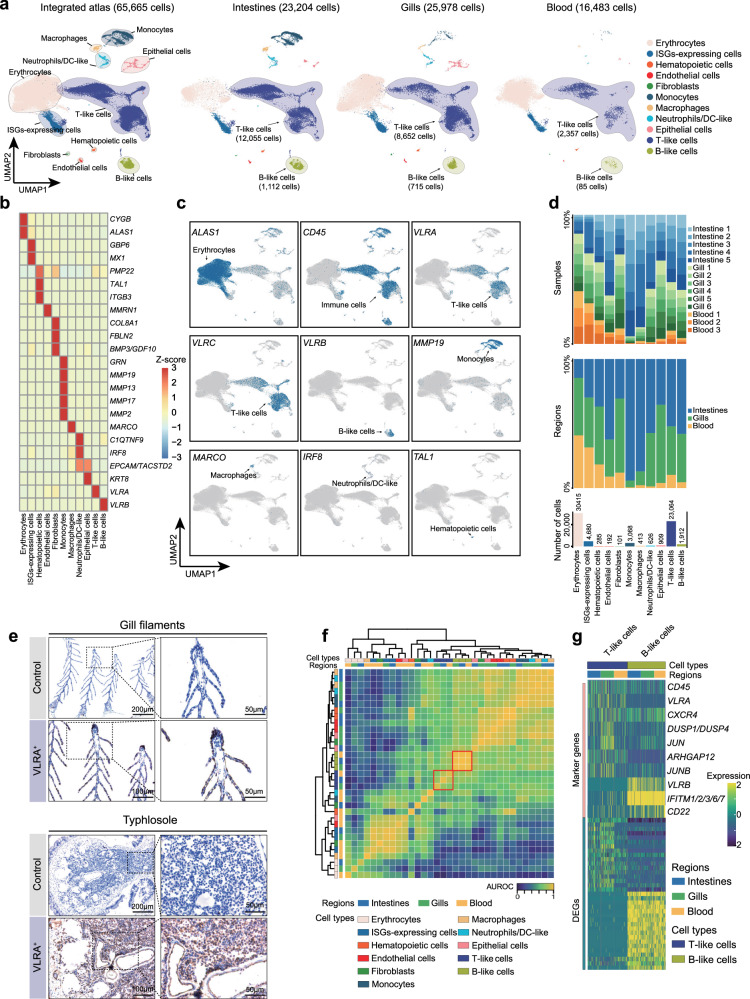
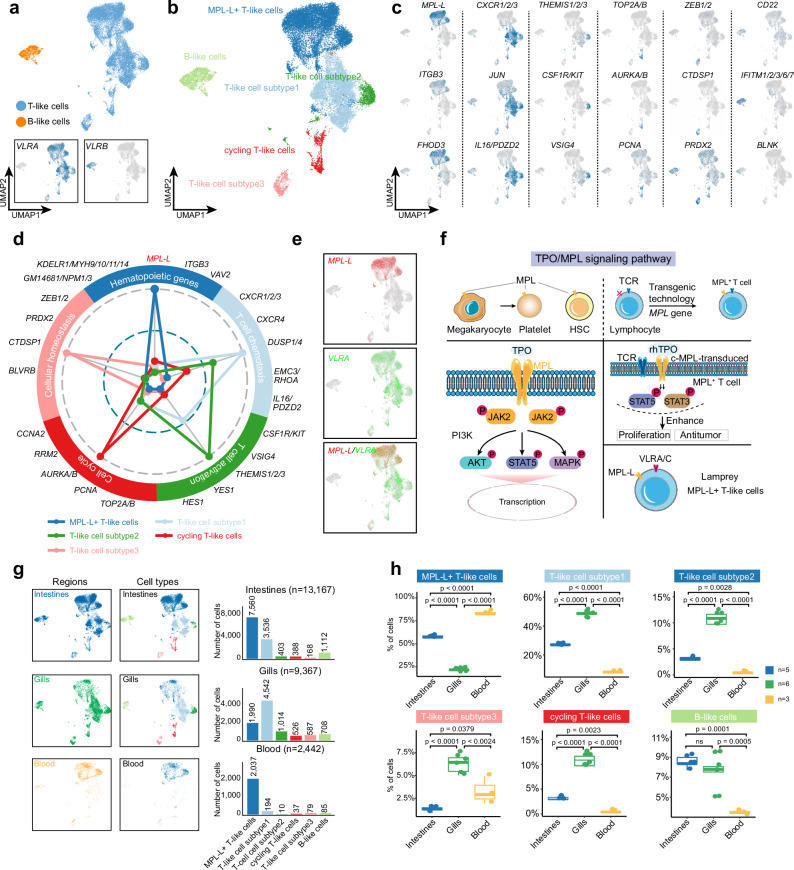
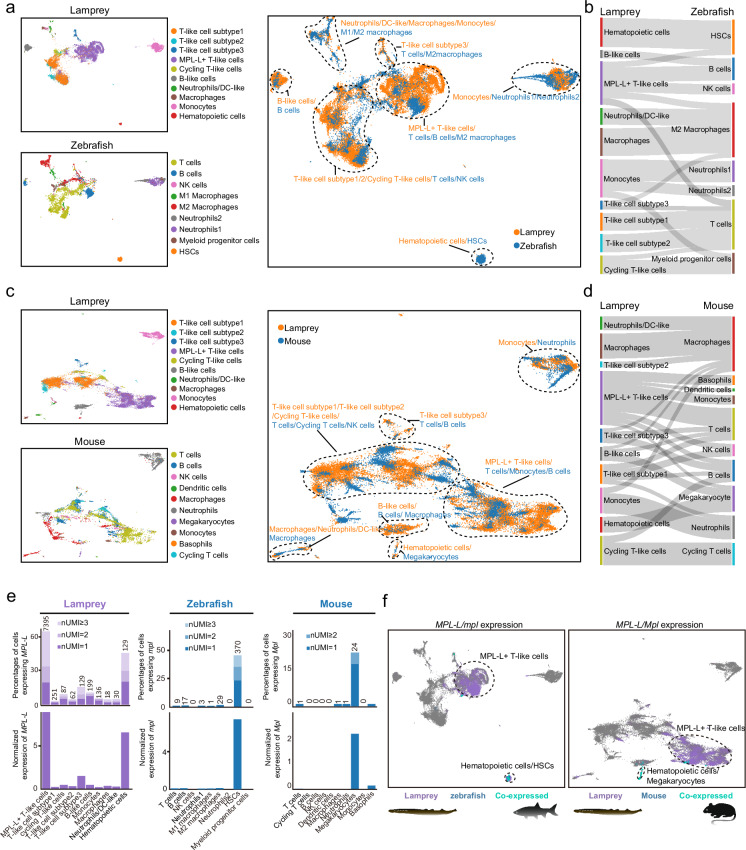
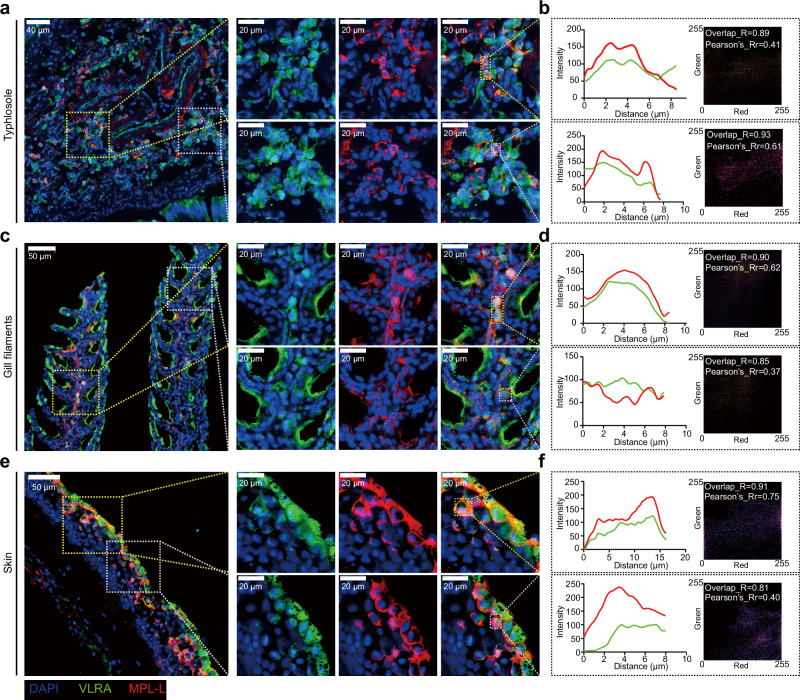
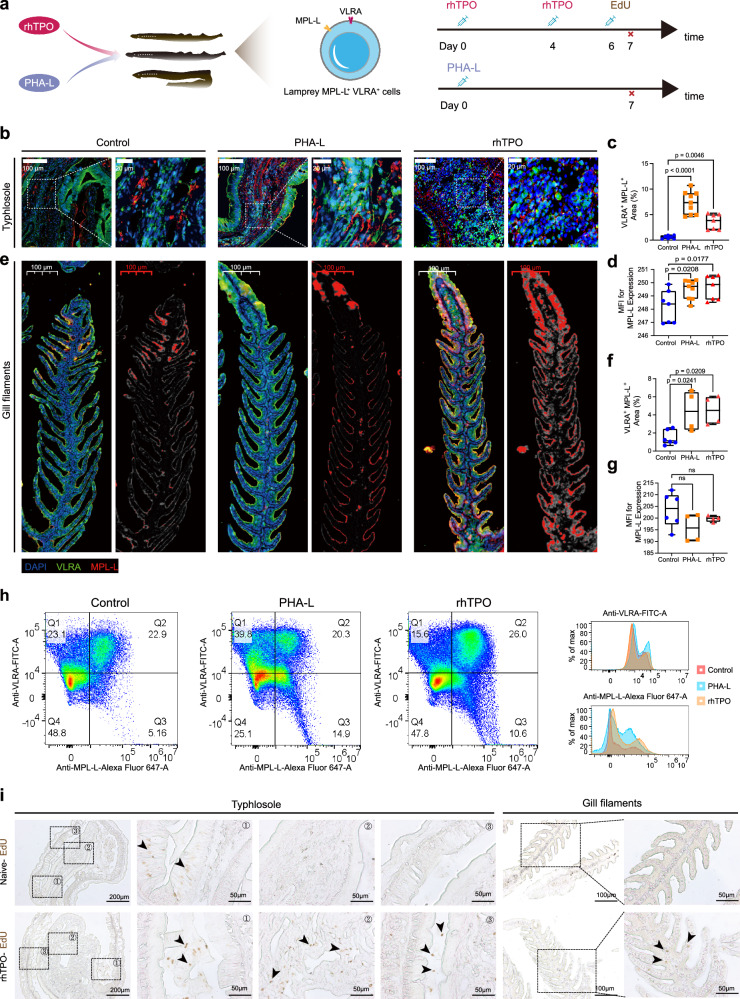
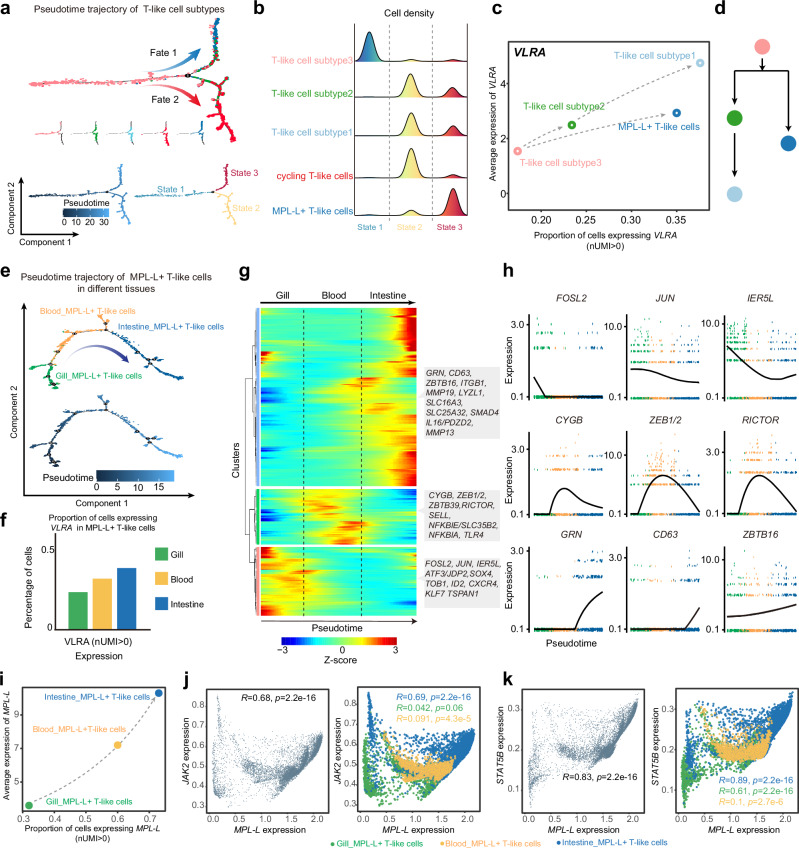
Lymphocyte receptors independently evolved in both jawed and jawless vertebrates with similar adaptive immune responses. However, the diversity of functional subtypes and molecular architecture in jawless vertebrate lymphocytes, comparable to jawed species, is not well defined. Here, we profile the gills, intestines, and blood of the lamprey, Lampetra morii, with single-cell RNA sequencing, using a full-length transcriptome as a reference. Our findings reveal higher tissue-specific heterogeneity among T-like cells in contrast to B-like cells. Notably, we identify a unique T-like cell subtype expressing a homolog of the nonlymphoid hematopoietic growth factor receptor, MPL-like (MPL-L). These MPL-L+ T-like cells exhibit features distinct from T cells of jawed vertebrates, particularly in their elevated expression of hematopoietic genes. We further discovered that MPL-L+ VLRA+ T-like cells are widely present in the typhlosole, gill, liver, kidney, and skin of lamprey and they proliferate in response to both a T cell mitogen and recombinant human thrombopoietin. These findings provide new insights into the adaptive immune response in jawless vertebrates, shedding new light on the evolution of adaptive immunity.


Conflict of interest statement

The authors declare no competing interests.

Figures

Fig. 1
Fig. 1. Transcriptional characterization of the gill, intestinal, and blood atlases in L. morii larvae.
a Jawless vertebrates phylogenetic position and their unique adaptive immune system. b Schematic diagram of the experimental design for the full-length transcriptome and scRNA-sequencing. c UMAP of the three tissue types in L. morii larvae, including gills, intestines, and blood. The different colors in the picture represent different cell types. Violin plots in the middle show the gene number of each cell type. The bottom bar plot shows the distribution of each cell type in each sample. The different colors in the picture indicate the different samples. The color of the abscissa represents different cell categories. Dendritic cell like, DC-like; vascular smooth muscle cell, VSM. d Feature plots of the differential expression of ALAS1, CD45, VLRA, VLRC, and VLRB in the atlases. The lamprey gene symbols in this study are indicated by mouse orthologue names.
Fig. 2
Fig. 2. Integrative transcriptome profiling of gill, intestinal, and blood atlases.
a UMAP visualization of cell type distribution after integration of the gill, blood, and intestinal atlases. The color annotation indicates each cell type annotated. b Heatmap of selected marker genes across various cell types. c Feature plot of selected marker genes across various cell types. d The top bar plot shows the distribution of all cell types in each sample. The color annotation indicates various samples. The bar plot in the middle shows the distribution of all cell types in three tissues. The bottom bar plot shows the cell numbers of each cell type. e Immunohistochemistry examinations of the gill filaments and typhlosoles. Numerous VLRA+ cells from the gill filaments and typhlosoles were well recognized by anti-VLRA pAb with experiments performed at least three times. f Heatmap showing the similarity of multiple cell types in three organs/tissues. The color of the outermost rectangles indicates various cell types. The color of rectangles on the second floor indicates gill, blood, or intestine. The brighter color in the picture, the higher AUROC value is. The AUROC value is proportional to the cell correlation. T-like cells and B-like cells are indicated in the red box. g Heatmap of the marker genes and top 20 DEGs in T-like cells and B-like cells across three tissues.
Fig. 3
Fig. 3. Transcriptional characterization and distribution of lymphoid cell subpopulations.
a UMAP visualization shows the distribution of T-like cells and B-like cells after reintegration. b UMAP visualization shows the lymphoid cell subpopulation distribution after annotation. c Feature plot of selected marker genes across various lymphoid cell subpopulations. d Radar chart shows the genes selected in the enrichment pathway of different lymphoid cell subpopulations. The farther each dot is from the center position, the higher the expression value is. e Feature plot of the MPL-L and VLRA gene co-expression. f Schematic diagram depicting the involvement of the TPO/MPL signaling pathway in the biological processes of jawed vertebrates and the expression of the MPL-L gene in lamprey T-like cells. g UMAP shows the lymphoid cell subpopulation distribution in the three tissue types. The bar plot shows the number of cells in each lymphoid cell subpopulation in three tissue types. h The proportion of each lymphoid cell subpopulation in the three tissue types. The dot indicates multiple tissue samples. The box plot displays the minima, maxima, central tendency, quartile ranges, and whiskers of the data. The data presented are based on a minimum of three biological replicates per organ type: intestines (n = 5), gills (n = 6), and blood (n = 3). Statistical significance was determined using one-way ANOVA with a one-sided test approach and Tukey’s adjustment was made for multiple comparisons.
Fig. 4
Fig. 4. Cross-species analysis between L. morii and zebrafish/mouse.
a Left: UMAP of lamprey and zebrafish immune cells; right: UMAP of the combined lamprey (orange) and zebrafish (blue) manifolds, with cell types circled. b Sankey plot summarizing the lamprey - zebrafish cell types mappings. Ignore edges with alignment scores < 0.1. c Left: UMAP of lamprey and mouse immune cells; right: UMAP of the combined lamprey (orange) and mouse (blue) manifolds, with cell types circled. d Sankey plot summarizing the lamprey - mouse cell types mappings. Ignore edges with alignment scores < 0.1. e Bar plot displays the proportion of cells expressing MPL-L/mpl/Mpl and the normalized expression of the MPL-L/mpl/Mpl gene in various cell types of L. morii, zebrafish, and mouse. f Expression of the MPL-L/mpl/Mpl homologous gene pairs between L. morii (purple) and zebrafish/mouse (blue) linked by SAMap is shown on the combined UMAP projection. Cells that highly express the MPL-L gene are highlighted with circles. Cells mapped together are labeled cyan.
Fig. 5
Fig. 5. Double-stained immunofluorescence examination of MPL-L+ VLRA+ cells.
a Double-stained immunofluorescence examination of MPL-L and VLRA in MPL-L+ VLRA+ cells in the typhlosole with experiments performed at least three times. Green fluorescence is associated with anti-VLRA pAb, and red fluorescence is associated with anti-MPL-L pAb. b Left: The intensity trajectory line charts are drawn by selecting two immunofluorescence colocalization regions in the typhlosole. The green line indicates anti-VLRA pAb and the red line represents anti-MPL-L pAb. Right: Scatterplot displays correlations of anti-VLRA pAb with anti-MPL-L pAb colocalization in the typhlosole. c Double-stained immunofluorescence examination of MPL-L and VLRA in MPL-L+ VLRA+ cells in the gill filaments with experiments performed at least three times. d Left: The intensity trajectory line charts are drawn by selecting two immunofluorescence colocalization regions in the gill filaments; right: Scatterplot displays correlations of anti-VLRA pAb with anti-MPL-L pAb colocalization in the gill filaments. e Double-stained immunofluorescence examination of MPL-L and VLRA in MPL-L+ VLRA+ cells in the skin with experiments performed at least three times. f Left: The intensity trajectory line charts are drawn by selecting two immunofluorescence colocalization regions in the skin. Right: Scatterplot displays correlations of anti-VLRA pAb with anti-MPL-L pAb colocalization in the skin.
Fig. 6
Fig. 6. Stimulation by the recombinant human TPO (rhTPO) and phytohemagglutinin-L (PHA-L) leads to the proliferation of MPL-L+ VLRA+ cells.
a Time points for injection with rhTPO, PHA-L, and the 5-Ethynyl-2’-deoxyuridine (EdU). b Representative sections revealing the number and location of MPL-L+ VLRA+ cells in the typhlosole after injection, as determined by double-stained immunofluorescence examination. Green fluorescence is associated with anti-VLRA pAb, and red fluorescence is associated with anti-MPL-L pAb. c, d Box plot shows the proportion of MPL-L+ VLRA+ cells and the mean fluorescence intensity (MFI) of MPL-L within the typhlosoles across varying experimental conditions. The data presented are based on a minimum of three biological replicates per experimental sample: Control (n = 7), PHA-L (n = 9), and rhTPO (n = 7). Statistical significance was determined using one-way ANOVA with a one-sided test approach and Tukey’s adjustment was made for multiple comparisons. e Representative sections revealing the number and location of MPL-L+ VLRA+ cells in the gill filaments after injection, as determined by double-stained immunofluorescence examination. f-g Box plot shows the proportion of MPL-L+ VLRA+ cells and the MFI of MPL-L within the gill filaments across varying experimental conditions. The data presented are based on a minimum of three biological replicates per experimental sample: Control (n = 6), PHA-L (n = 4), and rhTPO (n = 4). Statistical significance was determined using one-way ANOVA with a one-sided test approach and Tukey’s adjustment was made for multiple comparisons. h Flow cytometric analysis of MPL-L + VLRA+ cells before and after PHA-L and rhTPO immunostimulation. i Representative sections reveal the number and location of proliferating cells (EdU, brown) in the typhlosoles and gill filaments after the injection of rhTPO with experiments performed at least three times. Arrows indicate the characteristic proliferating cells.
Fig. 7
Fig. 7. Analysis of MPL-L+ T-like cell transition states.
a Developmental pseudotime trajectory of five T-like cell subpopulations. 2D pseudotime plot showing the dynamics of five T-like cell subpopulations (upper panel). The color indicates the differentiation degree of the five cell types (lower left panel). The deeper color indicates the early state. The color of the bottom right figure shows three branches of those states (lower right panel). b The ridge plot shows the distribution of cell density by five T-like cell subpopulations during the transition (divided into 3 states), along with the pseudotime. c The figure shows the change in VLRA gene expression in five T-like cell subpopulations over pseudotime with cell proportion expressing VLRA on the x-axis and its average expression on the y-axis. d The diagram shows the cell transitions of T-like cell subpopulations along with the pseudotime. e Developmental pseudotime trajectory of MPL-L+ T-like cells across gills, blood, and intestines with the top figure color-coded by tissue and the bottom by differentiation level. f Bar plot displays the proportion of cells that expressed the VLRA gene (nUMI > 0) in MPL-L+ T-like cells of gills, blood, and intestines. g Heatmap of gene expression arranged along the pseudotime trajectory. h Pseudotime plots of selected genes. i The figure shows the change in MPL-L gene expression in MPL-L+ T-like cells in three tissue types over pseudotime with cell proportion expressing MPL-L on the x-axis and its average expression on the y-axis. j Scatterplot on the left displays correlations of MPL-L expression with JAK2 expression in MPL-L+ T-like cells. The scatterplot on the right displays correlations of MPL-L expression with JAK2 expression in MPL-L+ T-like cells across gills, blood, and intestines. For correlation analysis, gene expression data were imputed by MAGIC. Utilizing Spearman’s rank correlation coefficient to measure the strength and direction of the association between the two variables. The statistical test used was two-sided. k Scatterplot on the left displays correlations of MPL-L expression with STAT5B expression in MPL-L+ T-like cells. The scatterplot on the left displays correlations of MPL-L expression with STAT5B expression in MPL-L+ T-like cells across gills, blood, and intestines.

Similar articles

Cited by

References

    1. Bernstein, R. M., Schluter, S. F., Bernstein, H. & Marchalonis, J. J. Primordial emergence of the recombination activating gene 1 (RAG1): sequence of the complete shark gene indicates homology to microbial integrases. Proc. Natl Acad. Sci. USA93, 9454–9459 (1996). 10.1073/pnas.93.18.9454 - DOI - PMC - PubMed
    1. Agrawal, A., Eastman, Q. M. & Schatz, D. G. Transposition mediated by RAG1 and RAG2 and its implications for the evolution of the immune system. Nature394, 744–751 (1998). 10.1038/29457 - DOI - PubMed
    1. Mayer, W. E. et al. Isolation and characterization of lymphocyte-like cells from a lamprey. Proc. Natl Acad. Sci. USA99, 14350–14355 (2002). 10.1073/pnas.212527499 - DOI - PMC - PubMed
    1. Alder, M. N. et al. Diversity and function of adaptive immune receptors in a jawless vertebrate. Science310, 1970–1973 (2005). 10.1126/science.1119420 - DOI - PubMed
    1. Boehm, T. et al. Evolution of alternative adaptive immune systems in vertebrates. Annu. Rev. Immunol.36, 19–42 (2018). 10.1146/annurev-immunol-042617-053028 - DOI - PubMed

Publication types

LinkOut - more resources