. 2024 Sep 3;15(1):7675.
doi: 10.1038/s41467-024-52032-y.

Androgen receptor monomers and dimers regulate opposing biological processes in prostate cancer cells

Affiliations

Androgen receptor monomers and dimers regulate opposing biological processes in prostate cancer cells

Rachid Safi et al. Nat Commun. .

Abstract

Most prostate cancers express the androgen receptor (AR), and tumor growth and progression are facilitated by exceptionally low levels of systemic or intratumorally produced androgens. Thus, absolute inhibition of the androgen signaling axis remains the goal of current therapeutic approaches to treat prostate cancer (PCa). Paradoxically, high dose androgens also exhibit considerable efficacy as a treatment modality in patients with late-stage metastatic PCa. Here we show that low levels of androgens, functioning through an AR monomer, facilitate a non-genomic activation of the mTOR signaling pathway to drive proliferation. Conversely, high dose androgens facilitate the formation of AR dimers/oligomers to suppress c-MYC expression, inhibit proliferation and drive a transcriptional program associated with a differentiated phenotype. These findings highlight the inherent liabilities in current approaches used to inhibit AR action in PCa and are instructive as to strategies that can be used to develop new therapeutics for this disease and other androgenopathies.


Conflict of interest statement

The authors declare no competing interests.

Figures

Fig. 1
Fig. 1. Prostate cancer cells respond differently to different doses of androgens.
LNCaP (a) or VCaP (b) cells plated in media containing charcoal-stripped serum (CFS) or full-serum (FBS) (c, d) were treated with increasing concentrations of R1881. Cell growth was assessed by DNA quantification at day 7. Data are shown as mean ± SD as representative results from three independent experiments, n = 3 wells of cells. RFU relative fluorescence units. Castrated male NSG mice bearing subcutaneous LNCaP tumors were administered increasing doses of testosterone in (e) (Placebo, n = 10 mice; 0.5 mg/kg/d, n = 9 mice; 1 mg/kg/d, n = 10 mice; 2 mg/kg/d, n = 10 mice; 4 mg/kg/d, n = 9 mice; 8 mg/kg/d, n = 9 mice) or DHT in (f) Placebo, n = 10; 0.1 mg/kg/d, n = 10 mice; 0.2 mg/kg/d, n = 10 mice; 0.4 mg/kg/d, n = 10 mice; 0.8 mg/kg/d, n = 10 mice. Data are shown as mean ± SD. p values were determined by two-way ANOVA followed by Tukey’s multiple comparison test (P < 0.0001 for (e) and P < 0.0004 for (f)). g Significant Hallmark pathways of selected Gene Set Enrichment Analysis (GSEA) differentially regulated in VCaP cells in response to low (0.06 nM R1881) as compared to high dose (R1881 10 nM) androgens are represented (FDR q value < 0.001; NES normalized enrichment score). NES < 0 represents downregulation of specified pathway in LD vs HD. NES > 0 represents upregulation of specified pathway in LD vs HD. h VCaP cells plated in CFS-supplemented media were treated with increasing concentrations of R1881 for 24 h. The mRNA expression for PSA and E2F1 were assessed using qRT-PCR. Data are shown as mean ± SD as representative results from three independent experiments, n = 3 technical replicates. i Heatmap presentation of gene expression as assessed using the Nanostring nCounter platform from VCaP cells treated in CFS-supplemented media with either vehicle (Veh), LD or HD R1881. j VCaP cells plated in media supplemented with CFS were treated with increasing concentrations of either R1881, Testosterone (T) or Dihydrotestosterone (DHT) for 48 h. Whole cell extracts were probed for RB1 phosphorylation (pRB), E2F1, FOXM1, PSA or β-Actin using western blot. Representative images are shown from n = 3 biologically independent experiments. Source data are provided as a Source Data file.
Fig. 2
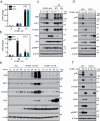
Fig. 2. Low dose androgen biology is not driven by the canonical transcriptional activity ascribed to AR.
Heatmap of ATAC-seq signal within a 6 kb window of all high-confidence differentially accessible peaks identified in response to indicated androgen dose compared to vehicle treated VCaP (a) or LNCaP (b) cells. Differentially accessible peaks were subdivided based on whether they are significantly increased (VCaP Up or LNCaP Up) or significantly decreased (VCaP down or LNCaP down). Quantification of unique and common high-confidence differentially accessible peaks identified in response to indicated androgen dose compared to vehicle treated VCaP (c) or LNCaP (d) cells. e Representative genomic tracks of ATAC-seq sites within classical AR regulated genes (i.e., KLK3, FKBP5 and STEAP4) or LD regulated genes (i.e., E2F1, CDC6 and FOXM1) in response to vehicle (0) or increasing androgens in VCaP cells.
Fig. 3
Fig. 3. Low-dose androgen does not promote AR binding to chromatin.
Heatmap of ChIP-seq signal within a 6 kb window of all high-confidence differentially accessible peaks identified in response to high dose (HD) and low dose (LD) androgen compared to vehicle treated VCaP (a) or LNCaP (b) cells. Differentially accessible peaks were subdivided based on whether they are significantly increased (VCaP Up or LNCaP Up) or decreased (VCaP down or LNCaP down). Quantification of unique and common high-confidence differentially accessible peaks identified in response to androgen dose compared to vehicle treated VCaP (c) or LNCaP (d) cells. e Representative genomic tracks of AR binding sites within HD- (KLK3, FKBP5 and STEAP4) or LD- androgen regulated genes (i.e., E2F1, CDC6 and FOXM1) in response to vehicle (0) or increasing androgen concentrations in VCaP cells.
Fig. 4
Fig. 4. Low dose androgens do not facilitate receptor dimerization.
a VCaP cells were plated in CFS-supplemented media for 2 days followed by treatment with increasing concentrations of R1881, DHT or Testosterone (T). Cell growth was assessed by DNA quantification at day 7. Data are shown as mean ± SD of representative results from three independent experiments, n = 3 wells of cells. RFU: relative fluorescence units. b Schematic of the NanoBiT-based assay used to evaluate wtAR dimerization. c HEK293 cells were transfected in CFS-supplemented media with plasmids expressing full-length AR fused to the small- (SmBiT AR) and large-bit (LgBiT AR) of Nanoluciferase. 48 h later, cells were treated with increasing concentrations of R1881, DHT or testosterone (T) and at the same time Nanoluciferase reagent was added and light emission measured using a plate reader. Data are plotted as mean ± SD of representative results from four independent experiments, n = 3 wells of cells. RLU relative light units. Source data are provided as a Source Data file.
Fig. 5
Fig. 5. Identification of AR modulators that mimic LD androgen biology.
a Chemical structures for RU486 and RTI001. HEK293 cells were transfected in CFS-supplemented media with plasmids expressing AR fused to SmBiT or LgBiT. 48 h later, cells were treated with increasing concentrations of RU486 (b) or RTI001 (c) and compared to 10 nM R1881, at the time Nanoluciferase reagent was added, and read on plate reader. Data are shown as mean ± SD of a representative results from three independent experiments, n = 3 wells of cells. RLU: Relative Light Units. VCaP cells were plated in CFS media for 2 days and treated with increasing concentrations of RU486 (d) or RTI001 (e) alone or in the presence of Enzalutamide (Enz) or a PROTAC AR degrader and compared to LD R1881 (0.06 nM). Cell growth was assessed by DNA quantification at day 7. Data are plotted as mean ± SD of representative results from three independent experiments. n = 3 wells of cells. RFU relative fluorescent units. VCaP cells were plated in CFS-supplemented media for 2 days and treated with increasing concentrations of R1881, RU486 or RTI001 for an additional 24 h. The mRNA expression for PSA (f) and E2F1 (g) were assessed using qRT-PCR. Data are shown as mean ± SD as representative results from three independent experiments, n = 3 technical replicates. h VCaP cells were plated in CFS-supplemented media for 2 days and treated with either vehicle or indicated concentrations of R1881, RTI001 or RU486 for an additional 48 h. Whole cell extracts were probed for RB phosphorylation (pRB), E2F1, FOXM1, PSA, or β-Actin. Representative images are shown from n = 2 independent experiments. Source data are provided as a Source Data file.
Fig. 6
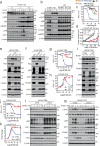
Fig. 6. AR regulated proliferation is mTOR dependent.
VCaP cells were plated in media supplemented with CFS for 2 days and treated for an additional 48 h with indicated concentrations of R1881 alone or in combination with cycloheximide (CHX). The mRNA expression for PSA (a) and E2F1 (b) were assessed using qRT-PCR. Data are shown as mean ± SD as representative results from three independent experiments, n = 3 technical replicates. c VCaP cells were plated in CFS-supplemented media for 2 days and treated with either vehicle or indicated concentrations of R1881, RTI001 or RU486 for an additional 48 h. Whole cell extracts were probed for RB phosphorylation (pRB), E2F1, FOXM1, PSA, phospho-S6 ribosomal protein (pS6), phospho 4EBP1 (p4EBP1) or β-Actin using western blot. d VCaP cells were treated with indicated concentrations of R1881 alone or in combination with cycloheximide (CHX) for an additional 24 h. Whole cell extracts were probed for RB phosphorylation (pRB), E2F1, FOXM1, PSA, phospho-p70 S6 Kinase (pS6K), phospho-S6 ribosomal protein (pS6), phospho 4EBP1 (p4EBP1) or β-Actin using western blot. e VCaP cells were treated with either vehicle or R1881 (0.06 nM or 10 nM) for indicated time. Whole cell extracts were probed for RB phosphorylation (pRB), E2F1, FOXM1, PSA, phospho-S6 ribosomal protein (pS6), or β-Actin using western blot. f VCaP cells were plated in media supplemented with CFS for 2 days and treated with indicated concentrations of R1881 alone (Veh) or in the presence of 100 nM Torin2 for 48 h. Whole cell extracts were probed for RB phosphorylation (pRB), E2F1, FOXM1, PSA, phospho-p70 S6 Kinase (pS6K), phospho-S6 ribosomal protein (pS6), phospho 4EBP1 (p4EBP1) or β-Actin using western blot. For cf, representative images are shown from n = 3 independent experiments. Source data are provided as a Source Data file.
Fig. 7
Fig. 7. HD dose androgens, but not AR antagonists, inhibit c-MYC expression.
a VCaP cells grown in CFS-supplemented media were treated with vehicle, 0.1 or 10 nM R1881 for indicated time. b VCaP cells in CFS-supplemented media were treated with vehicle or R1881, RU486 or RTI001 as indicated. Whole cell extracts (WCE) were probed for pRB, E2F1, FOXM1, pS6K, pS6, p4EBP1, PSA, and β-Actin. c LNCaP cells in FBS-supplemented media were treated with increasing concentrations of either R1881 or AR antagonists. Bic: Bicalutamide, Enz: Enzalutamide or an AR degrader (PROTAC). d Castrated male NSG mice bearing LNCaP-AR tumors were administered either Vehicle (Veh, n = 12 mice), testosterone (T, n = 11 mice) or Enzalutamide (Enz, n = 11 mice). Data are plotted as mean ± SD and p values determined by two-way ANOVA followed by Tukey’s multiple comparison test (P < 0.0001). LNCaP (e) or VCaP (f) cells in FBS-supplemented media were treated for 48 h with Vehicle (Veh), 10 nM R1881 or AR antagonists. (Enz 10μM or PROTAC 2 μM). WCE were probed for AR, PSA, pRB, E2F1, FOXM1, c-MYC or β-Actin. LNCaP control (CTRL) or HD resistant (HDr) cells in FBS- (g) or in CFS (h) -supplemented media were treated with increasing concentrations of R1881. i LNCaP control (CTRL) or HD resistant (HDr) cells grown in FBS-supplemented media were treated for 48 h. with Vehicle (-) or 10 nM R1881 (+). WCE were probed for AR, PSA, pRB, E2F1, FOXM1, c-MYC and β-Actin. LNCaP control (CTRL) or LNCaP c-MYC (c-MYC) cells were plated in FBS (j) or CFS (k) -supplemented media and treated with increasing concentrations of R1881. LNCaP control (CTRL) or LNCaP c-MYC (c-MYC) cells in FBS (l) or CFS (m) -supplemented media and treated with increasing concentrations of R1881. WCE were probed for AR, PSA, pRB, E2F1, FOXM1, c-MYC and β-Actin. For A, B, E, F, I, L and M, representative images are shown from n = 3 independent experiments. For C, G, H, J, and K, Data are shown as mean ± SD of representative results from three independent experiments, n = 3 wells of cells. RFU: Relative Fluorescence Units. Source data are provided as a Source Data file.
Fig. 8
Fig. 8. Monomeric and dimeric forms of AR manifest different biologies.
Upon binding an androgen AR undergoes a conformational change that enables its release from an inhibitory heat-shock protein complex (HSP). In the presence of castrate levels of androgens, AR fractional occupancy is low, and the receptor is predominately located in the cytoplasm as a monomer. Monomeric AR activates the mTOR signaling pathway enabling cell proliferation. As the levels of hormones increase to eugonadal levels, the fractional occupancy of AR increases and the population of dimers which partition to the nucleus rise, interact with DNA, and enhance the expression of classical AR target genes. Simultaneously, AR dimers actively repress c-MYC expression to initiate a negative feedback pathway leading to RB1 dephosphorylation and the repression of genes associated with the G1/S transition. This model also predicts that when androgens levels are low, androgen deprivation therapy (ADT) consisting of anti-androgens, or the ligands directed degraders (LDD)s will promote castration resistant neuroendocrine prostate disease. Conversely, when androgens levels are high, ADT will favor the formation of the monomeric AR and drive tumor growth.

References

    1. Davey, R. A. & Grossmann, M. Androgen receptor structure, function and biology: from bench to bedside. Clin. Biochem. Rev.37, 3–15 (2016). - PMC - PubMed
    1. Notelovitz, M. Androgen effects on bone and muscle. Fertil. Steril.77, S34–S41 (2002). 10.1016/S0015-0282(02)02968-0 - DOI - PubMed
    1. Khosla, S. & Monroe, D. G. Regulation of bone metabolism by sex steroids. Cold Spring Harb. Perspect. Med.8, a031211 (2018). 10.1101/cshperspect.a031211 - DOI - PMC - PubMed
    1. Navarro, G., Allard, C., Xu, W. & Mauvais-Jarvis, F. The role of androgens in metabolism, obesity, and diabetes in males and females. Obesity23, 713–719 (2015). 10.1002/oby.21033 - DOI - PMC - PubMed
    1. Morford, J. J., Wu, S. & Mauvais-Jarvis, F. The impact of androgen actions in neurons on metabolic health and disease. Mol. Cell Endocrinol.465, 92–102 (2018). 10.1016/j.mce.2017.09.001 - DOI - PMC - PubMed

Publication types

MeSH terms

Associated data