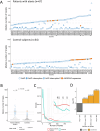
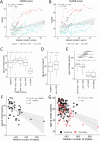
. 2024 Sep 3;15(1):7665.
doi: 10.1038/s41467-024-52148-1.

Identification and characterisation of pathogenic and non-pathogenic FGF14 repeat expansions

Affiliations

Identification and characterisation of pathogenic and non-pathogenic FGF14 repeat expansions

Lars Mohren et al. Nat Commun. .

Abstract

Repeat expansions in FGF14 cause autosomal dominant late-onset cerebellar ataxia (SCA27B) with estimated pathogenic thresholds of 250 (incomplete penetrance) and 300 AAG repeats (full penetrance), but the sequence of pathogenic and non-pathogenic expansions remains unexplored. Here, we demonstrate that STRling and ExpansionHunter accurately detect FGF14 expansions from short-read genome data using outlier approaches. By combining long-range PCR and nanopore sequencing in 169 patients with cerebellar ataxia and 802 controls, we compare FGF14 expansion alleles, including interruptions and flanking regions. Uninterrupted AAG expansions are significantly enriched in patients with ataxia from a lower threshold (180-200 repeats) than previously reported based on expansion size alone. Conversely, AAGGAG hexameric expansions are equally frequent in patients and controls. Distinct 5' flanking regions, interruptions and pre-repeat sequences correlate with repeat size. Furthermore, pure AAG (pathogenic) and AAGGAG (non-pathogenic) repeats form different secondary structures. Regardless of expansion size, SCA27B is a recognizable clinical entity characterized by frequent episodic ataxia and downbeat nystagmus, similar to the presentation observed in a family with a previously unreported nonsense variant (SCA27A). Overall, this study suggests that SCA27B is a major overlooked cause of adult-onset ataxia, accounting for 23-31% of unsolved patients. We strongly recommend re-evaluating pathogenic thresholds and integrating expansion sequencing into the molecular diagnostic process.


Conflict of interest statement

MS received consultancy honoraria from Solaxa. All other authors report no competing interests.

Figures

Fig. 1
Fig. 1. Flowchart illustrating the design of the study.
This figure visually represents the sequential steps, methods used, and distribution of participants at each stage.
Fig. 2
Fig. 2. Pedigrees of families with FGF14 pathogenic repeat expansions.
A Pedigrees of families in which at least one affected subject had a number of AAG repeats ≥ 300. B Pedigrees of families in which at least one affected subject had a repeat number comprised between 250 and 299. Black symbols indicate affected subjects examined and sampled in the study. Gray symbols indicate subjects reported to be affected on history but that could not be examined. The number in brackets indicates the median number of repeats for the affected individuals of this family. The numbers in symbols indicate the number of siblings with the same sex. EXP indicates individuals with FGF14 expansions. C Pedigree of the family with NM_175929.3: c.239 T > G; p.(Leu80*). VAR = variant i.e., c.239 T > G; p.(Leu80*).
Fig. 3
Fig. 3. Analysis of FGF14 repeat expansions in affected subjects using LR-PCR and nanopore sequencing.
A Gel electrophoresis of selected LR-PCR products spanning the FGF14 (AAG) STR locus. From left to right, M: 1 kb ladder; C: negative control; lanes 1-2: expansions between 220 and 299 repeats (1-M79607, 2-M90982); lane 3: individual M82415 shows one small and two large alleles; lanes 4-11: expansions above 300 repeats (4-M87668, 5-M84267, 6-M93354, 7-M81456, 8-M95289, 9-M80996, 10-M80920, 11-M96642 (937 repeats)). B Gel electrophoresis of LR-PCR products showing biallelic expansions: lanes 12-M96652, 13-M97638, 14-M95716, 15-M83825, 16-M80332, 17-M100781. M: 1 kb ladder; LR-PCR assays and gel electrophoresis were performed at least twice with the same results. C Waterfall plots showing selected nanopore reads after separation of alleles based on their flanking regions (methods). 300 randomly chosen reads are displayed in each graph. Blue: AAG repeats; Yellow: GAG; Red: AGG; Green: ACG; Pink: AAC; Black: other. Panel above: segregation of FGF14 alleles in family E19-1058 (three affected siblings, two with biallelic expansions and one with a single expansion of 325 repeats). Lower-left panel: individual M82415 (E20-0501) shows three different alleles: one small and two large (somatic mosaicism). Lower-right panel: individual M87859 (E21-0708) shows a pure AAG expansion (301 repeats) and a smaller allele with ACG interruptions. AAC streaks likely constitute errors of sequencing rather than true changes. D Nanopore reads from individual M81457 with an AAGGAG expansion. E Correlation between the median number of repeats detected by nanopore sequencing and expansion size estimated from fragment size analysis. F Standard deviation in allele size calculated from nanopore reads showing that somatic instability is positively correlated with expansion size. Blue: AAG; orange: AAGGAG main motif. For graphs (E and F), R2 is the square value of the Pearson correlation coefficient (two-sided) and 95% confidence intervals appear in light gray.
Fig. 4
Fig. 4. Distribution of FGF14 alleles in patients with cerebellar ataxia and control subjects.
A Median number of triplets of both alleles for the 59 patients with ataxia and 64 control individuals sequenced by nanopore sequencing. Pure AAG alleles are depicted as blue dots with a white fill. AAGGAG alleles appear in orange. Alleles with interruptions are depicted as blue dots with a dark blue fill. Alleles with interruptions limited to the 5’ or 3’ of the expansion are depicted as blue dots with a light blue fill. B Comparison of median allele sizes (larger alleles only; Mann-Whitney U test, two-sided) in index patients with cerebellar ataxia (n = 148) and control subjects (n = 802). Blue: AAG; orange: AAGGAG; gray: unknown main motif. C Density plot showing the different distributions of the number of triplets in the larger allele for index patients with cerebellar ataxia (n = 148; orange) and control subjects (n = 802; blue). D Log odds ratio according to repeat numbers of the larger allele (148 index patients with cerebellar ataxia and 802 control subjects) showing a significant enrichment of all classes of larger alleles ≥ 180 repeats in patients with cerebellar ataxia (Fisher’s tests, two-sided, adjusted for multiple comparisons using Bonferroni correction; yellow: enrichment; gray: depletion). Each bar represents a single data point. Figures similar to (B and D) but considering all alleles appear in Supplementary Fig. 5.
Fig. 5
Fig. 5. Effect of 5’ flanking regions on repeat instability.
A Schematic representation of the different parts composing FGF14 repeat expansions. An invariable CTTTCT motif is usually followed by a variable 5’ region. A pre-repeat can be present in some individuals before the repeats. Some alleles are interrupted by one or several other motifs called interruptions. B Median number of triplets for each allele depending on the flanking region sequence. GTTAGTCATAGTACCCC is present in small alleles ( ≤ 21 repeats) only. Other sequences show higher number of repeats, suggesting higher instability of these associations. C Median number of triplets for each allele depending on the pre-repeat motif. Graphs displayed in (B and C) include both patients with ataxia and controls compared by Mann-Whitney U test, two-sided, followed by Holm correction for multiple testing. Graphs presenting data for patients with ataxia and controls separately appear in Supplementary Fig. 7. Box plot elements are defined as follows: center line: median; box limits: upper and lower quartiles; whiskers: 1.5× interquartile range; points: outliers. Blue: AAG; orange: AAGGAG main motif.
Fig. 6
Fig. 6. Disease progression and age at onset (AAO).
A SARA scores of 40 patients with FGF14 expansions (n = 158 measurements). B ICARS scores of 40 patients with FGF14 repeat expansions (n = 154 measurements). In graphs shown in (A and B) patients with 250-299 repeats and patients with ≥ 300 repeats appear in red and blue, respectively. Scores from the same patients at different time points are connected with dashed lines. Numbered last data points mark lines corresponding to atypical patients (#1–6) or patients with biallelic expansions (#1–3 and #7–9; Supplementary Information). SARA and ICARS scores are clinical rating scales used for semi-quantitative assessment of cerebellar ataxia (methods). C Comparison of the AAO in SCA27A/SCA27B-negative patients, patients with different expansion sizes: 180–249, 250–299 and ≥ 300 repeats; and two patients with p.(Leu80*). D Comparison of the AAO in SCA27A/SCA27B-negative patients, and SCA27B patients (repeat size ≥ 250 repeats). E Meta-analysis comparing the AAO in patients with expansions between 250 and 299 repeats, patients with ≥ 300 repeats, patients with nonsense or frameshift variants in FGF14 or patients with p.Phe150Ser, showing that patients with pathogenic point variants (SCA27A) have an earlier age at onset than patients with repeat expansions (SCA27B). Box plot elements in C) to E) are defined as follows: center line: median; box limits: upper and lower quartiles; whiskers: 1.5× interquartile range; points: outliers; and comparisons were performed by applying Mann-Whitney U test, two-sided, followed by Holm correction for multiple testing. F Correlation between the AAO and AAG repeat number including only patients from this study. G Correlation between the AAO and AAG repeat number taking all patients from this study (red) and patients from previous studies (black) into account. For graphs F) and G), R2 is the square value of the Pearson correlation coefficient (two-sided) and 95% confidence intervals appear in light gray.
Fig. 7
Fig. 7. AAG and AAGGAG form different secondary structures at the DNA and RNA level.
A Schematic representation of the region on chromosome 13q33.1 containing the FGF14 gene showing isoforms 1 (ENST00000376143.5; NM_004115.4) and 2 (ENST00000376131.9; NM_175929.3), which have alternative first exons. The gene is on the reverse strand. The green arrows show the location of the AAG expansion in intron 1 of isoform 2. The location of the previously unreported nonsense variant (NM_175929.3: c.239 T > G; p.Leu80*) reported in this study is indicated in purple. B Schematic representation of FGF14 pre-mRNA isoforms 1 and 2. The expansion (green arrow) is composed of CUU repeats in RNA context. C Secondary structures formed by AAG and AAGGAG repeats at the DNA and RNA level, assessed by circular dichroism spectroscopy. AAG repeats form an antiparallel homoduplex whereas AAGGAG repeats form a parallel homoduplex at the DNA level. At the RNA level, the AAGGAG repeats fold into a parallel guanine-quadruplex (G4) while AAG repeats adopt an A-form RNA structure. On the contrary, the CTT and TCTCCT repeats adopt a B-form and CUU and UCUCCU repeats did not form any particular secondary structure under the tested conditions. G-quadruplex and other DNA/RNA structures were created with BioRender.com released under a Creative Commons Attribution-NonCommercial-NoDerivs 4.0 International license.

References

    1. Coarelli, G., Coutelier, M. & Durr, A. Autosomal dominant cerebellar ataxias: new genes and progress towards treatments. Lancet Neurol.22, 735–749 (2023). 10.1016/S1474-4422(23)00068-6 - DOI - PubMed
    1. Ashizawa, T., Oz, G. & Paulson, H. L. Spinocerebellar ataxias: prospects and challenges for therapy development. Nat. Rev. Neurol.14, 590–605 (2018). 10.1038/s41582-018-0051-6 - DOI - PMC - PubMed
    1. van Swieten, J. C. et al. A mutation in the fibroblast growth factor 14 gene is associated with autosomal dominant cerebellar ataxia. Am. J. Hum. Genet72, 191–199 (2003). 10.1086/345488 - DOI - PMC - PubMed
    1. Choquet, K., La Piana, R. & Brais, B. A novel frameshift mutation in FGF14 causes an autosomal dominant episodic ataxia. Neurogenetics16, 233–236 (2015). 10.1007/s10048-014-0436-7 - DOI - PubMed
    1. Dalski, A. et al. Mutation analysis in the fibroblast growth factor 14 gene: frameshift mutation and polymorphisms in patients with inherited ataxias. Eur. J. Hum. Genet13, 118–120 (2005). 10.1038/sj.ejhg.5201286 - DOI - PubMed

Publication types

Substances

LinkOut - more resources