. 2024 Nov;9(11):2923-2938.
doi: 10.1038/s41564-024-01795-7. Epub 2024 Sep 3.

Single-cell detection of copy number changes reveals dynamic mechanisms of adaptation to antifungals in Candida albicans

Affiliations

Single-cell detection of copy number changes reveals dynamic mechanisms of adaptation to antifungals in Candida albicans

Xin Zhou et al. Nat Microbiol. 2024 Nov.

Abstract

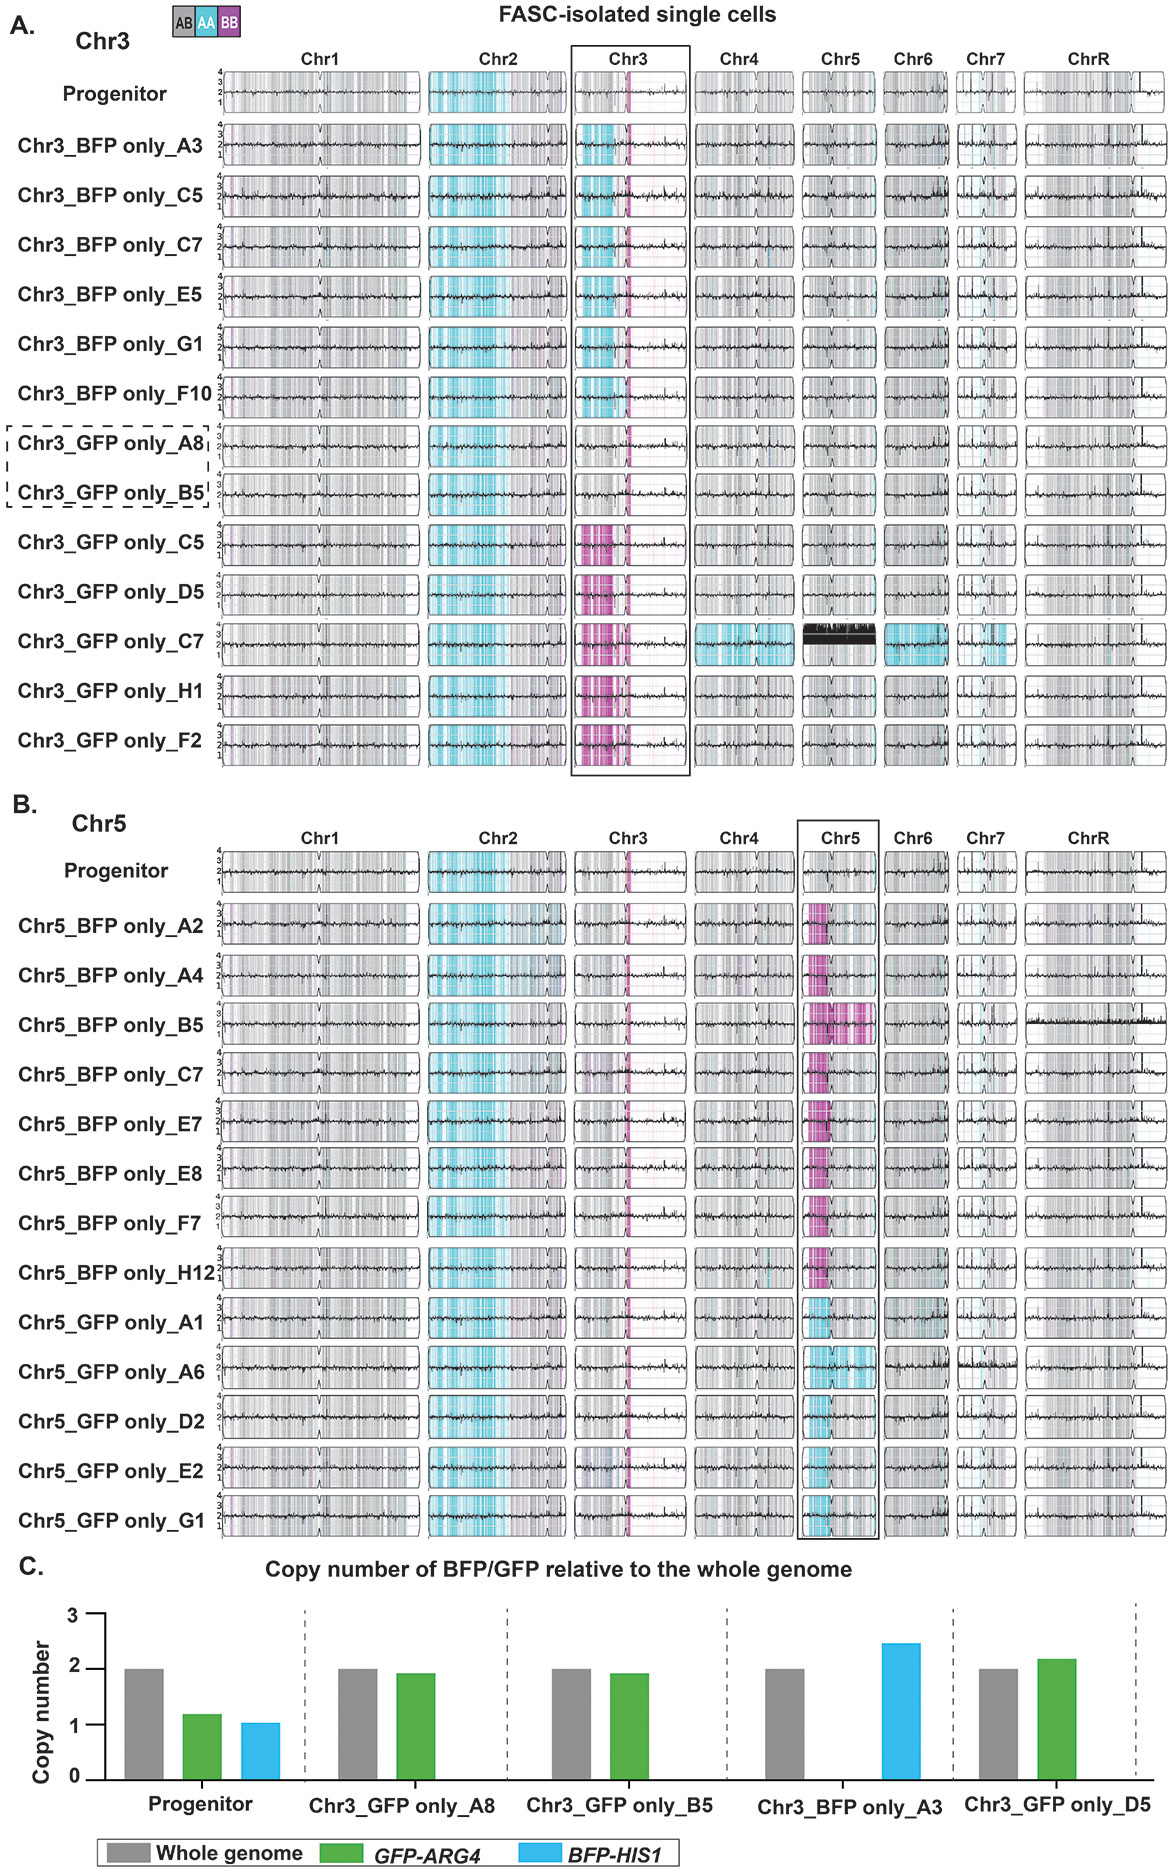
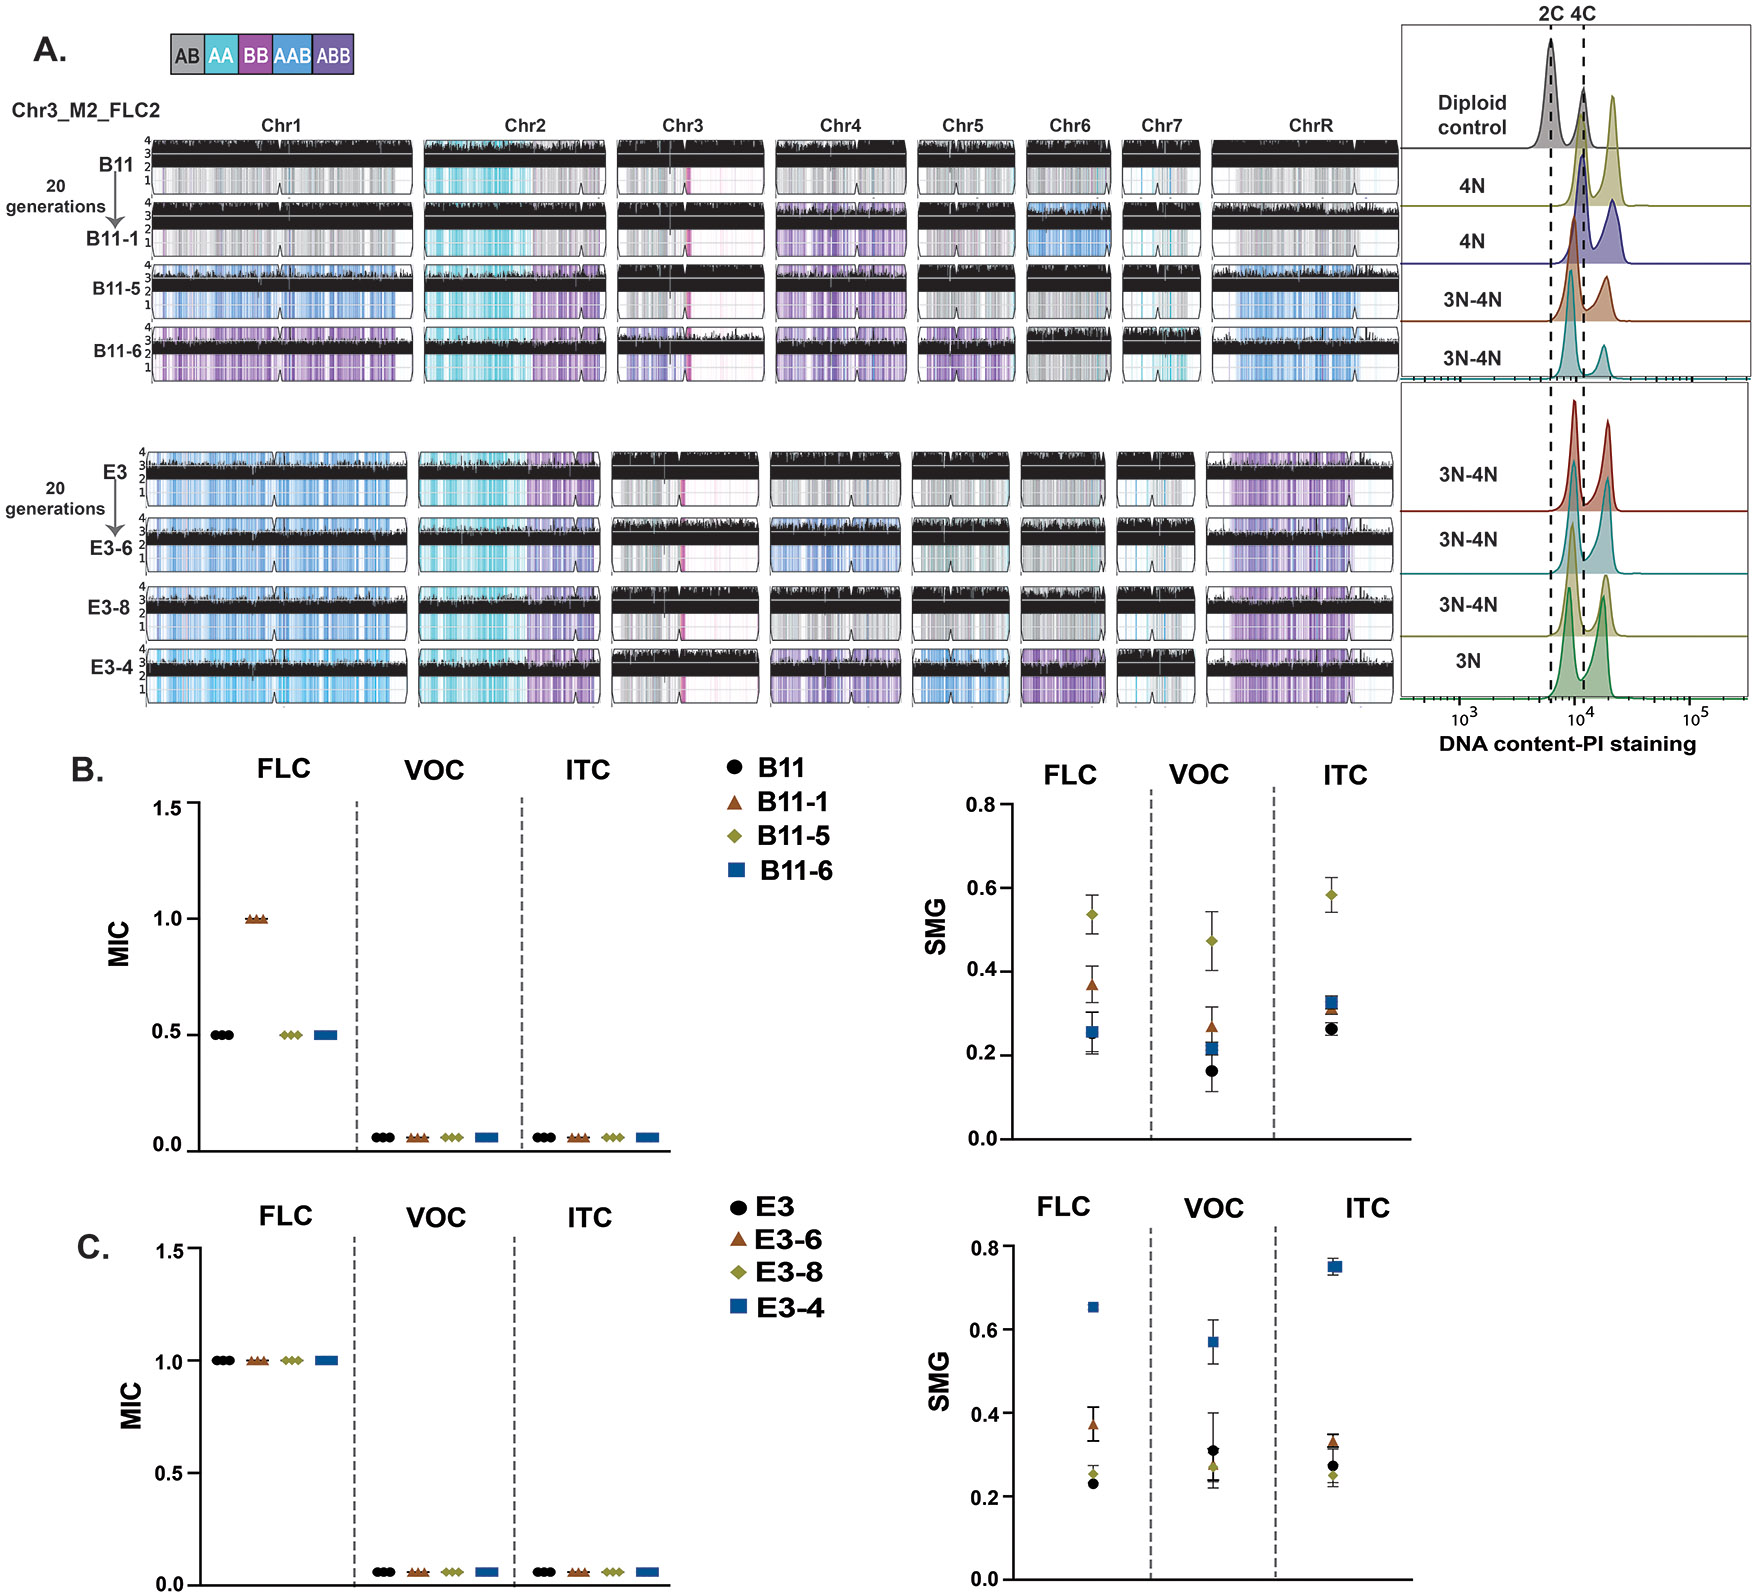
Genomic copy number changes are associated with antifungal drug resistance and virulence across diverse fungal pathogens, but the rate and dynamics of these genomic changes in the presence of antifungal drugs are unknown. Here we optimized a dual-fluorescent reporter system in the diploid pathogen Candida albicans to quantify haplotype-specific copy number variation (CNV) and loss of heterozygosity (LOH) at the single-cell level with flow cytometry. We followed the frequency and dynamics of CNV and LOH at two distinct genomic locations in the presence and absence of antifungal drugs in vitro and in a murine model of candidiasis. Copy number changes were rapid and dynamic during adaptation to fluconazole and frequently involved competing subpopulations with distinct genotypes. This study provides quantitative evidence for the rapid speed at which diverse genotypes arise and undergo dynamic population-level fluctuations during adaptation to antifungal drugs in vitro and in vivo.


Figures

Extended Data Fig. 1
Extended Data Fig. 1. Detection of both CNV and LOH using a BFP/GFP flow cytometry system.
A. Schematic of the BFP and GFP reporter strains. BFP and GFP are tagged on the left arms of Chr3 and Chr5. B. Whole genome sequencing (WGS) data from the Chr3 BFP/GFP, Chr5 BFP/GFP reporter strains, and the background strain Sn152. WGS data are plotted as the log2 ratio and converted to chromosome copy number (y-axis, 1-4 copies) as a function of chromosome position (x-axis, Chr1-ChrR). The baseline ploidy was determined by propidium iodine staining (Table S1). Haplotypes relative to the reference genome SC5314 are indicated: grey is heterozygous (AB), magenta is homozygous B, and cyan is homozygous A. Arrowheads indicate the position of the BFP/GFP loci. C-E Representative scatter plots for the control strains, with fluorescence intensity of BFP plotted on the x-axis and GFP on the y-axis. The four quadrants include non-fluorescent cells (BFP− GFP−), BFP only cells (BFP+ GFP−), GFP only cells (BFP− GFP+) and dual-fluorescent cells (BFP+ GFP+). Gating strategy for detection of singlets for non-fluorescent cells (C) and mono-fluorescent control strains, mono-GFP (D, left) and mono-BFP (D, right). E. Dual-fluorescent progenitor strains after gating for singlets with a rectangular gate drawn around the cells indicating a 1:1 ratio of BFP:GFP. Extensions of this gate represent changes in the 1:1 ratio due to copy number amplification of BFP or GFP (CNV BFP and CNV GFP). F. Representative scatter plots for CNV cells with histograms indicating the fluorescence intensity of BFP or GFP compared to the 1:1 ratio control. Copy numbers were determined by the median fluorescence intensity. i: CNV GFP, ii: CNV BFP. F. Flow cytometry detection of single cells within a population that acquired CNV and LOH of BFP and/or GFP during in vitro evolution. One representative example of a FLC-evolved lineage (Chr3_FLC4_L9) with BFP and GFP fluorescence changes at passages P1, P10, and P15 with population fractions indicated. C-G: Colors indicate 1:1 ratio of BFP:GFP (gray), CNV BFP (dark cyan), CNV GFP (yellow), GFP only (green), and BFP only (sky blue).
Extended Data Fig. 2
Extended Data Fig. 2. Schematic of the BFP/GFP in-vitro evolution experiment and flow cytometry controls.
A. Twelve single colonies from each BFP/GFP strain were inoculated into independent wells and cultured for 16 hrs. These twelve P0 lineages were diluted and split into four treatment conditions either in the absence or presence of FLC (0 μg/ml, 1 μg/ml, 4 μg/ml, and 8 μg/ml). The lineages were passaged every 48 hrs at 1:1000 dilution. After 10 passages, no FLC was added and all lineages were cultured only in rich media (0 μg/ml, YPAD) for another 5 passages with the same serial dilutions. Cells from every passage were collected and stored at −80°C. Figure created in BioRender.com. B. Median fluorescence intensity (MFI) of BFP (left) and GFP (right) of the no drug (0 μg/ml FLC) controls (black, twelve lineages L1-L12) and the mono-fluorescent control strains (red) at passages 0, 1, 5, 10, 12, and 15. Controls for day-to-day fluctuations in fluorescent intensity caused by variations in growth status and flow cytometer readings.
Extended Data Fig. 3
Extended Data Fig. 3. Population dynamics after FLC removal (passages 10-15).
Flow cytometry data plotted for populations where the rate of decrease (Sdown) and rate of increase (Sup) was calculated (Table S3). Stacked population fractions after removal of the drug (P10-P15) for select Chr3 lineages (left) and Chr5 lineages (right).
Extended Data Fig. 4
Extended Data Fig. 4. FACS-isolated single cells exhibited loss of heterozygosity on tagged chromosomes.
Genotypes of single cells obtained from the progenitor strains via fluorescence activated cell sorting (FACS) after overnight growth in the absence of drug. A. Chr3 BFP/GFP and (B) Chr5 BFP/GFP progenitor strains. Whole genome sequencing (WGS) data plotted Extended Data Fig.1B. The baseline chromosome copy number (ploidy) was determined by flow cytometry (Table S1). Haplotypes indicated by the color: gray is heterozygous (AB), magenta is homozygous B, cyan is homozygous A. Dashed box highlights two strains that underwent gene conversion events involving LOH only at GFP tagged regions. Boxes indicated the tagged chromosome. C. Gene conversion of the BFP/GFP locus detected in two FACS-isolated single cells. Copy numbers of GFP-ARG4 or BFP-HIS1 were determined by average read depth at the GFP-ARG4 or BFP-HIS1 loci relative to average whole-genome read depth for: i) the Chr3 BFP/GFP progenitor; ii) two independent FACS sorted single cells from Extended Data Fig.4A that were GFP only but heterozygous for the rest of Chr3 (dashed box); and iii) two FACS sorted single cells from Extended Data Fig.4A that were BFP only or GFP only and acquired large LOH regions of Chr3. The progenitor and single cells in this copy number analysis were all euploid.
Extended Data Fig. 5
Extended Data Fig. 5. Fluorescence analysis of single colonies and estimation of DNA copy number.
A. Scatter plot for Chr3_FLC1_L5 total population at BFP (x-axis) vs GFP (y-axis). B. Scatter plots of 12 single colonies (S1-S12) randomly selected from Chr3_FLC1_L5. Single colonies S3, S5, S6, S9, and S12 selected for WGS are indicated with a box around their name. C. Calculation of fluorescent units: median fluorescence intensity of analyzed cells were normalized by the median fluorescence intensity of one copy BFP or GFP controls.
Extended Data Fig. 6
Extended Data Fig. 6. Fluorescent phenotype detects genotype changes including LOH, aneuploidy, and polyploidy.
Representative flow cytometry scatter plots for four different fluorescent phenotypes: GFP-only, BFP-only, CNV BFP, and CNV GFP and the corresponding genotypes of the tagged chromosomes as detected by WGS. Both whole chromosome and segmental chromosome events are indicated. Inverted triangles indicate the BFP/GFP tagged locus. WGS data plotted as in Extended Data Fig.1B. The baseline chromosome copy number (ploidy) was determined by flow cytometry (Table S1). Haplotypes are indicated by the color: gray is heterozygous (AB), magenta is homozygous B, cyan is homozygous A, purple is ABB, and blue is AAB. A. Chr3 BFP/GFP progenitor strain (euploid heterozygous) and representative evolved colonies with Chr3 GFP-only (LOH BB), Chr3 BFP-only (LOH AA), Chr3 CNV GFP (aneuploid ABB), Chr3 CNV BFP (aneuploid AAB). B. Chr5 BFP/GFP progenitor strain (euploid heterozygous) and representative evolved colonies with Chr5 GFP-only (LOH AA) Chr5 BFP-only (LOH BB), Chr5 CNV GFP (aneuploid AAB), and Chr5 CNV BFP (aneuploid ABB). C&D. Segmental amplification of Chr5L in an isochromosome structure. Flow cytometry plot indicating a doubling of both the Chr5 BFP & GFP fluorescence units and the corresponding genotype for FLC evolved lineages (Chr5_FLC1_L12_S4/12). D. CHEF karyotype gel stained with ethidium bromide (left) of the progenitor strain and an i(5L) strain from S6C and Southern blot (right) probed with the centromere of Chr5 (CEN5). One CHEF/Southern blot was performed. E. Polyploid cells detected by combined fluorescent units ~4. Scatter plots (Left) for two single colonies indicating BFP and GFP fluorescence with histograms indicating the copies of BFP or GFP compared to 1:1 ratio control. PI-DNA staining of these two colonies with a diploid control (Right). Bottom: WGS data for two tetraploid cells. Black dashed lines in flow cytometry scatter plots indicate the median fluorescence intensity of 1-copy GFP (1G, 1:1 ratio control), 2-copy GFP (2G, Chr5 LOH AA from B), 3-copy GFP (3G, Chr5_FLC8_L6_S1), and 4-copy GFP (4G, Chr5_FLC8_L6_S12). Gates in all scatter plots were generated with controls as described in Fig 1.
Extended Data Fig. 7
Extended Data Fig. 7. Detection of copy number and allele ratio changes by whole genome sequencing for representative single colonies.
WGS data plotted as the log2 ratio and converted to chromosome copy number (y-axis, 1-4 copies) as a function of chromosome position (x-axis, Chr1-ChrR) using YMAP. The baseline chromosome copy number (ploidy) was determined by flow cytometry (Table S1). Haplotypes indicated by the color: gray designate heterozygous (AB), magenta for homozygous B, cyan for homozygous A, purple for ABB, and blue for AAB. A. WGS data for Chr3-tagged BFP/GFP single colonies. B. WGS data for Chr5-tagged BFP/GFP single colonies with representative aneuploidies. C. WGS data for Chr5-tagged single colonies that were BFP CNV by phenotype but had no detectable Chr5 CNV after sequencing. All single colonies were isolated from in vitro FLC-evolved lineages at P10 (Extended Data Fig. 5 and Methods).
Extended Data Fig. 8
Extended Data Fig. 8. Chr3 trisomy alone confers 2-fold increased MIC in FLC.
A. 24hr MIC and 48 hr SMG for single colonies with Chr3 and Chr6 trisomy in fluconazole (FLC), voriconazole (VOC) and itraconazole (ITC) with the progenitor as the control. B. MIC of single colonies with Chr3 and Chr6 trisomy (concurrent aneuploidy) (n= 6 strains), Chr3 trisomy or Chr6 trisomy (mono-trisomy) (n= 4 and 3 strains), and euploidy (disomy) (n= 3 strains) in FLC. A&B. Each dot represents the average of three technical replicates for each strain. C. MIC of MRR1 or MDR1 heterozygous deletion mutants (n= 5 strains) in concurrent trisomy aneuploidy background with euploid wildtype and concurrent aneuploidy as the control in FLC. D. Overexpression (OE) of MDR1 or MRR1 leads to an increase in MIC but no change in drug tolerance quantified as the supra-MIC growth (SMG) at 48hr. MIC (left) and SMG (right) of MDR1- and MRR1-OE strains with the wild-type control. C&D. Each dot represents the average of three technical replicates for a single transformant. A-D. The line and error bars indicate the median and standard deviation across all strains with the same genotype. E. mRNA expression fold change of MRR1 (left) and MDR1(right) in MRR1-OE and MDR1-OE strains relative to the progenitor with TEF1 on Chr2 as the control. Expression changes were tested in YPAD and YPAD+1μg/ml FLC conditions. Values are mean ± SEM calculated from three biological replicates. Error bars indicate the standard deviation across three biological replicates.
Extended Data Fig. 9
Extended Data Fig. 9. Genomic instability of polyploid cells and its fitness consequence.
A. Passaging of polyploid colonies in vitro results in chromosome loss. WGS data of two polyploid colonies from the same mouse, Chr3_M2_FLC2_B11 and Chr3_M2_FLC2_E3, with 3 evolved single colonies. Ploidy level indicated to the right using propidium iodide staining of DNA content. WGS data plotted as in Extended Data Fig.1B. B&C. MIC and SMG values for the two mouse-derived polyploid colonies: B11(B) and E3 (C) and their evolved progeny. Each dot represents the average of three technical replicates and error bars indicate the standard deviations across three technical replicates.
Fig. 1
Fig. 1. Fluconazole exposure selects for rapid and dynamic fluorescence changes on Chr3 and Chr5.
Flow cytometry analysis of (A) Chr3 BFP/GFP and (B) Chr5 BFP/GFP lineages evolved in the absence or presence of FLC for 15 passages. Each graph represents the twelve independent lineages exposed to 0, 1, 4, or 8 μg/ml FLC. Flow cytometry data were collected at passages 0, 1, 5, 10, 12, and 15 (P0-P15). At P10 (dashed lines), no FLC was added to experiments to monitor stability of the fluorescent lineages in the absence of drug. The graph colors represent the fraction (%) of five different types of fluorescent cells within each population. Pink boxes indicate lineages selected for subsequent analysis (Fig 2A). (C) Average combined distributions from all twelve lineages at each drug concentration for the Chr3 (left) and the Chr5 (right) fluorescently tagged strains. Dashed lines indicate the time when no FLC was added to the experiments.
Fig. 2
Fig. 2. Rapid population sweeps are driven by increased fitness.
A. Increased population sampling for select lineages of Chr3 (left) and Chr5 (right) during FLC adaptation (Daily, P0-P10). Stacked population fractions presented as in Fig 1. Dashed lines indicate Tpeak. B. Relative fitness determined using a head-to-head competition over 48 hrs. Each GFP-only subpopulation at P10 was competed with the wild-type (non-fluorescent) control. Values are mean ± SEM calculated from three biological replicates. Data were assessed for normality with a Shapiro-Wilk test, and significant differences between the progenitor and GFP lineages across different environments were calculated using two-way ANOVA with Dunnett’s multiple comparisons test (two-sided), ****P <0.0001, the exact P value were < 0.0001 for all indicated comparison. The dashed line indicates wild-type fitness. C. WGS data for the whole population of three GFP-only lineages (top) and single cells isolated from two of the same lineages at P10 (bottom). WGS data are plotted as the log2 ratio and converted to chromosome copy number (y-axis, 1-4 copies) as a function of chromosome position (x-axis, Chr1-ChrR). The baseline ploidy was determined by propidium iodine staining (Table S1). Haplotypes relative to the reference genome SC5314 are indicated: grey is heterozygous (AB), magenta is homozygous B, cyan is homozygous A, purple is trisomy ABB, and blue is trisomy AAB. Boxes highlight the BFP/GFP tagged chromosome in each strain.
Fig. 3
Fig. 3. Single cell sorting identifies different rates and fitness consequences of Chr3 LOH.
A. Fluorescence-activated cell sorting (FACS) of the BFP/GFP progenitor strains for BFP-only and GFP-only cells (Chr3 as representative) (Methods). B. Frequency of GFP-only and BFP-only cells detected by FACS of at least 105 cells from the Chr3 and Chr5 BFP/GFP progenitor populations after just 36 hrs growth in rich medium (YPAD). Values are mean ± SEM calculated from four biological replicates. Data were assessed for normality by a Shapiro-Wilk test, and significant differences between the BFP only and GFP only were calculated using two-way ANOVA with Šídák's multiple comparisons test (two-sided), ****: P <0.0001, ns: P>0.05, the exact P value for **** was <0.0001. C. Representative WGS data for BFP-only or GFP-only cells isolated from single cell sorting, plotted as in Fig 2 (all single cell WGS data presented in Extended Data Fig. 4). Whole chromosome and segmental chromosome LOH of each haplotype (AA and BB) are indicated for single cells isolated from the Chr3- and Chr5-tagged strains by FACS. No other copy number changes were detected in these single cells. Haplotypes are indicated by the color: gray is heterozygous (AB), magenta is homozygous B, and cyan is homozygous A. Boxes highlight the tagged chromosome. D. Relative fitness, determined by head-to-head competition, for single cells with LOH from Fig 3C and the progenitor compared to the wild-type control for (left) Chr3 LOH single cells and (right) Chr5 LOH single cells. Values are mean ± SEM calculated from three biological replicates. Data were assessed for normality by a Shapiro-Wilk test, and significant differences between the progenitor and LOH single cells across different environments were calculated using two-way ANOVA with Dunnett’s multiple comparisons test (two sided). Chr3 BB versus the progenitor: ****P<0.0001, the exact P value were < 0.0001 for all indicated comparison. The dashed line indicates wild-type fitness.
Fig. 4
Fig. 4. Synergistic effect of Chr3 and Chr6 aneuploidy on multi-azole tolerance.
Number of chromosome copy number changes identified by WGS of the diploid FLC-evolved colonies (n=48) from all three drug concentrations (Table S1, Extended Data Fig. 6) A. Chr3 BFP/GFP and B. Chr5 BFP/GFP. Heat map indicating the number of colonies with each pairwise combination. The x-axis represents the Chr3 or Chr5 genotype and the y-axis represents the other 7 untagged chromosomes. Genotypes include AB, BB, AA, ABB, and AAB. Chr5 has an extra genotype of AABB (for i(5L)), but not ABB. C. WGS data for representative colonies from two independent FLC-evolved lineages with Chr3 trisomy (ABB or AAB) and Chr6 trisomy (ABB) or tetrasomy (ABBB), plotted as in Fig 2. D. WGS data of three representative strains derived from strains in Fig 4C that have Chr3 trisomy (ABB or AAB), Chr6 trisomy (ABB) or Chr3 and Chr6 disomy (AA, BB, AB), plotted as in Fig 2. C&D: Haplotypes indicated by the color gray designate heterozygous (AB), magenta for homozygous B, cyan for homozygous A, purple for ABB, and blue for AAB. E. FLC Tolerance quantified as Supra-MIC growth (SMG) for strains with Chr3 and Chr6 concurrent aneuploidy (n= 6 strains), Chr3 or Chr6 trisomy (mono-trisomy) (n= 4 and 3 strains), and no aneuploidy (disomy) (n = 3 strains). Red dashed line indicates the additive SMG value of Chr3 and Chr6 mono-trisomy strains. F. FLC Tolerance (SMG) of the concurrent aneuploid strain with one copy of MRR1 or one copy of MDR1 deleted (n= 5 strains), compared to the concurrent aneuploid strain with the euploid progenitor as the control. Each dot represents independent transformants. E&F: Each dot represents the average of three technical replicates for each strain. The line and error bars indicate the median and standard deviation across all strains with the same genotype. G. mRNA expression fold change (y-axis) of CDR1, CDR2, MRR1, and MDR1 in strains with Chr3 and Chr6 concurrent aneuploidy relative to the progenitor with TEF1 on Chr2 as the control. Fold change is correlated with the gene copy number (x-axis) and dotted lines indicate the expression level which increases proportionally with gene copy number. Each dot and error bars indicate the average and standard deviation across three biological replicates.
Fig. 5
Fig. 5. Colonies recovered from mice treated with FLC have increased fluorescence changes and ploidy variations.
A. Schematic for mice infection. Mice were infected with Chr3 or Chr5 BFP/GFP reporter strains on day 0 via tail vein injection. Mice were treated with PBS or with FLC at 0.5 mg/kg, 2 mg/kg, or 5 mg/kg (FLC0.5, FLC2, FLC5) every day for 5 days. All mice were sacrificed on day 6 and organs were collected for CFUs and fungal cell recovery. Figure created in BioRender.com. B. Fungal burdens of mice kidneys that were infected with Chr3 BFP/GFP (left) or Chr5 BFP/GFP (right) strains. CFUs were analyzed on day 6 post-infection. The line and error bars indicate the median and interquartile range across all fungal CFUs across mice from the same infection condition. Data were assessed for normality by a Shapiro-Wilk test, and significant differences by one-way ANOVA with Dunnett’s multiple comparisons test (two-sided). ****p<0.0001, ***P<0.001, *P<0.05, the exact P value for * was 0.0483, *** were 0.0001,0.0002 and 0.0004, and **** was <0.0001. C. Frequency of fluorescence changes among all colonies recovered from mice infected with Chr3 BFP/GFP (left) or Chr5 BFP/GFP (right) strains. The total number (n) of colonies recovered from mice and analyzed for fluorescence phenotypes is indicated. D. WGS data of twelve representative colonies isolated from mice and selected based on their BFP/GFP phenotypes, plotted as in Fig 2. Boxes highlight the fluorescently tagged chromosome. E. Correlation of estimated ploidy and BFP/GFP fluorescence. Median G1 fluorescence of propidium iodide (PI) stained cells (x-axis) plotted according to the sum of the BFP and GFP fluorescent units (y-axis) for FLC-treated mice samples. Samples from mice that had high frequency of fluorescent changes are presented here, with WGS samples labelled. Chr5_M1_FLC0.5 (purple squares), Chr3_M2_FLC2 (blue circles), Chr3_M1-5_FLC5 and Chr5_M4&M5_FLC5 (pink triangles), and PBS control Chr3_M1_PBS (gray hexagons). F. Ploidy analysis of four representative polyploid colonies with the diploid progenitor controls (>10,000 PI stained cells). Dashed lines indicate G1 (2C) and G2 (4C) of the progenitors.
Fig. 6
Fig. 6. Samples recovered from mice treated with FLC have increased fitness in vitro.
A. Growth rates in YPAD (left) and YPAD +1 μg/ml FLC (right) from representative single colonies isolated from mice infected with Chr3 or Chr5 BFP/GFP strains and treated with PBS (gray) or 0.5 mg/kg (purple square), 2 mg/kg (blue circle), and 5 mg/kg FLC (pink triangle). Comparison was between colonies isolated from the PBS-treated and FLC-treated mice. Polyploid colony E3 is labelled. Dashed box indicates four diploid colonies that have increased growth in the presence of FLC (E9, E12, F6 and E10) and decreased growth in YPAD. Growth is indicated by the area under the growth curve after 48hr. The line and error bars indicate the median and 95% confidence interval across all single colonies from the same infection condition. B. Relative fitness determined for E9, E12, F6, E10, and the progenitor compared to the wild-type control. Data are mean ± SEM calculated from three biological replicates. The dashed line indicates wild-type fitness. A&B Data were assessed for normality by Shapiro-Wilk, and significant differences by one-way ANOVA (A) or two-way ANOVA (B) followed by Dunnett's multiple comparisons test (two-sided). *p<0.05, **p< 0.01, ****p<0.0001, ns: P>0.05, the exact P value for * was 0.0170, 0.0106 and 0.0121, ** were 0.0018, 0.0013, and 0.0048, and **** was <0.0001. C. WGS data plotted as in previous figures for colonies E9, E12, F6 and E10 with their FLC MIC (24 hr) and SMG (48 hrs) values shown on the right. WGS data was plotted as in Fig 2.

References

    1. Pfaller MA, Diekema DJ, Turnidge JD, Castanheira M & Jones RN Twenty Years of the SENTRY Antifungal Surveillance Program: Results for Candida Species From 1997–2016. Open Forum Infect Dis 6, S79–S94 (2019). - PMC - PubMed
    1. Pfaller MA Antifungal drug resistance: mechanisms, epidemiology, and consequences for treatment. Am. J. Med 125, S3–13 (2012). - PubMed
    1. Andes DR et al. Impact of treatment strategy on outcomes in patients with candidemia and other forms of invasive candidiasis: a patient-level quantitative review of randomized trials. Clin. Infect. Dis 54, 1110–1122 (2012). - PubMed
    1. Cowen LE The evolution of fungal drug resistance: modulating the trajectory from genotype to phenotype. Nat. Rev. Microbiol 6, 187–198 (2008). - PubMed
    1. Perea S. et al. Prevalence of molecular mechanisms of resistance to azole antifungal agents in Candida albicans strains displaying high-level fluconazole resistance isolated from human immunodeficiency virus-infected patients. Antimicrob. Agents Chemother 45, 2676–2684 (2001). - PMC - PubMed

LinkOut - more resources