. 2024 Sep 3;14(1):20421.
doi: 10.1038/s41598-024-71623-9.

Acid-sensing ion channel 3 is a new potential therapeutic target for the control of glioblastoma cancer stem cells growth

Affiliations

Acid-sensing ion channel 3 is a new potential therapeutic target for the control of glioblastoma cancer stem cells growth

Andrea Balboni et al. Sci Rep. .

Abstract

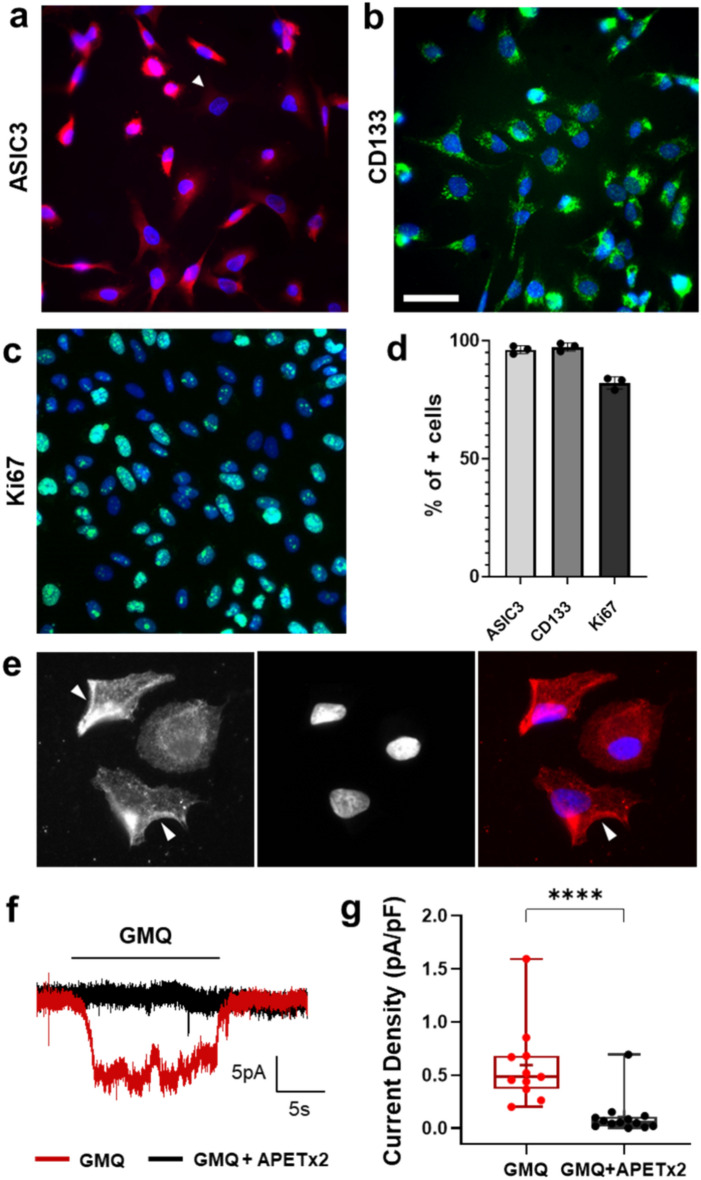
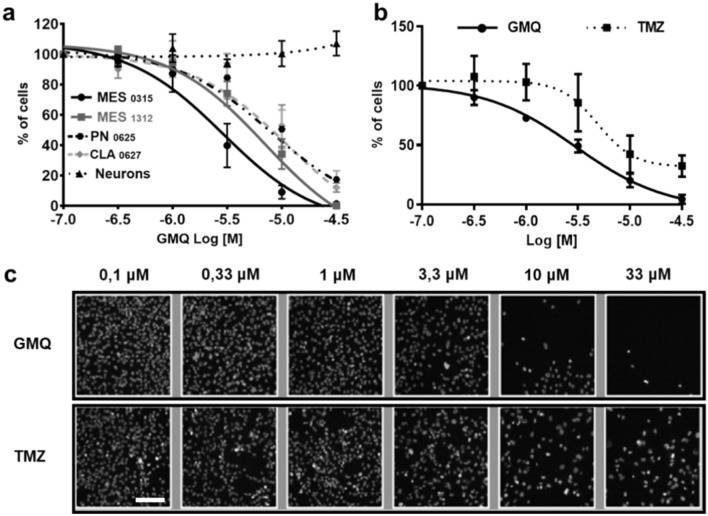
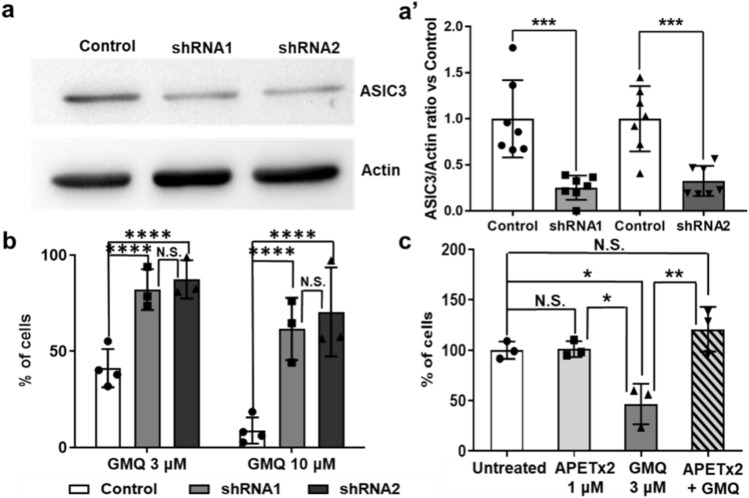
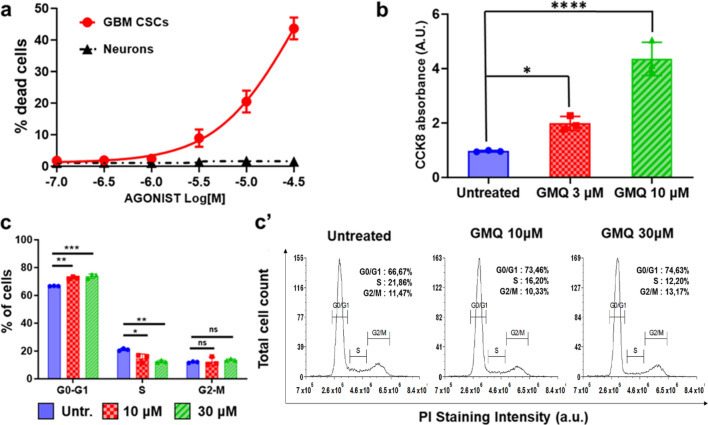
Glioblastoma (GBM) is the most common malignant primary brain cancer that, despite recent advances in the understanding of its pathogenesis, remains incurable. GBM contains a subpopulation of cells with stem cell-like properties called cancer stem cells (CSCs). Several studies have demonstrated that CSCs are resistant to conventional chemotherapy and radiation thus representing important targets for novel anti-cancer therapies. Proton sensing receptors expressed by CSCs could represent important factors involved in the adaptation of tumours to the extracellular environment. Accordingly, the expression of acid-sensing ion channels (ASICs), proton-gated sodium channels mainly expressed in the neurons of peripheral (PNS) and central nervous system (CNS), has been demonstrated in several tumours and linked to an increase in cell migration and proliferation. In this paper we report that the ASIC3 isoform, usually absent in the CNS and present in the PNS, is enriched in human GBM CSCs while poorly expressed in the healthy human brain. We propose here a novel therapeutic strategy based on the pharmacological activation of ASIC3, which induces a significant GBM CSCs damage while being non-toxic for neurons. This approach might offer a promising and appealing new translational pathway for the treatment of glioblastoma.


Conflict of interest statement

The authors declare no competing interests.

Figures

Fig. 1
Fig. 1
The ASIC3 isoform is enriched in glioblastoma CSCs. (a) Western blot analysis of ASIC3 and ASIC1a expression in human primary GBM-CSC lines from the three GBM subtypes (PN  proneural, MES mesenchymal, CL classical). ASIC3 (n ≥ 3) (b) and ASIC1a (n = 3) (b’) protein expression quantification normalized on actin levels in the different GBM-CSC lines. (c) Western Blot analysis of CD133/prominin1 and ASIC3 expression in a healthy human brain lysate, in the GBM-MES CSCs 0315 line and in a biopsy from the same patient used to generate the CSC line 0315. (c’) ASIC3 and CD133/prominin1 protein expression quantification normalized for actin levels, in healthy human brain, GBM MES 0315 line and MES 0315 patient’s biopsy (n = 4). Statistic was performed by a two-way Anova with Bonferroni’s post-test:(****) p < 0,0001. (d) Data from publically available Repository for Molecular BRAIN Neoplasia Data (TCGA datasets Affymetrix HT HG U133A) were used to determine the relative expression of ASIC3 mRNA (ACCN3) in four human glioma subtypes (Classical, Mesenchymal, Neuronal, and Proneuronal), as well as in healthy patients. All 454 glioma patients with available mRNA were examined. (e) Western Blot analysis of ASIC3 expression in GBM-CSCs MES 0315 growth in 3D and 2D culture conditions after 24hin culture. Original blots were horizontally cropped at the appropriate MW region in order to perform multiple staining on the same blot. In the figure, portions of the same blot are separated by white lines. Black lines are used to separate independent blots presented in the same figure. Original blots are shown in supplementary figure S1 and S4. Dots represent independent experiments. Measurements were taken from distinct samples. Graphs for (b,b’,c’) were analyzed with GraphPad Prism 9, graph for (d) was obtained from https://www.betastasis.com/glioma/tcga_gbm/.
Fig. 2
Fig. 2
Generation of a virtual 3D model of the human ASIC3 channel. (a) AlphaFold model of human ASIC3 represented as cartoons colored by model quality (from low quality pLDDT = 50 in blue, to high quality pLDDT = 100 in red); inset: close up view of the extracellular domain of ASIC3, highlighting with spheres amino acids Glu78 and Glu421, known to be involved in GMQ binding. (b) Superposition of the two structural models (depicted as cartoon) selected after MD simulation using cluster analysis: 682 (68.2 ns) as blue and 812 (81.2 ns) as cyan and extent of the region explored during in silico docking analysis. (c,d) Close-up views of the interaction between charged (yellow carbon atoms) and non-charged (orange carbons) GMQ with protein residues [sticks with carbon atoms colored in cyan (812) or blue (682)].
Fig. 3
Fig. 3
ASIC3 is expressed in almost all CSCs and can be activated by GMQ. (a) Immunofluorescence image of GBM CSCs MES 0315 in culture stained for ASIC3 (red) and for hoechst (blue). Arrowhead points to an ASIC3 negative cell. (b) Immunofluorescence image of GBM CSCs MES 0315 in culture stained for CD133/Prominin1 (green) and for hoechst (blue). (c) Immunofluorescence image of GBM CSCs MES 0315 in culture stained for Ki67 (green) and for hoechst (blue). (d) Histogram showing the percentage of positive cells for ASIC3, CD133 and Ki67 n ≥ 3 independent experiments. The graph was made with GraphPad Prism v9 (e) High magnification image of ASIC3 (left), hoechst (middle) and double staining (right), arrowheads point to a membrane enriched ASIC3 staining. (f) Representative traces of a GMQ-induced current in GBM-MES 0315 cells in the presence or absence of APETx2 (black and red traces respectively). (g) Box plot of membrane current density upon stimulation with GMQ alone (red) or in the presence of APETx2 (black). Plot displays the mean (+), median (internal horizontal line), first and third quartiles (upper and lower box edges) and standard deviation (whiskers) of data distribution (n = 11). Dots represent individual cells. Significant difference was assessed by Mann–Whitney non-parametric test (****p < 0.0001). Scale Bar = 20 µm for (a–c) and 10 µm for (e). All data were analysed by using the Prism 8 (GraphPad) software and traces were generated by Origin 2018 (Origin Lab.).
Fig. 4
Fig. 4
Effect of GMQ and temozolomide on GBM CSCs. (a) Concentration‒response effect of GMQ treatment for 96 h on the GBM CSC lines MES 1312 (n = 3), MES 0315 (n = 3), PN 0625 (n = 3), CLA 0627 (n = 3) and mouse cortical neurons (n = 3). The values represent the % of cells normalized to the concentration of the smallest drug. Neither were the neurons affected by GMQ. (b) The GBM CSC line MES 0315 was treated with GMQ (n = 3) or temozolomide (TMZ) (n = 3) for 96 h. The values represent the normalized % of cells at the lowest drug concentration. The estimated EC50s were 3.0 μM and 7.5 μM for GMQ and TMZ, respectively. (c) Representative images of MES 0315 cells grown for 96 h with increasing concentrations of GMQ or TMZ. The cells were stained with Hoechst. Scale bar = 50 µm. Measurements were taken from distinct samples. All the data were analysed with GraphPad Prism v9.
Fig. 5
Fig. 5
Effect of GMQ on CSC-generated neurospheres. (a) Representative images of MES 0315 cells grown in a neurosphere assay after 96 h of treatment with increasing concentrations of GMQ or under control condition. Hoechst nuclear staining Bar = 200 µM; 50 µM in the inset. Number of neurospheres per area (b), average neurosphere area (c) and total neurosphere area per field (d) in MES 0315 cells after 96 h of GMQ treatment (n = 3 independent experiments). (e) Plot of the results of the ELDA experiment (n = 3 independent experiments, 10 wells per condition). (f) Statistical analysis of the experiment shown in (e), p values are shown. (g) 1/stem cell frequency confidence intervals. The data in (b–d) were analysed with GraphPad Prism v9, and the data in (e) were analysed with the ELDA online tool (https://bioinf.wehi.edu.au/software/elda/).
Fig. 6
Fig. 6
ASIC3 downregulation and its pharmacological blocking reduces the effect of GMQ. (a) Blot analysis of ASIC3 expression in GBM CSCs MES 0315 cells after infection with lentiviruses carrying specific anti-ASIC3 shRNAs (shRNA1 and shRNA2). Original blots were horizontally cropped at the appropriate MW region in order to perform multiple staining on the same blot. Portions of the same blot are separated by white lines. (a’) ASIC3/Actin protein expression ratio of MES 0315 before and after infection with Lentiviruses carrying shRNA1 or shRNA2 (n = 7) and normalized on control samples. CTRL vs shRNA1: P = 0,0007; CTRL vs shRNA2 P = : 0,0007. Original blots are shown in supplementary figure S9a and S9b. (b) Effect of ASIC3 downregulation on GMQ-induced GBM CSCs growth. Plot represents the number of MES 0315 cells after 96 h of GMQ treatments (3 and 10 μM), normalized to untreated samples: control (n = 4); shRNA1 (n = 3); shRNA2 (n = 3). (****) P < 0,0001. (c) Plot represents the % of GBM CSCs MES 0315 after 96 h of 3 μM GMQ treatment, in the presence or absence of 1 μM APETx2 toxin, normalized to the untreated sample, (n = 3); Unt vs GMQ p = 0.0214; Untr vs APETX2 + GMQ p = 0.9058; APETX2 vs GMQ p = 0.0189; GMQ vs APETX2 + GMQ p = 0.0029. Unpaired T-test for (a’), two-way Anova with Bonferroni’s post-test for (b) and One-way Anova with Bonferroni’s post-test for (c). Dots represent independent experiments. All graphs were analysed with GraphPad Prism v9.
Fig. 7
Fig. 7
GMQ induces Cell cycle and metabolism alterations as well as cell death in CSCs. (a) Single cell analysis of the % of dead cells induced by GMQ treatment, measured by Sytox staining, in MES 0315 lines and mouse cortical Neurons (n = 3). Data were normalized to untreated samples. (b) Metabolic activity of GBM-MES CSCs after GMQ treatment (3 and 10 μM, 96 h) measured by CCK8 assay. CCK8 absorbance was measured with a plate reader and normalized for the total number of cells present in the samples by Hoechst staining, to determine the metabolic activity per cell. Data were normalized over control samples. Unt. Vs GMQ 3 μM p = 0.035; Unt. Vs GMQ 10 μM p < 0.0001. (c) Cell cycle analysis after 24 h of GMQ treatment at 10 and 30 μM by propidium iodide incorporation at flow cytometer. Bars represent the average % of cells in different cell cycle phases after treatment (n = 3). Phases G0–G1: control vs 10 μM p = 0.001; Control vs 30 μM p = 0.0004. Phase S: control vs 10 μM p = 0.019; control vs 30 μM p = 0.0039. (c’) An example of PI intensity distribution of samples as in c. Statistical analysis: One-way Anova with Bonferroni’s post-test for (b,c). (ns) not significant; (*) P < 0.05; (**) P < 0.01; (***) P < 0.001; (****) P < 0.0001. Dots represent independent experiments. Measurements were taken from distinct samples. Graphs for (a–c) were analysed with GraphPad Prism v9, graph for (c’) was analysed with FCS Express 7 Plus using multicycle DNA tool.

References

    1. Sung, H. et al. Global Cancer Statistics 2020: GLOBOCAN estimates of incidence and mortality worldwide for 36 cancers in 185 countries. CA Cancer J. Clin.71, 209–249 (2021). 10.3322/caac.21660 - DOI - PubMed
    1. Reifenberger, G., Wirsching, H.-G., Knobbe-Thomsen, C. B. & Weller, M. Advances in the molecular genetics of gliomas—Implications for classification and therapy. Nat. Rev. Clin. Oncol.14, 434–452 (2017). 10.1038/nrclinonc.2016.204 - DOI - PubMed
    1. Stupp, R. et al. Radiotherapy plus concomitant and adjuvant temozolomide for glioblastoma. N. Engl. J. Med.352, 987–996 (2005). 10.1056/NEJMoa043330 - DOI - PubMed
    1. Hu, Y. et al. Neural network learning defines glioblastoma features to be of neural crest perivascular or radial glia lineages. Sci. Adv.8, 6340 (2022).10.1126/sciadv.abm6340 - DOI - PMC - PubMed
    1. Rodríguez-Camacho, A. et al. Glioblastoma treatment: State-of-the-art and future perspectives. Int. J. Mol. Sci.23(13), 7207 (2022). 10.3390/ijms23137207 - DOI - PMC - PubMed

MeSH terms

Substances

LinkOut - more resources