An official website of the United States government
The .gov means it’s official.
Federal government websites often end in .gov or .mil. Before
sharing sensitive information, make sure you’re on a federal
government site.
The site is secure.
The https:// ensures that you are connecting to the
official website and that any information you provide is encrypted
and transmitted securely.
Autoantibodies against neuronal membrane proteins can manifest in autoimmune encephalitis, inducing seizures, cognitive dysfunction and psychosis. Anti-N-methyl-D-aspartate receptor (NMDAR) encephalitis is the most dominant autoimmune encephalitis; however, insights into how autoantibodies recognize and alter receptor functions remain limited. Here we determined structures of human and rat NMDARs bound to three distinct patient-derived antibodies using single-particle electron cryo-microscopy. These antibodies bind different regions within the amino-terminal domain of the GluN1 subunit. Through electrophysiology, we show that all three autoantibodies acutely and directly reduced NMDAR channel functions in primary neurons. Antibodies show different stoichiometry of binding and antibody-receptor complex formation, which in one antibody, 003-102, also results in reduced synaptic localization of NMDARs. These studies demonstrate mechanisms of diverse epitope recognition and direct channel regulation of anti-NMDAR autoantibodies underlying autoimmune encephalitis.
Competing interests: The authors declare no competing interests.
Figures
Extended Data Fig. 1. Single-particle cryo-EM data…
Extended Data Fig. 1. Single-particle cryo-EM data processing for Fab-bound NMDARs (related to Fig. 1).
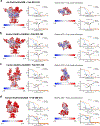
Particle processing workflows for Fab-bound NMDAR cryo-EM data. WARP-processed micrographs were used for blob picking and initial processing. Final volumes were generated in CryoSPARC 3.2.0 after template picking and cleanup using heterogeneous refinement followed by non-uniform refinement. Representative micrographs (scale bar corresponds to 25 nm), 2D averages, and intermediate volumes are shown.
Extended Data Fig. 2. Single-particle cryo-EM data…
Extended Data Fig. 2. Single-particle cryo-EM data processing for Fab-bound NMDARs (related to Fig. 1).
Local resolution and Fourier shell correlation of the entire complex (right panels) and locally refined map (one GluN1–2 ATD dimer and one Fab; left panels) for rat GluN1a-2B NMDAR/Fab-003–102 (a), GluN1a-2A NMDAR/Fab-003–102 (b), human GluN1a-2B NMDAR/Fab-007–168 (c), and human GluN1a-2A NMDAR/Fab-008–218 (d).
Extended Data Fig. 3. Representative cryo-EM density…
Extended Data Fig. 3. Representative cryo-EM density at the Fab binding sites (related to Fig.…
Extended Data Fig. 3. Representative cryo-EM density at the Fab binding sites (related to Fig. 1).
Cryo-EM density (blue mesh) of local refinement around GluN1a-2 ATD and Fab for human GluN1a-2A NMDAR/Fab-003–102 (a), human GluN1a-2B NMDAR/Fab-007–168 (b), and human GluN1a-2A NMDAR/Fab-008–218 (c) at the GluN1a-Fab binding sites.
Extended Data Fig. 4. Characterization of NMDAR…
Extended Data Fig. 4. Characterization of NMDAR mediated synaptic currents and GluN1 expression on neuronal…
Extended Data Fig. 4. Characterization of NMDAR mediated synaptic currents and GluN1 expression on neuronal dendrites (related to Figs. 2 and 4).
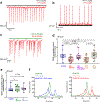
a, Whole-cell patch-clamp recordings in primary neurons (current-clamp mode) in the presence of NBQX and picrotoxin showing TTX-sensitive spontaneous action potentials. b-c, NMDAR-mediated spontaneous postsynaptic currents (sEPSC in the presence of NBQX and picrotoxin) are induced upon action potential firing and can be blocked by TTX (b). Application of AP-5 completely abolishes action potential elicited sEPSCs, thus demonstrating NMDAR mediated synaptic EPSCs (c). d-e, Quantification of GluN1 non-synaptic expression on neuronal dendrites upon 24 h antibody incubation (d: ncontrol IgG = 11; n003–102 IgG = 16; n003–102 attenuated = 16; n2xFv-long = 15, n2xFv-short = 14 dendrites. e: ncontrol IgG = 9; n007–168 IgG = 9; n008–218 IgG = 9 dendrites; n represent dendrites from individual neurons). f, Binding assessment of 2xFv short (scFv with short 20 amino acid residue linker) and long (scFv with short 80 amino acid residue linker) for the 003–102 antibody by FSEC using tryptophan fluorescence (280/330 nm excitation/emission). Arrows point to the peak shift, representing interactions with GluN1a-2A NMDAR proteins (GluN1/2 A). Boxes represent the median, 25th, and 75th percentile values, and the whiskers represent the minimum and maximum values. Treatment groups in d and e were compared using the non-parametric Kruskal-Wallis test with Dunn’s multiple comparisons. n.s., not significant. P-values are provided in the figure panels.
Extended Data Fig. 5. Cell viability is…
Extended Data Fig. 5. Cell viability is unaffected by low and high concentrations of control…
Extended Data Fig. 5. Cell viability is unaffected by low and high concentrations of control IgG and IgG 003–102 (related to Figs. 2 and 4).
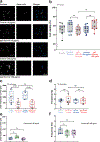
a, Representative images showing no influence of higher IgG 003–102 concertation (100 μg/mL) on cell viability. DAPI-positive cells representing all cells are shown in the left column; dead cells (stained positive with Live-or-dye) are shown in the middle column; the right column is merged images. b, Quantitative analysis shows no significant influence of control IgG and IgG 003–102 in 10 and 100 μg/ml concentration on cell viability (nNo Abs = 10, ncontrol 10 μg/mL = 10, n003–102 IgG 10 μg/mL = 10, ncontrol 100 μg/mL = 13, n003–102 IgG 100 μg/mL = 9). n represents individual neuron preparations. c-d, Quantitative analyses of synaptic NMDAR responses showed reduced sEPSC peak amplitude but not frequency at both low (10 μg/ml) and high (100 μg/mL) concentrations of patient-derived IgG 003–102 (ncontrol 10 μg/mL = 8, n003–102 IgG 10 μg/mL = 9, ncontrol 100 μg/mL = 4, n003–102 IgG 100 μg/mL = 5). e-f, Quantitative analyses of synaptic NMDAR responses upon incubation of Control IgG 100 μg/mL at various time points showing unchanged sEPSC peak amplitude and frequency (ncontrol 30 mins = 5, ncontrol 6h = 5, ncontrol 24h = 5). Boxes represent the median, 25th, and 75th percentile values, and the whiskers represent the minimum and maximum values. n in c to f represent individual neuron preparations. Treatment groups in b to f were compared using One-way ANOVA with Sidak’s multiple comparison Test. n.s., not significant. P-values are shown in the figure.
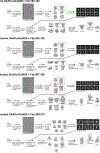
Extended Data Fig. 6. Single-particle cryo-EM data…
Extended Data Fig. 6. Single-particle cryo-EM data processing for IgG-bound GluN1a-2A NMDARs (related to Figs.…
Extended Data Fig. 6. Single-particle cryo-EM data processing for IgG-bound GluN1a-2A NMDARs (related to Figs. 5 and 6).
Particle processing of IgG-bound GluN1a-2A NMDARs. WARP-processed micrographs were used for blob picking and initial processing. Final volumes were generated in CryoSPARC 3.2.0 after template picking and cleanup using heterogeneous refinement followed by non-uniform refinement. Representative micrographs (scale bar corresponds to 25 nm), 2D averages, and intermediate volumes are shown.
Extended Data Fig. 7. Single-particle cryo-EM data…
Extended Data Fig. 7. Single-particle cryo-EM data processing for IgG-bound NMDARs (related to Figs. 5…
Extended Data Fig. 7. Single-particle cryo-EM data processing for IgG-bound NMDARs (related to Figs. 5 and 6).
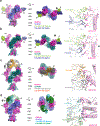
Local resolution and Fourier shell correlation (left panels) and representative cryo-EM density at the binding sites (right) for GluN1a-2A NMDAR/IgG-007–168 (a), GluN1a-2A NMDAR/IgG-008–218 (b), and GluN1a-2A NMDAR/IgG-003–102 (c).
Extended Data Fig. 8. Mass photometry of…
Extended Data Fig. 8. Mass photometry of GluN1a-2A NMDAR bound to IgG-003–102 (related to Fig.…
Extended Data Fig. 8. Mass photometry of GluN1a-2A NMDAR bound to IgG-003–102 (related to Fig. 6).
Samples of IgG-003–102, GluN1a-2A, and SEC-purified GluN1a-2A NMDAR complexed with IgG-003–102 were each diluted to 0.2 mg/mL and pipetted onto a glass coverslip for mass measurement using a mass photometer (Refeyn). Histograms represent the particle counts and particle mass of IgG and NMDAR alone (a) or complexed together (b).
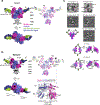
Figure 1.. Cryo−EM structures of NMDARs in…
Figure 1.. Cryo−EM structures of NMDARs in complex with Fab−003−102, Fab−007−168, and Fab−008−218.
a,b, Cryo−EM…
Figure 1.. Cryo−EM structures of NMDARs in complex with Fab−003−102, Fab−007−168, and Fab−008−218.
a,b, Cryo−EM density of Fab−003−102 complexed to the GluN1a−2A (a) and GluN1a−2B (b) NMDARs, viewed from the side (left) and top (middle). The zoom−in view of the Fab binding site at the R2 lobe of GluN1a ATD (right) viewed from the ‘eyes’ in the middle panels. c,d, Cryo−EM density of Fab−007−168 (c) and Fab−008−218 (d) complexed to the GluN1a−2A NMDAR. Arrows point to the cryo−EM density of Fabs bound to either the R1 or R2 lobe of GluN1a ATD. The Fab binding sites at the R1 lobe of GluN1a ATD (right panels) are viewed from the ‘eyes’ in the left panels.
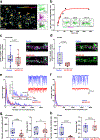
Figure 2.. IgG−003−102 leads to NMDAR channel…
Figure 2.. IgG−003−102 leads to NMDAR channel dysfunction in primary neurons.
a, dSTORM image (left)…
Figure 2.. IgG−003−102 leads to NMDAR channel dysfunction in primary neurons.
a, dSTORM image (left) of homer1 positive postsynaptic boutons after 6 hours of incubation with GluN1 IgG 003−102 (10 μg/ml). The localization precision is displayed as localization counts. Right images: SR−Tesseler segmented cluster representation for homer1 and IgG 003−102; primary hippocampal neurons, d.i.v. 18; scale bars 200 nm. Experiments were repeated 3 times with similar results. b, Binding kinetics of IgG 003−102 to neuronal synapses (n represents individual synapses; n0.5min=41; n1min=40; n5min=39; n10min=33; n20min=37; n40min=37; n60min=41; n240min=44). Bars represent the mean values +/− SEM. Insets show example images of IgG 003−102 binding at postsynaptic sites (scale bar 200 nm). c, d, Quantification of synaptic GluN1 clusters in neuronal dendrites after 30 minutes (c; nControl = 13; n003−102 = 12) or 6 hours (d; nControl = 6; n003−102 = 9) incubation with IgG 003−102 or control IgG (100 μg/ml). Images show representative dendrites with surface staining of GluN1 (magenta) and with homer1 (scale bar 1 μm). n in c and d represent synaptic volumes from individual neurons. e,f, Binned distribution of action−potential induced synaptic NMDAR currents (sEPCS) for data collected after 30 min (e) and 6 hours (f) incubation of IgG−003−102 and control IgG (100 μg/ml; n = 10 each; mean ± SEM). Inset in (e) shows a reduced number of medium− and large−sized events (500 to 1500 pA peak amplitude) after 30 minutes of incubation with IgG−003−102. Example traces show NMDAR sEPSCs after 30 min (e) and 6 hours (f) IgG incubation in the presence of NBQX and picrotoxin. g,h, Reduction of sEPSC peak amplitude, but not frequency after 30 minutes (g) and 6 hours (h) incubation of IgG−003−102 in comparison to control IgG (30 min: n = 10 each; 6 hours: n = 6 each). Boxes represent the median, 25th, and 75th percentile values and the whiskers represent the minimum and maximum values. n in e to h represent individual neuron preparations. Treatment groups were compared using a two−tailed t−test with or without Welch’s correction or Mann−Whitney test, depending on data distribution. P−values are provided in the figure panels.
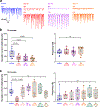
Figure 3.. Different monoclonal NMDAR−IgG antibodies but…
Figure 3.. Different monoclonal NMDAR−IgG antibodies but not Fab fragments reduce synaptic NMDAR current upon…
Figure 3.. Different monoclonal NMDAR−IgG antibodies but not Fab fragments reduce synaptic NMDAR current upon short−time incubation.
a, Representative NMDAR−mediated postsynaptic currents showing reduction of sEPSC peak amplitudes after 30 min incubation with NMDAR IgG 003−102, IgG 007−168, IgG 008−218 (100 μg/ml), but not with respective Fab (70 μg/ml) or Control IgG. b, Quantification of NMDAR−induced sEPSCs peak amplitude and frequency after incubation of Control IgG and various NMDAR IgG (ncontrol = 11; n003−102 = 9; n007−168 = 12; n008−218 = 12). c, Quantification of NMDAR−induced sEPSCs peak amplitude and frequency after incubation of Control IgG, IgG 003−102, various NMDAR Fab, and engineered IgG 003−102 fractions (ncontrol IgG = 9; n003−102 IgG = 6; n003−102 Fab = 7; n007−168 Fab = 8; n008−218 Fab = 7; n003−102 IgG attenuated = 4; n003−102 IgG half = 4). n in b and c represent individual neuron preparations. Boxes represent the median, 25th, and 75th percentile values and the whiskers represent the minimum and maximum values. Treatment groups were compared using one−way ANOVA with Sidak multiple comparison or non−parametric Kruskal−Wallis test with Dunn’s multiple comparison depending on data distribution. P−values are provided in the figure panels.
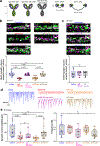
Figure 4.. IgG−003−102 and engineered long−linker 003−102…
Figure 4.. IgG−003−102 and engineered long−linker 003−102 antibodies but not IgG−007−168 and IgG−008−218 reduce NMDAR…
Figure 4.. IgG−003−102 and engineered long−linker 003−102 antibodies but not IgG−007−168 and IgG−008−218 reduce NMDAR localization in neuronal synapses.
a, Designs of engineered 003−102 antibodies. b,c, representative Airyscan images of neuronal dendrites showing GluN1 at synapses after 24h incubation (10 μg/ml) with human monoclonal IgG preparations or engineered 003−102 antibodies (upper rows) and quantification of GluN1 localization in homer1 positive synapses upon 24h antibody incubation (lower panels). IgG 003−102 and engineered 2xFv-long (003−102 scFv fragments with a long linker of 80 a.a.) show a reduction of synaptic GluN1, whereas Control IgG, non−binding IgG 003−102attenuated, 2×Fx−short (003−102 Fv fragments with a short linker of 20 a.a.) (panel b), and IgG 007−168 and IgG 008−218 (panel c) do not change GluN1 levels (left: ncontrol IgG = 11; n003−102 IgG = 16; n003−102 attenuated = 16; n2xFv−short = 13; n2×Fv−long = 15; right: ncontrol IgG = 9; n007−168 IgG = 9; n008−218 IgG = 9 dendrites). n in c and d represent synaptic volumes from individual neurons. P−values for b are Pcontrolvs003−102 = 0.934872x10⁻⁴, Pcontrolvsattenuated = 0.9853, PControlvs2×Fv−long = 0.33856×10⁻³, PControlvs2×Fv−short = 0.9782, P003−102vsattenuated = <0.1x10⁻¹⁰, P2×Fv−longvs2×Fv−short = 0.82648×10⁻⁵. d,e, Representative NMDAR−mediated postsynaptic currents (d) and quantitative analysis (e) showing reduction of sEPSC peak amplitudes after 30 min incubation with NMDAR IgG 003−102 and 2×Fv−long, but not with Control IgG, IgG 003−102 attenuated, and 2×Fv−short (ncontrol = 11; n003−102 = 9; n003−102 attenuated = 7; n2×Fv−long = 9; n2×Fv−short = 13). n in e represents individual neuron preparations. Boxes represent the median, 25th, and 75th percentile values and the whiskers represent the minimum and maximum values. Treatment groups were compared using the non−parametric Kruskal−Wallis test with Dunn’s multiple comparison.
Figure 5.. Cryo−EM structures of GluN1a−2A NMDARs…
Figure 5.. Cryo−EM structures of GluN1a−2A NMDARs in complex with IgG−007−168 and IgG−008−218.
a, Cryo−EM…
Figure 5.. Cryo−EM structures of GluN1a−2A NMDARs in complex with IgG−007−168 and IgG−008−218.
a, Cryo−EM density and a model of GluN1a−2A NMDARs in complex with IgG−007−168, showing two Fabs binding to the R1 lobes of the GluN1a−ATDs. b, A representative raw image and a 2D class average, both demonstrating NMDAR and IgG−007−168 at a 1:1 stoichiometry. c, Cryo−EM density and a model of GluN1a−2A NMDAR in complex with IgG−008−218, showing binding of two Fabs to different locations of the GluN1a−ATD R1 lobes from the IgG−007−168. A structural comparison with the Fab−008−218 complexed GluN1a−2A NMDAR showed changes in the GluN1a−2A ATD dimeric interface viewed from the ‘eye’ in the top panel. The difference in the subunit orientation is represented by the distance between Cɑs of GluN1a−Lys178 and GluN2A−Ser185. d, A representative raw image and 2D class average showing NMDAR and IgG−008−218 at 1:1 and 2:1 (NMDAR:IgG) stoichiometries.
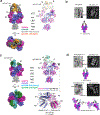
Figure 6.. Cryo−EM structures of GluN1a−2A NMDARs…
Figure 6.. Cryo−EM structures of GluN1a−2A NMDARs in complex with IgG−003−102 show distinct conformation.
a, …
Figure 6.. Cryo−EM structures of GluN1a−2A NMDARs in complex with IgG−003−102 show distinct conformation.
a, Cryo−EM density and a model of GluN1a−2A NMDAR in complex with IgG−003−102 in the ‘intact’ conformation. The binding pattern and conformation are similar to the Fab−003−102 complexed GluN1a−2A NMDAR (RMSD = 0.686 Å over 2,777 Cɑ positions). b, Cryo−EM density and a model of GluN1a−2A NMDAR in complex with IgG−003−102 in the ‘splayed’ conformation. The most flexible region lies in the ATD layer, where the cryo−EM density of one of the two GluN1a−2A ATD dimer pairs is disordered, indicating conformational flexibility. Here, the GluN1 and GluN2A ATD models are rigid−body fit into the weak density to estimate the extent of conformational change. The difference in the subunit orientation, represented by the distance between Cɑs of GluN1a−Lys178 and GluN2A−Ser185, changed robustly in the flexible portion of the ATD layer whereas little or no change in the rigid region compared to the Fab−003−102 complexed GluN1a−2A NMDAR. c, Representative raw images (top) and 2D class average (bottom) of NMDAR and IgG at 1:2 and 2:2 (NMDAR:IgG) stoichiometries. Note that the particles from the ‘splayed’ 3D class have 2:2 stoichiometry, as confirmed by 2D classification.
Figure 7.. Various patterns of binding and…
Figure 7.. Various patterns of binding and functional effects are mediated by different anti−NMDAR autoimmune…
Figure 7.. Various patterns of binding and functional effects are mediated by different anti−NMDAR autoimmune IgGs.
IgG−007−168, IgG−008−218, and IgG−003−102 bind to unique epitopes in the GluN1−ATD at different stoichiometries. While Fab fragment binding remains functionally inert and does not trigger changes in receptor localization, the IgG counterparts produce divergent effects. Specifically, IgG−003−102 inhibits synaptic activity and promotes the reduction of synaptic NMDAR. In contrast, IgG−007−168 and IgG−008−218 inhibit synaptic activity without changing synaptic NMDAR levels, indicating the critical influence of binding site and stoichiometry in shaping regulatory profiles of anti−NMDAR autoimmune IgGs.
Dalmau J. et al. Paraneoplastic anti−N−methyl−D−aspartate receptor encephalitis associated with ovarian teratoma. Ann Neurol 61, 25–36, doi:10.1002/ana.21050 (2007).
-
DOI
-
PMC
-
PubMed
Dalmau J. et al. An update on anti−NMDA receptor encephalitis for neurologists and psychiatrists: mechanisms and models. Lancet Neurol 18, 1045–1057, doi:10.1016/S1474-4422(19)30244-3 (2019).
-
DOI
-
PubMed
Graus F. et al. A clinical approach to diagnosis of autoimmune encephalitis. Lancet Neurol 15, 391–404, doi:10.1016/S1474-4422(15)00401-9 (2016).
-
DOI
-
PMC
-
PubMed
Dalmau J. et al. Anti-NMDA-receptor encephalitis: case series and analysis of the effects of antibodies. The Lancet. Neurology 7, 1091–1098, doi:10.1016/S1474-4422(08)70224-2 (2008).
-
DOI
-
PMC
-
PubMed
Dalmau J, Geis C. & Graus F. Autoantibodies to Synaptic Receptors and Neuronal Cell Surface Proteins in Autoimmune Diseases of the Central Nervous System. Physiol Rev 97, 839–887, doi:10.1152/physrev.00010.2016 (2017).
-
DOI
-
PMC
-
PubMed
Methods−only references
Furukawa H, Simorowski N. & Michalski K. Effective production of oligomeric membrane proteins by EarlyBac−insect cell system. Methods Enzymol 653, 3–19, doi:10.1016/bs.mie.2020.12.019 (2021).
-
DOI
-
PMC
-
PubMed
Tegunov D. & Cramer P. Real−time cryo−electron microscopy data preprocessing with Warp. Nat Methods 16, 1146–1152, doi:10.1038/s41592-019-0580-y (2019).
-
DOI
-
PMC
-
PubMed
Punjani A, Rubinstein JL, Fleet DJ & Brubaker MA cryoSPARC: algorithms for rapid unsupervised cryo−EM structure determination. Nature methods 14, 290–296, doi:10.1038/nmeth.4169 (2017).
-
DOI
-
PubMed
Chou TH et al. Structural insights into binding of therapeutic channel blockers in NMDA receptors. Nat Struct Mol Biol 29, 507–518, doi:10.1038/s41594-022-00772-0 (2022).
-
DOI
-
PMC
-
PubMed
Zhang Y. et al. Structural basis of ketamine action on human NMDA receptors. Nature, doi:10.1038/s41586-021-03769-9 (2021).
-
DOI
-
PubMed