. 2024 Nov;56(11):2466-2478.
doi: 10.1038/s41588-024-01890-9. Epub 2024 Sep 3.

Spatially resolved analysis of pancreatic cancer identifies therapy-associated remodeling of the tumor microenvironment

Affiliations

Spatially resolved analysis of pancreatic cancer identifies therapy-associated remodeling of the tumor microenvironment

Carina Shiau et al. Nat Genet. 2024 Nov.

Abstract

In combination with cell-intrinsic properties, interactions in the tumor microenvironment modulate therapeutic response. We leveraged single-cell spatial transcriptomics to dissect the remodeling of multicellular neighborhoods and cell-cell interactions in human pancreatic cancer associated with neoadjuvant chemotherapy and radiotherapy. We developed spatially constrained optimal transport interaction analysis (SCOTIA), an optimal transport model with a cost function that includes both spatial distance and ligand-receptor gene expression. Our results uncovered a marked change in ligand-receptor interactions between cancer-associated fibroblasts and malignant cells in response to treatment, which was supported by orthogonal datasets, including an ex vivo tumoroid coculture system. We identified enrichment in interleukin-6 family signaling that functionally confers resistance to chemotherapy. Overall, this study demonstrates that characterization of the tumor microenvironment using single-cell spatial transcriptomics allows for the identification of molecular interactions that may play a role in the emergence of therapeutic resistance and offers a spatially based analysis framework that can be broadly applied to other contexts.


Conflict of interest statement

COMPETING INTERESTS

W.L.H. and C.S. have received conference travel reimbursements from Nanostring Technologies related to presentation of some work in this study. M.T.G., J.W.R., T.K.K., Y.K., N.S., and J.M.B. were employees of Nanostring Technologies at the time of their contributions to this study. D.T.T. has received an honorarium from Nanostring Technologies, which had technology used in this manuscript. D.T.T. has received consulting fees from ROME Therapeutics and Tekla Capital not related to this work. D.T.T. has received honorariums from Moderna, Ikena Oncology, Foundation Medicine, Inc., and Pfizer that are not related to this work. D.T.T. is a founder and has equity in ROME Therapeutics, PanTher Therapeutics and TellBio, Inc., which is not related to this work. D.T.T. receives research support from ACD-Biotechne, PureTech Health LLC, Ribon Therapeutics, AVA LifeScience GmbH, and Incyte, which was not used in this work. W.L.H., J.A.G., and T.J. (U.S. Provisional Application No. 63/069,035) and W.L.H., J.A.G., C.S., J.S., and T.J. (U.S. Provisional Application No. 63/346,670) are co-inventors on provisional patents related to the pancreatic cancer states used in this study. The interests of W.L.H., and D.T.T. were reviewed and are managed by Mass General Brigham in accordance with their conflict of interest policies. T.J. is a member of the Board of Directors of Amgen and Thermo Fisher Scientific, and a co-Founder of Dragonfly Therapeutics and T2 Biosystems. T.J. serves on the Scientific Advisory Board of Dragonfly Therapeutics, SQZ Biotech, and Skyhawk Therapeutics. T.J. is also President of Break Through Cancer. His laboratory currently receives funding from Johnson & Johnson, but these funds did not support the research described in this manuscript. All other authors declare no interests related to this work.

Figures

Extended Data Figure 1.
a, Schematic of the spatial molecular imaging RNA assay workflow. RNA targets in the FFPE tissue slide that are bound to in situ hybridization (ISH) probes are subject to cyclic readout of 16 sets of reporters conjugated to four different fluorophores, which bind to the different reporter-landing domains on the ISH probes. High-resolution images are acquired during each round of reporter hybridization. Fluorophores are then UV cleaved and washed off the reporters before the slide is incubated with the next set of reporters. b, Gene overlap between the seven malignant lineage programs, the base 960-plex probe set and the 30 custom probes (color legend).
Extended Data Figure 2.
a, Overlap of cell boundaries identified by Cellpose (red) and Baysor (blue). b, Barplot showing the adjusted mutual information score across transcripts for each sample. U, untreated; T, treated; b, base panel; a, augmented panel. c, UMAP visualization of the non-malignant cells segmented by Cellpose (left) and Baysor (right). d, Two representative FOVs showing the spatial distributions of all annotated cells (left, Cellpose; right, Baysor). e, Bubble heatmap showing expression levels of select marker genes for annotated cell types (top, Cellpose; bottom, Baysor). f, Comparison of cell type counts (top) and proportions (bottom) between Cellpose (red) and Baysor (blue). g, Heatmap showing the confusion matrix of cell types annotated for cells segmented with Cellpose (x axis) and Baysor (y axis).
Extended Data Figure 3.
a, UMAP showing subsets of vascular, lymphoid, and myeloid cells. b, Proportions of major cell types (from Fig. 2c–d) across untreated and treated tumors with (left) or without (right) malignant cells included. U, untreated; T, treated; b, base 960-plex panel; a, augmented 990-plex panel. c, Comparison of malignant/non-malignant cell numbers in treated and untreated FOVs (untreated: n = 164; treated: n = 136); two-sided Mann-Whitney U test. d, Proportions of major non-malignant cell types in treated and untreated FOVs (untreated: n = 164; treated: n = 136); Benjamini-Hochberg corrected two-sided Mann-Whitney U tests. e, Comparison of silhouette scores between subsetting malignant cells (n = 27,463) into two (CLS and BSL) or three (CLS, BSL, and NRP) subtypes. Two-sided Mann-Whitney U tests. f, Expression of chemokines with a role in neutrophil recruitment (CXCL1/2/3/5/6/8) from CAFs and malignant cells in treated/untreated FOVs (untreated: n = 164; treated: n = 136); Benjamini-Hochberg corrected two-sided Mann-Whitney U tests. For boxplots in panel c-f, the box limits denote the first and third quartiles, with the median shown in the center and whiskers covering data within 1.5× the interquartile range from the box, with diamonds representing outliers.
Extended Data Figure 4.
a, Ten representative side-by-side comparisons between gland assignments manually annotated by a board-certified pathologist (outlined in red) versus those extracted by the DBSCAN algorithm (outlined in different colors). White arrows highlight differences in gland annotations for six highly concordant example FOVs. b, Distribution of the number of cells across malignant glands. c, Observed (black) and expected (gray) distributions of the interspersion of malignant glands, subset to glands in the top quartile of heterogeneity. d, Log2 fold change (y axis) between the observed and expected summed exponential-transformed distances between CAF subtypes and malignant cells across varying decay radii (x axis) for n=1000 permutations. e, Left: Depiction of the summed exponential functions (z axis height and color bar, decay radius r = 50 μm) that are generated from CD8 T cells for a representative FOV, with spatial locations of malignant subtypes shown as colored dots. Right: Log2 fold change (y axis) between the observed and expected summed exponential-transformed distances between malignant subtypes and CD8 T cells (using a malignant-centric model) for n=1000 permutations. f-g, Log2 fold change between the observed and expected summed exponential-transformed distances between malignant subtypes and CD8 T cells (using a malignant-centric model), for varying decay radii (f) and varying quantile thresholds (g), for n=1000 permutations. Data for (d-g) are presented as mean values +/− 95% confidence interval. Color legends for (f) are shared with (g). Significant results for one-sided permutation (p < 0.001) and two-sided K-S (p < 10−16) tests in panels (c-g) are indicated with square and circle symbols, respectively. Statistical test legends for panels (d-g) are shared with panel (c). h-i, Depiction of the summed exponential functions that are generated from CD8 T cells for varying decay radii r (h) and with spatial locations of shuffled malignant subtype annotations, which serves as the null distribution (i).
Extended Data Figure 5.
a, The ability of different permutation strategies to identify LR interactions using reference-based (top) and reference-free (bottom) simulated datasets. Strategy A: shuffle gene expression within each cell type; strategy B: shuffle gene expression across all cell types; strategy C: shuffle gene expression across all cell types and permute cell locations. For reference-based simulations, the PDAC SMI dataset was used as the reference. Each scenario contains 3,000 cells across 8 cell types. Gene expression profiles were simulated using negative binomial models with parameters estimated based on the specific cell type in the reference data. To simulate cell type A interacting with cell type B via ligand (L) on A and receptor (R) on B, we randomly assigned the 422 known L-R pairs to specific cell type pairs (A-B), then we increased the expression of the L gene in cell type A and the R gene in adjacent cell type B to a fixed fold change (ranging from 1 to 7). Adjacent cells were defined as the nearest four cells. For reference-free simulations, we used SRTsim to randomly generate cell locations and gene expression profiles with default settings. Each simulation scenario was replicated 5 times. Performance was measured by sensitivity, specificity, F1 score, and precision. Reg is the entropy regularization term, the default is 1.0; Regm is the marginal relaxation term, the default is 2.0; Dist_cutff is the distance cutoff for defining ‘adjacent’ cell clusters, the default is 50 μm. b, Performance evaluation of SCOTIA with varied parameters using reference-based simulation datasets from panel a. Fold change of true ligand receptor pairs was set to 2 (top) and 5 (bottom). Error bars in panel a and b indicating standard deviations.
Extended Data Figure 6.
a, Pearson correlation of receptor gene expression between malignant subtypes or ligand gene expression between CAF subtypes (two-sided t test). b, Schematic of the permutation test model used for spatial molecular imaging data. The null distribution was established by randomizing cell locations within a small range (from −20 to 20 μm) while shuffling gene expression in each FOV. c, Neighborhood composition for each cell type from one example FOV with the original (left), permuted (middle) and shuffled negative control (right) data. The negative control was constructed by shuffling cell type labels without any constraints. Neighborhood cells were defined as cells within a radius of 30 μm. d, Boxplots showing the Jaccard index of the top 5% most likely interacting LRs inferred between CAF and malignant cells with varying reg (left) and regm (right) parameters, n = 16. For boxplots, the box limits denote the first and third quartiles, with the median shown in the center and whiskers covering data within 1.5× the interquartile range from the box, with diamonds representing outliers. e, The top five strongest interacting cell type pairs inferred by using cost function equation 6 (left) and 7 (right) (Methods). Dot size represents the number of permutation test-significant LR pairs, colored based on the average LR interaction score. Bar plot indicates the average interaction strengths of each cell type pair for the treated and untreated groups. U, untreated; T, treated; b, base 960-plex panel; a, augmented 990-plex panel. f, The top five strongest interacting cell type pairs inferred by using different permutation strategies.
Extended Data Figure 7.
a, Ligand–receptor (LR) interactions significantly up- or down- regulated in treated samples between CAF and malignant cells, related to Fig. 5a. The cost functions used were equation 6 (left) and 7 (right) (Methods). Benjamini-Hochberg corrected two-sided Mann-Whitney U tests. b, Differentially enriched LR interactions inferred with a mixed effects model test (two-sided, Benjamini-Hochberg adjusted p value, Methods). c, Comparison of ligand and receptor gene expression between SCOTIA-inferred interactions versus non-interacting CAF–malignant cell pairs. Two-sided Mann-Whitney U tests (CLCF1–CNTFR: untreated, n = 158; treated: n = 89. WNT5A–FZD5: untreated, n = 170; treated: n = 98). d, Pathway enrichment analysis with ligand (left) or receptor (right) gene sets from Fig. 5b. Top pathways enriched in untreated (purple) and treated (red) tumors are shown. Benjamini-Hochberg corrected one-sided Fisher’s exact test. e, Boxplots summarizing the difference in target gene expression between significantly up- and down-regulated LR groups for five other abundant cell type pairs. Two-sided Mann-Whitney U test. Malignant–CAF, up: n = 82; down: n = 6. Malignant–macrophage, up: n = 30; down: n = 3. CAF–macrophage, up: n = 20; down: n = 19. Macrophage–CAF, up: n = 56; down: n = 29. Macrophage–malignant, up: n = 10; down: n = 3. For boxplots in panel c and e, the box limits denote the first and third quartiles, with the median shown in the center and whiskers covering data within 1.5× the interquartile range from the box, with diamonds representing outliers.
Extended Data Figure 8.
a, Pathway enrichment analysis with the ligand gene set (from CAFs, left) or receptor gene set (from malignant cells, right) that were significantly higher (red) or lower (purple) in the treated versus treatment-naïve co-culture tumoroids, related to Fig. 7c. Benjamini-Hochberg corrected one-sided Fisher’s exact test.
Extended Data Figure 9.
a, Log2 fold change (y axis) between the observed and expected summed exponential-transformed distances between malignant subtypes and iCAFs across varying decay radii (x axis) for n=1000 permutations. Data are presented as mean values ± 95% confidence interval. Significant results of one-sided permutation (p < 0.001) and two-sided K-S (p < 10−16) tests are indicated with square and circle symbols, respectively. b, Proportions of CAF subtypes per FOV (n = 320) in SMI (left) and per sample (n = 43) in single-nucleus RNA-seq (right) datasets, stratified by treatment. Box limits denote the first and third quartiles, median shown in the center, and whiskers cover data within 1.5× interquartile range, with diamonds representing outliers. Two-sided two-sample Mann-Whitney U test. c, Number of transcripts of specific IL6 family ligands expressed in CAFs (y axis) in the SMI dataset, stratified by CAF subtype. iCAF: n=102934. myCAF: n=149349. Data are presented as mean values ± 95% confidence interval. Two-sided two-sample Mann-Whitney U test.
Extended Data Figure 10.
a, The number of significant LRs enriched in treated samples as a function of varying SCOTIA parameters; adjusted p < 0.05, two-sided Mann-Whitney U. b, The power (y axis) of SCOTIA with varied parameters for identifying treatment-enriched ligand-receptor (LR) interactions. Ground truth was defined with the co-culture snRNA-seq dataset. True LR interactions were defined as those exhibiting enrichment in treated tumoroids. Both ligand and receptor genes were required to display higher expression in treated compared to untreated samples, with at least one gene having a fold change >1.5. Conversely, false LR interactions were defined by enrichment in untreated samples with the same criteria. Performance was measured by sensitivity, specificity, F1 score, and precision. Reg is the entropy regularization term, the default is 1.0; Regm is the marginal relaxation term, the default is 2.0; Dist_cutoff is the distance cutoff for defining ‘adjacent’ cell clusters, the default is 50 μm.
Fig. 1.
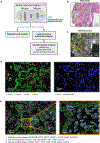
Fig. 1.. Spatial molecular imaging captures pancreatic tumor architecture at subcellular resolution.
a, Study design for human PDAC tumors (n = 13) using SMI, followed by computational analyses and experimental investigation of candidate ligand–receptor pairs. Tumors were divided into treatment-naive (n = 7) and neoadjuvant-treated (chemotherapy and radiotherapy, n = 6) cohorts, with one treated sample additionally receiving losartan. Samples were analyzed using a base 960-plex probe set, with (n = 6) and/or without (n = 9) 30 custom probes. Two tumors, one treated and one untreated, were profiled using both the base 960-plex and augmented 990-plex panels on consecutive sections. A subset of samples has matched snRNA-seq and whole transcriptome DSP (NanoString GeoMx) data. U, untreated; T, treated. b-c, Representative H&E-stained FFPE section (5 μm thickness) (b) and SMI slide image (c) of consecutive tissue sections, showing selected fields of view (FOVs, yellow rectangles, 984.96 μm × 662.04 μm). The H&E-stained FFPE section was used as a guide for SMI FOV placement to enrich for tumor areas. d, Immunofluorescence image of a representative FOV (sample U4-b, FOV #3) with antibody targets shown in the color legend. e, Spatial coordinates of RNA transcripts for canonical epithelial (green), CAF (cyan) and immune (magenta) marker genes, overlaid on the immunofluorescence image. Inset depicts a magnified view of a region within the FOV, with cell segmentation boundaries (cyan) outlined.
Fig. 2.
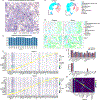
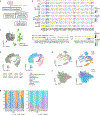
Fig. 2.. Spatial molecular imaging uncovers cell type diversity in pancreatic cancer.
a, Schematic of supervised cell typing procedure (Methods). b, Bubble heatmap showing expression levels of select marker genes for annotated cell types and subtypes. Color indicates normalized expression and dot size indicates the fraction of expressing cells. Treg, regulatory T cell; cDC, conventional dendritic cells; aDC, activated dendritic cells; pDC, plasmacytoid dendritic cells; CAF, cancer-associated fibroblast; NRP, neural-like progenitor; BSL, basal-like; CLS, classical; myCAF, myofibroblastic CAF; iCAF, inflammatory CAF. c, UMAP visualization of malignant and non-malignant cells. d, UMAP visualization of batch-corrected non-malignant cells colored by sample ID (left) and cell type annotation (right). U, untreated; T, treated; b, base 960-plex panel; a, augmented 990-plex panel. Sample ID color legend shared with panels E and F. e, UMAP showing malignant subsets colored by patient ID (left) and subtype annotations (right). f, UMAP showing CAF subsets colored by sample ID (left) and subtype annotations (right). g, Proportions of malignant (left) and CAF (right) subtypes across untreated and treated tumors.
Fig. 3.
Fig. 3.. Spatial molecular imaging reveals glandular heterogeneity and multicellular neighborhoods in pancreatic cancer.
a, (Left to right) Hematoxylin and eosin (H&E) stain, SMI-identified malignant cells (colored by subtype), localized RNA transcripts for a subset of malignant subtype marker genes, and DBSCAN-identified malignant glands (colored in shades of red and gray) for a representative FOV. b, Number of glands per FOV (left), number of cells per gland (middle), and the proportion of singular malignant cells per FOV (right), stratified by treatment condition. Untreated: n=164 (left, right), 1852 (middle). Treated: n=145 (left, right), n=1013 (middle). Data are presented as mean values ± 95% confidence interval. Two-sided two-sample Mann-Whitney U test. c, Treatment condition (color bar, top), sample ID (color bar, middle) and malignant subtype proportion (stacked proportion bar plot, bottom) for a random subset of malignant glands (n=300, 10% of total glands). U, untreated; T, treated; b, base 960-plex panel; a, augmented 990-plex panel. d, Cumulative density function for the number of cells in malignant glands, separated by malignant subtype. Bonferroni-corrected two-sided two-sample K-S test. e, Top: Schematic of the subtype composition of representative malignant glands, with heterogeneity and interspersion measurements noted (Methods). Bottom: Observed (black) and expected (gray) distributions of the heterogeneity (H, solid line)/interspersion (I, dotted line) of malignant glands (left) or the median H/I of all other glands in the FOV (middle) and sample (right) for glands in the top versus bottom quartile of H/I. f, Left: Depiction of the summed exponential functions (color bar, decay radius r = 50 μm) that are generated from malignant cells for a representative FOV, with spatial locations of CAF subtypes shown as colored dots. Right: Log2 fold change (y axis) between the observed and expected summed exponential-transformed distances between CAF subtypes and malignant cells (using a CAF-centric model) for n=1000 permutations. Data are presented as mean values +/− 95% confidence interval. Significant results for one-sided permutation (p < 0.001) and two-sided K-S (p < 10–16) tests in panels (e-f) are indicated with square and circle symbols, respectively. Statistical test legends for panel (f) are shared with panel (e).
Fig. 4.
Fig. 4.. Deciphering cell–cell interactions using Spatially Constrained Optimal Transport Interaction Analysis (SCOTIA).
a, Overview of the workflow for inferring ligand–receptor (LR) interactions from spatial molecular imaging data (Methods). Cells were clustered using DBSCAN for each cell type and only spatially adjacent source and target cell clusters were retained for downstream LR analysis (left). LR interaction scores were calculated using an optimal transport model in which the cost matrix integrates spatial distance and LR expression (middle). Statistical tests were performed to identify treatment-associated LR candidates (right). b, The inferred total interaction strength between annotated cell type pairs for untreated (left) and treated (right) tumors. Interaction strength was measured as the summed LR interaction scores for permutation test-significant LR pairs. Edge width is proportional to interaction strength and edge color reflects source cell type. c, The top five strongest interacting cell type pairs from panel b are shown for each tumor. Dot size represents the number of permutation test-significant LR pairs, colored based on the average LR interaction score. Bar plot indicates the average interaction strengths of each cell type pair for the treated and untreated groups. U, untreated; T, treated; b, base 960-plex panel; a, augmented 990-plex panel.
Fig. 5.
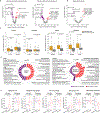
Fig. 5.. Treatment-associated ligand–receptor interactions between CAFs and malignant cells.
a, Ligand–receptor (LR) interactions significantly up- or down- regulated in treated samples between CAF and malignant cells. Benjamini-Hochberg adjusted p values calculated from two-sided Mann-Whitney U tests. b, (Top) Waterfall plot of differentially-enriched LR pairs from panel a. Significant results (Benjamini-Hochberg adjusted p < 0.05) of Mann-Whitney U (two-sided), permutation (one-sided), and mixed effects model tests (two-sided) were indicated with circle, square, and asterisk symbols, respectively. (Bottom) Heatmap showing the hierarchical clustering of patients with z-score normalized LR interaction scores. U, untreated; T, treated; b, base 960-plex panel; a, augmented 990-plex panel. c, Spatial visualization of CLCF1–CNTFR interactions in representative FOVs. Dot sizes indicating normalized gene expression. Locations indicating spatial coordinates of cell centroids. Semi-transparent dots representing non-interacting cells. d, Venn diagram of significant (Benjamini-Hochberg corrected Mann-Whitney U adjusted p < 0.05) treatment-enriched LR candidates identified by SCOTIA using three independent LR databases. e, Expression of WNT ligands (WNT2/2B/3/5A/5B/7A/7B/9A/10B/11) in CAFs and malignant cells in treated/untreated FOVs (untreated: n = 164; treated: n = 136). Two-sided Mann-Whitney U test. For boxplots, box limits denote the first and third quartiles with the median shown in the center and whiskers covering data within 1.5× the interquartile range from the box, with diamonds representing outliers.
Fig. 6.
Fig. 6.. Validation analysis of treatment-associated ligand–receptor interactions between CAFs and malignant cells.
a, (Left) Correlations between fold change of LR interaction scores (SMI data) and fold change of LR gene expression (snRNA-seq dataset). LR gene expression calculated by averaging ligand expression in CAFs and receptor expression in malignant cells. Spearman rho and two-sided p values provided. (Right) Boxplot comparing snRNA-seq gene expression between significantly enriched (n = 22) and depleted (n = 56) LR pairs identified from SMI data. Two-sided Mann-Whitney U test. b, (Left) Correlations between fold change of LR interaction scores and fold change of downstream target gene expression in the SMI data. Spearman rho and two-sided p values were provided. (Right). Boxplot summarizing target gene expression differences in the SMI data between significantly enriched (n = 13) and depleted (n = 39) LR pairs. Two-sided Mann-Whitney U test. The line in panel a and b indicated linear regression line and error bars indicated 95% confidence intervals. For boxplots in panel a and b, box limits denoted the first and third quartiles with the median shown in the center and whiskers covering data within 1.5× the interquartile range from the box, with diamonds representing outliers.
Fig. 7.
Fig. 7.. Substantiation of ligand–receptor interactions in mouse co-culture tumoroids.
a, Experimental workflow for the malignant–CAF co-culture tumoroid system established from KP (KrasG12D/wt;Trp53FL/FL) ductal cells and pancreatic stellate cells, both of which were isolated from the mouse pancreas (Methods). snRNA-seq was performed on untreated and 5-FU-treated malignant-CAF tumoroids. b, UMAP showing batch-corrected CAFs and malignant cells dissociated from malignant-CAF tumoroids at steady-state or after treatment with 5-FU. c, The correlation between fold change of LR interaction scores in the SMI data (x axis) and fold change of LR gene expression in the co-culture dataset (y axis). LR gene expression in the co-culture data was calculated by averaging ligand expression in CAFs and receptor expression in malignant cells. Spearman rho and two-sided p values were provided. The line indicated linear regression line and error bar indicated 95% confidence intervals. d, Heatmap showing a subset of candidate LR interactions that overlap between the SMI and co-culture datasets. Color bar denotes the normalized log2 fold change in interaction strength or expression between treated and untreated samples.
Fig. 8.
Fig. 8.. IL6 family signaling confers chemoresistance in human pancreatic cancer cell lines.
a, Left: Depiction of the summed exponential functions (color bar, decay radius r = 50 μm) generated from iCAFs for a representative FOV, with spatial locations of malignant subtypes shown as colored dots. Right: Log2 fold change (y axis) between the observed and expected summed exponential-transformed distances between malignant subtypes and iCAFs for n=1000 permutations. Data are presented as mean values ± 95% confidence interval. Significant results of one-sided permutation (p < 0.001) and two-sided K-S (p < 10−16) tests are indicated with square and circle symbols, respectively. b, Total number of transcripts of IL6 family ligands (IL6, LIF, CLCF1) expressed in CAFs (y axis), stratified by CAF subtype. iCAF: n=102934, myCAF: n=149349. Data are presented as mean values ± 95% confidence interval. Two-sided Mann-Whitney U test. c, Five day viability assay in three human PDAC cell lines. Fold change represents change in viability versus 5-FU alone. Each bar represents mean +/− SEM of three biological replicates. Two-sided ratio paired T test.

References

    1. Siegel RL, Giaquinto AN & Jemal A Cancer statistics, 2024. CA Cancer J Clin 74, 12–49 (2024). - PubMed
    1. Springfeld C et al. Neoadjuvant therapy for pancreatic cancer. Nat Rev Clin Oncol 20, 318–337 (2023). - PubMed
    1. Evan T, Wang VMY & Behrens A The roles of intratumour heterogeneity in the biology and treatment of pancreatic ductal adenocarcinoma. Oncogene 41, 4686–4695 (2022). - PMC - PubMed
    1. Ho WJ, Jaffee EM & Zheng L The tumour microenvironment in pancreatic cancer - clinical challenges and opportunities. Nat Rev Clin Oncol 17, 527–540 (2020). - PMC - PubMed
    1. Halbrook CJ, Lyssiotis CA, Pasca di Magliano M & Maitra A Pancreatic cancer: Advances and challenges. Cell 186, 1729–1754 (2023). - PMC - PubMed

METHODS-ONLY REFERENCES

    1. Collisson EA, Bailey P, Chang DK & Biankin AV Molecular subtypes of pancreatic cancer. Nat Rev Gastroenterol Hepatol 16, 207–220 (2019). - PubMed
    1. Guo JA et al. Abstract 5775: GLIS3 drives a neural-like malignant state enriched after neoadjuvant treatment in pancreatic cancer. Cancer Res 83, 5775–5775 (2023).
    1. Stringer C, Wang T, Michaelos M & Pachitariu M Cellpose: a generalist algorithm for cellular segmentation. Nat Methods 18, 100–106 (2021). - PubMed
    1. Pachitariu M & Stringer C Cellpose 2.0: how to train your own model. Nat Methods 19, 1634–1641 (2022). - PMC - PubMed
    1. Johnson WE, Li C & Rabinovic A Adjusting batch effects in microarray expression data using empirical Bayes methods. Biostatistics 8, 118–127 (2007). - PubMed

MeSH terms

LinkOut - more resources