. 2024 Sep;56(9):1890-1902.
doi: 10.1038/s41588-024-01874-9. Epub 2024 Sep 3.

In vivo CRISPR screens identify a dual function of MEN1 in regulating tumor-microenvironment interactions

Affiliations

In vivo CRISPR screens identify a dual function of MEN1 in regulating tumor-microenvironment interactions

Peiran Su et al. Nat Genet. 2024 Sep.

Abstract

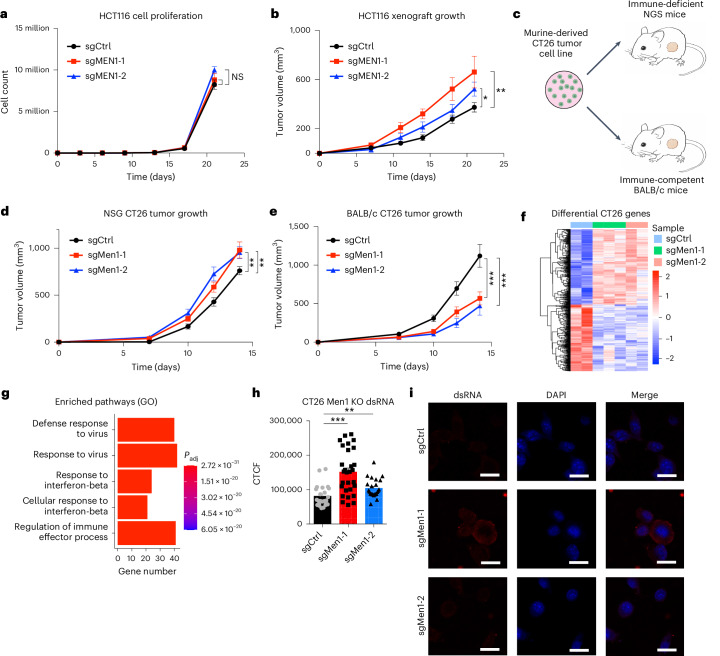
Functional genomic screens in two-dimensional cell culture models are limited in identifying therapeutic targets that influence the tumor microenvironment. By comparing targeted CRISPR-Cas9 screens in a two-dimensional culture with xenografts derived from the same cell line, we identified MEN1 as the top hit that confers differential dropout effects in vitro and in vivo. MEN1 knockout in multiple solid cancer types does not impact cell proliferation in vitro but significantly promotes or inhibits tumor growth in immunodeficient or immunocompetent mice, respectively. Mechanistically, MEN1 knockout redistributes MLL1 chromatin occupancy, increasing H3K4me3 at repetitive genomic regions, activating double-stranded RNA expression and increasing neutrophil and CD8+ T cell infiltration in immunodeficient and immunocompetent mice, respectively. Pharmacological inhibition of the menin-MLL interaction reduces tumor growth in a CD8+ T cell-dependent manner. These findings reveal tumor microenvironment-dependent oncogenic and tumor-suppressive functions of MEN1 and provide a rationale for targeting MEN1 in solid cancers.


Conflict of interest statement

F.B. is Vice President of Translational Research of Kura Oncology, Inc. The other authors declare no competing interests.

Figures

Fig. 1
Fig. 1. Parallel in vivo and in vitro CRISPR screens in A549 and in vivo specific function of MEN1 in lung cancer.
a, Schematic representation of the CRISPR screen experiment design. A549 cells with stable Cas9 expression were transduced with Epi-Drug sgRNA library and selected with puromycin for 3 days (D0). Parallel in vitro and in vivo screens were performed for 3 weeks (D21). Samples were collected for PCR amplification and NGS. b, Dropout (genes with sgRNA reduced in D21; blue dots) and enriched (genes with sgRNA increased in D21; red dots) genes in LUAD A549 xenograft compared with A549 2D cultured cells. The P values of positive and negative selections and log2(fold change) were defined and calculated using MAGeCK. MEN1 is the top ranked enriched gene. c, Xenograft tumor growth curve in immunodeficient mice inoculated with control (sgCtrl) or MEN1 knockout (sgMEN1-1, sgMEN1-2) A549 cells. Each data point represents mean ± s.e.m. tumor volumes (n = 5 in sgCtrl, sgMEN1-1 and sgMEN1-2 groups). Two-way ANOVA was used for the growth curves. *P < 0.05, **P < 0.01. d, Colony formation of A549 cells with (sgMEN1) and without (sgCtrl) knockout of MEN1. Cells were seeded in six-well plates in duplicate and allowed to grow for 8 days before staining with crystal violet. Scale bars, 7 mm. e,f, KEGG analysis of differential genes in MEN1 knockout versus control A549 cells in vitro (e) and in vivo (f). The x axis represents the number of genes. Wald tests defined in DEseq2 were used to calculate P values. g, RT–qPCR showing the expression of representative cytokine-related genes in MEN1 knockout A549 cells relative to control. Housekeeping gene TBP was used as a control. Mean ± s.e.m. of three biological replicates is shown (unpaired two-tailed Student’s t-test). h, KEGG analysis of differential genes in MEN1-low versus MEN1-high patients from the TCGA LUAD cohort. Wald tests defined in DEseq2 were used to calculate P values. i, Boxplot showing the abundance of representative cytokine genes in MEN1-high versus MEN1-low patient tumors in the TCGA LUAD cohort. Twenty patients with the highest and the lowest MEN1 expression were assigned to each group. Horizontal lines in the box represent the upper quartile, median and lower quartile from top to bottom. Vertical extending lines mark the 5th to 95th percentile (unpaired two-tailed Student’s t-test). *P < 0.05, **P < 0.01. IgA, immunoglobulin A; IL, interleukin; Padj, adjusted P value; Rep, replicate. a, Created with BioRender.com. Source data
Fig. 2
Fig. 2. MEN1 regulates MLL1 binding at repetitive genomic regions and transcription of dsRNA.
a, Correlation between menin binding sites and target gene expression as evaluated by software BETA. b, RT–qPCR showing the abundance of representative cytokine-related genes with and without siRNA silencing of MLL1 in A549 cells. Housekeeping gene TBP was used as a control. Mean ± s.e.m. of two biological replicates is shown (unpaired two-tailed Student’s t-test). *P < 0.05, **P < 0.01, ***P < 0.001. c, RT–qPCR performed in A549 cells with and without MEN1 deletion coupled with siRNA silencing of MLL1. Mean ± s.e.m. of four biological replicates is shown (unpaired two-tailed Student’s t-test). **P < 0.01, ***P < 0.001, ****P < 0.0001. d, Pileup plots showing H3K4me3 ChIP-seq and MLL1 CUT&RUN signal at 1,857 increased peak regions called by MACS2 bdgdiff. e, Heatmap showing repeat loci with differential expression in MEN1 knockout and control A549 cells in 2D culture. f, Donut plot showing the categories of upregulated repeats in MEN1 knockout A549 cells. g, Number of upregulated repeats within a given distance of the 1,857 peaks with increased H3K4me3 and MLL binding. Up-repeats are repeats that are significantly upregulated upon MEN1 knockout. Background are randomly selected repeat regions that did not show differential expression upon MEN1 knockout. The P value was calculated by one-sided paired t-test. h, Northern dot blot showing dsRNA staining in control and MEN1 knockout A549 xenograft tumors. The upper panel demonstrates dsRNA staining using the J2 antibody, and the lower panel illustrates staining of total RNA, serving as a loading control. The experiment was conducted using four biological replicates for each condition. i, Immunofluorescence imaging of control (sgCtrl) or MEN1 knockout (sgMEN1-1, sgMEN1-2) A549 cells or A549 cells treated with poly(I:C) for the detection of dsRNA (red). Red, dsRNA (J2 antibody); blue, DAPI. Scale bars, 20 μm. j, Immunofluorescence imaging of γ-H2AX of control or MEN1 knockout A549 cells or A549 cells. Green, γ-H2AX (γ-H2AX-antibody); blue, DAPI. Scale bars, 20 μm. ERV, endogenous retroviruses; ERVL, endogenous retroviral-like elements; hAT, hobo, Ac and Tam3; LTR, long terminal repeat; MaLR, mammalian apparent LTR-retrotransposons; TcMAR, Tc1/mariner. Source data
Fig. 3
Fig. 3. Antagonizing function of MEN1 and MLL1 in regulating cytokine gene signature and TME infiltration.
a, RT–qPCR performed in A549 cells with and without MEN1 deletion coupled with deletion of MAVS and/or cGAS. Mean ± s.e.m. of two biological replicates is shown (unpaired two-tailed Student’s t-test). *P < 0.05, **P < 0.01. b, A549 xenograft tumor growth rate in immunodeficient mice with and without knockout of MEN1 or in combination with MAVS and/or cGAS knockout. Each data point represents mean ± s.e.m. tumor volumes (n = 10 for each arm). Two-way ANOVA was used for statistical analysis. ***P < 0.001, ****P < 0.0001. c, Dot plot showing enriched KEGG terms of mouse differential genes from MEN1 knockout A549 xenografts. d, Quantification of neutrophil infiltration in A549 xenograft tumors with and without MEN1 deletion. Mean ± s.e.m. of neutrophil percentage from 12 tumors is shown (unpaired two-tailed Student’s t-test). e, IHC staining showing percentage of neutrophil or CD8+ T cells in MEN1-high versus MEN1-low tumor samples from a LUAD microarray (TMA). Mean ± s.e.m. of 20 tumors with the highest and the lowest MEN1 TMA scores were assigned to each group. **P < 0.01, ***P < 0.001. f, Representative IHC staining images for MEN1, myeloperoxidase (neutrophil) and CD8 (CD8+ T cell). Scale bars, 200 μm. g, A549 xenograft tumor growth rate in immunodeficient mice with and without knockout of MEN1 or in combination with anti-Ly6G antibody injection. Each data point represents mean ± s.e.m. tumor volumes (n = 5 for each arm). Two-way ANOVA was used for statistical analysis. OR, odds ratio. Source data
Fig. 4
Fig. 4. Immunocompetence-dependent tumor-promoting and -inhibiting function of MEN1 in colon cancer.
a, Cell proliferation rate of HCT116 in 2D cell culture with and without knockout of MEN1. NS, not significant. Each data point represents mean ± s.e.m. cell counts (n = 3 for each arm). Two-way ANOVA was used for statistical analysis. b, HCT116 xenograft tumor growth rate in immunodeficient mice with and without knockout of MEN1. Each data point represents mean ± s.e.m. tumor volumes (n = 5 for each arm). Two-way ANOVA was used for statistical analysis. *P < 0.05, **P < 0.01. c, Schematic view of murine CT26 engraftment experiment design. d, Tumor growth in immunodeficient NSG mice inoculated with control (sgEV) or Men1 knockout (sgMen1-1, sgMen1-2) CT26 cells. Each data point represents mean ± s.e.m. tumor volumes (n = 12 for each arm). **P < 0.01. e, Tumor growth in immunocompetent BALB/c mice inoculated with control (sgEV) or Men1 knockout (sgMen1-1, sgMen1-2) CT26 cells. Each data point represents mean ± s.e.m. tumor volumes (n = 5 for each arm). Two-way ANOVA was used for statistical analysis. ***P < 0.001. f, Heatmap showing expression value (z-score based on DESeq normalized RNA-seq counts) of differential genes from Men1 knockout versus control tumors in immunocompetent mice. Two control samples and four Men1 knockout tumors were subjected to RNA-seq analysis. g, GO analysis of differentially expressed genes in Men1 knockout versus control cells was performed and the top five terms are shown. The x axis represents the number of genes. Wald tests defined in DEseq2 were used to calculate P values. h,i, Quantification (h) and representative immunofluorescence images (i) of control (sgCtrl) or Men1 knockout (KO) CT26 cells for the detection of dsRNA. Red signal, dsRNA (J2 antibody); blue signal, DAPI. Scale bars, 20 μm. Each bar in the left-hand panel represents the mean of quantifications from 30 randomly picked fields (unpaired two-tailed Student’s t-test). **P < 0.01, ***P < 0.001. CTCF, corrected total cell fluorescence. Source data
Fig. 5
Fig. 5. scRNA-seq, CyTOF and IHC analysis confirmed increased immune cell infiltration in Men1 knockout CT26 tumors.
a, UMAP view of 7,595 single cells from scRNA-seq profiling of CT26 tumors with and without depletion of Men1, color coded by assigned clusters. Dotted circles mark cell types as determined by relevant marker genes. b, Percentages of T cells and macrophages in control (sgCtrl) and Men1 knockout (sgMen1-1, sgMen1-2) CT26 tumor samples. Mean ± s.e.m. of two to four biological replicates are shown (unpaired two-tailed Student’s t-test). *P < 0.05 c, UMAP view of 606,301 single cells from CyTOF profiling of 10 CT26 tumors with and without depletion of Men1. d, Percentage of CD45+ cells (left) and CD8+ T cells (right) of live cells captured by CyTOF. Mean ± s.e.m. of four biological replicates (sgCtrl) for control and six biological replicates for Men1 knockout (sgMen1) are shown (unpaired two-tailed Student’s t-test). e, Representative IHC images (left) and quantifications (right) showing the abundance of CD8+ T cells in control (sgCtrl) and Men1 knockout (sgMen1-1, sgMen1-2) CT26 tumors. Mean ± s.e.m. of quantifications from 10 tumor IHC sections are shown (unpaired two-tailed Student’s t-test). **P < 0.01, ***P < 0.001. Scale bars, 200 μm. DC, dendritic cells; NK cell, natural killer cell. Source data
Fig. 6
Fig. 6. Pharmacological inhibition of MEN1 reduces tumor growth in a CD8+ T cell-dependent manner and demonstrates additive effect with anti-PD-1 treatment.
a, RT–qPCR showing the relative expression of cytokine-related genes in CT26 cells treated with different dosages of menin inhibitor ziftomenib. Mean ± s.e.m. of two biological replicates are shown (unpaired two-tailed Student’s t-test). b, CT26 tumor growth with vehicle control or ziftomenib treatment at dosages of 100 and 150 mg kg−1. Each data point represents mean ± s.e.m. tumor volumes (n = 5 for each arm). Two-way ANOVA was used for statistical analysis. *P < 0.05, **P < 0.01, ***P < 0.001. c, Representative IHC images (left) and quantifications (right) showing the infiltration of CD8+ T cells in CT26 tumors with vehicle control and KO5-39 treatment. Scale bars, 100 μm. Mean ± s.e.m. of quantifications from 10 tumor IHC sections are shown (unpaired two-tailed Student’s t-test). *P < 0.05, ***P < 0.001. d, Tumor growth rate in immunocompetent mice inoculated with CT26 cells following IgG or CD8 antibody treatment in combination with vehicle control or ziftomenib (150 mg kg−1). Each data point represents mean ± s.e.m. tumor volumes (n = 10 in each group). Two-way ANOVA was used for statistical analysis. ***P < 0.001. e, Relative abundance of Cd274/PD-L1 in CT26 tumors with and without deletion of Men1 from bulk RNA-seq data (left). Mean ± s.e.m. of two biological replicates are shown (unpaired two-tailed Student’s t-test). Relative abundance of CD274/PD-L1 in MEN1-high and MEN1-low patient tumors in the TCGA COAD cohort (right). Mean ± s.e.m. of 50 patient tumors with the highest and the lowest MEN1 expression were shown (unpaired two-tailed Student’s t-test). *P < 0.05, **P < 0.01, ***P < 0.001. f, Tumor growth rate in immunocompetent mice inoculated with CT26 cells following IgG or PD-1 antibody treatment in combination with vehicle control or ziftomenib (150 mg kg−1). Each data point represents mean ± s.e.m. tumor volumes (n = 10 in each group). **P < 0.01, ****P < 0.0001. g, Schematic view of the dual function of MEN1 in modulating tumor–microenvironment interactions. MEN1 suppression reshapes MLL1 chromatin binding, triggering cytokine gene expression via MAVS- and cGAS-dependent viral mimicry response. Consequently, this leads to increased infiltration of tumor-promoting neutrophils and tumor-inhibiting CD8+ T cells in immunodeficient and immunocompetent conditions, respectively. DMSO, dimethyl sulfoxide. g, Created with BioRender.com. Source data
Extended Data Fig. 1
Extended Data Fig. 1. CRISPR screening in A549 in vivo and in vitro using the EpiDrug library, Related to Fig. 1.
(a) Composition of the EpiDrug sgRNA library. Pie chart illustrates the composition of the Epidrug sgRNA library that contains 12,472 sgRNAs targeting ~1,000 genes. (b) Number of sgRNAs detected in D0 and D21 screens. (c) Boxplot showing the distribution of log read counts of the complete 12.5k sgRNAs for D0 and D21 samples. Horizontal lines in the box represent the upper quartile, median, and the lower quartile from the top to the bottom. The vertical extending lines mark the 5th to 95th percentile. (d) Pairwise Pearson correlations of sgRNAs in D0 and D21 screens. (e) Receiver operating characteristic (ROC) curve of positive control genes in the screens. (f) Cumulative distribution of the -log10(p value) for negative selection of all Epi-Drug genes, positive and negative controls comparing D21 with D0 samples in the in vitro screens. p values (Wilcoxon test) are relative to Epi-drug candidate genes group (red line). (g) Dropout and enriched genes in D21 2D cultured cells compared to D0. The p values of positive and negative selections and log2(fold change) were defined and calculated by MAGeCK. (h) Dropout and enriched genes in D21 xenograft tumors compared to D0. The p values of positive and negative selections and log2(fold change) were defined and calculated by MAGeCK. (i) Dependency score of MEN1, MYC (oncogene) and PTEN (tumor suppressor) across 954 cancer cell lines of solid tumor types. Horizontal lines in the box represent the upper quartile, median, and the lower quartile from the top to the bottom.
Extended Data Fig. 2
Extended Data Fig. 2. MEN1 function in lung cancer cell line and xenograft models, related to Fig. 1.
(a) Western Blot of MEN1 in control (sgCtrl) and MEN1 knockout (sgMEN1-1, sgMEN1-2) in A549 cells. GAPDH was used as loading control. (b) Cell proliferation rate of control and MEN1 knockouts A549 cells. Each data point represents mean ± s.e.m. cell counts (n=3 for each arm). Two-way ANOVA test was used for statistical analysis. (c) Heatmap showing differentially expressed genes in sgCtrl and MEN1 knockout A549 cells in 2D culture. (d) KEGG analysis of downregulated genes in 2D cultured MEN1 knockout A549 cells compared to the controls. X-axis represents the number of genes. Wald tests defined in DEseq2 were used to calculate the p values. (e) Heatmap showing differentially expressed genes in sgLacZ and MEN1 knockout A549 xenograft tumors. (f) Western Blot of control (sgCtrl) and MEN1 knockout (sgMEN1-1, sgMEN1-2) LUAD H1792 cells. GAPDH was used as a loading control. (g) RT-qPCR showing the relative expression of representative cytokine-related genes in MEN1 knockout H1792 cells compared to the controls. Data were normalized by the TBP gene. Mean ± s.e.m of 2 biological replicates were shown (unpaired two-tailed Student's t-test). *: p value <0.05; **: p value <0.01. Source data
Extended Data Fig. 3
Extended Data Fig. 3. MEN1 function in lung cancer public data, related to Fig. 1.
(a-d) KEGG analysis of upregulated genes in MEN1 perturbed models compared to control using RNA-seq data from four recent publications. (Soto-Feliciano et al. (a); Issa et al. (b); Lin et al. (c); Pener et al. 2023. (d)). Gene signatures related to cytokine production and function were ranked at the top. Wald tests defined in DEseq2 were used to calculate the p values. (e) Boxplot shows relative abundance of MEN1 in the 20 MEN1-low and 20 MEN1-high patients from the TCGA LUAD cohort (wilcox, p-value = 1.451e-11). 20 patients with the highest and the lowest MEN1 expression were assigned to each group. Horizontal lines in the box represent the upper quartile, median, and the lower quartile from the top to the bottom. The vertical extending lines mark the 5th to 95th percentile. (f) Heatmap shows relative abundance of 100 genes in the KEGG term ‘Cytokine-cytokine receptor interaction’ in MEN1-low and MEN1-high patients from the TCGA LUAD cohort. (g) KEGG analysis of downregulated genes in MEN1-low compared to MEN1-high patients from the TCGA LUAD cohort. Wald tests defined in DEseq2 were used to calculate the p values.
Extended Data Fig. 4
Extended Data Fig. 4. Menin and MLL1 CUT&RUN analysis in A549 cells, related to Fig. 2.
(a) Western blot of A549 lysate and immunoprecipitation product using IgG, menin (left), and MLL1 antibody (right). (b) ChIP-qPCR of representative MEN1 and MLL1 binding sites in A549 cells with and without MEN1 knockout. Mean ± s.e.m of 3 biological replicates were shown (unpaired two-tailed Student's t-test). ***: p value <0.001; ****: p value <0.0001. (c) Heatmap showing menin CUT&RUN binding intensity in A549 cells centered around MACS peak summit. (d) Genomic distribution of menin (left) and MLL1 (right) binding sites in A549 cells. (e) BETA regulation score for menin binding and differential genes in MEN1-low compared to MEN1-high patients from the TCGA LUAD cohort. (f-h) RT-qPCR showing the relative expression of representative cytokine-related genes in A549 cells with and without siRNA silencing of MLL2 (f), MLL3 (g), UTX (h) and DOT1L (i). Data were normalized by the TBP gene. Mean ± s.e.m of biological replicates were shown (unpaired two-tailed Student's t-test). *: p value <0.05; **: p value <0.01. Mean ± s.e.m of 2-12 biological replicates were shown (unpaired two-tailed Student's t-test). Source data
Extended Data Fig. 5
Extended Data Fig. 5. MEN1 perturbation caused repeat expression alteration in A549 cells, related to Fig. 2.
(a) The distribution of peak length called by CREAM and MACS2 respectively. (b) Upper panel: Barplot showing the number of upregulated repeats in each subfamily. Lower panel: Boxplot showing permutation Z-score for upregulated repeats in each subfamily. Red color indicates statistical significance. Horizontal lines in the box represent the upper quartile, median, and the lower quartile from the top to the bottom. The vertical extending lines mark the 5th to 95th percentile. (c) Donut showing the number of upregulated repeats within and outside of the CREAM peak regions. (d) Number of downregulated repeats within a given distance of 1,857 peaks with increased H3K4me3 and MLL binding. Background are randomly selected repeat regions that do not show differential expression upon MEN1 knockout. p-value was calculated by one sided paired t-test. (e-i) ChIP-qPCR analysis of MLL1 (e), H3K4me3 (f), MEN1 (g), UTX (h) and H3K27me3 (i) in A549 cells with and without knockout of MEN1. 3’UTR of LINE1-HS and LINE1-PA2 were selected for analysis. GAPDH promoter was used as control for normalization. Mean ± s.e.m of 2 biological replicates were shown (unpaired two-tailed Student's t-test). *: p value <0.05; **: p value <0.01; ***: p value <0.001. (j) Bar plot showing the number of inverted Alus and non-inverted Alus induced by MEN1 knockout. (k) Quantifications of immunofluorescence staining of dsRNA (left panel) and γ-H2AX (right panel). For dsRNA staining, Mean ± s.e.m of quantifications from 12 randomly picked fields were shown (unpaired two-tailed Student's t-test). *: p value < 0.05; **: p value < 0.01; ***: p value < 0.001. For γ-H2AX, Mean ± s.e.m of quantifications from 95, 67 and 42 randomly picked cells were shown for sgCtrl, sgMEN1-1, and sgMEN1-2 group respectively (unpaired two-tailed Student's t-test). ****: p value < 0.0001. (l) ISG gene expression levels in MEN1-low vs MEN1-high patient tumors in the TCGA LUAD cohort. (m) qRT-PCR showing the relative expression of representative ISGs in MEN1 knockout A549 cells relative to control cells. Housekeeping gene TBP was used as control.Mean ± s.e.m of 3 biological replicates were shown (unpaired two-tailed Student's t-test). ****: p value <0.0001. Source data
Extended Data Fig. 6
Extended Data Fig. 6. MEN1 and MLL1 regulation of cytokine-related genes expression and immune cell infiltration, related to Fig. 3.
(a) Western blot showing control (sgCtrl), cGAS knockout (left; sgcGAS-1, sgcGAS-2) and MAVS knockout (right; sgMAVS-1, sgMAVS-2) A549 cells. Vinculin was used as a loading control. (b) Western blot of TBK1 and p-TBK1 in control (sgCtrl) and MEN1 knockout (sgMEN1-1, sgMEN1-2) A549 cells. Vinculin was used as a loading control. (c) Xenograft tumor growth curve in immunodeficient mice inoculated with control (sgCtrl), cGAS and MAVS knockout (sgcGAS, sgMAVS) A549 cells. Each data point represents mean ± s.e.m. tumor volumes (n=10 in sgCtrl, sgMEN1-1, and sgMEN1-2 group). Two-way ANOVA test was used for the statistical test of the growth curves. (d) Heatmap of upregulated genes (p < 0.01 and Log2(FC) > 1) in the leukocyte migration term in MEN1 knockout A549 xenograft tumors. (e) GO analysis of differentially expressed mouse genes in MEN1 knockout versus control A549 tumors. Neutrophil related terms are highlighted. Wald tests defined in DEseq2 were used to calculate the p values. (f) Representative IHC images showing the infiltration of neutrophils for control (sgCtrl) and MEN1 knockout (sgMEN1-1, sgMEN1-2) A549 xenograft tumors. (g) Bar plot showing enriched KEGG terms of 478 upregulated genes from menin inhibitor MI-389 treated MV4-11 human MLL leukemia cells. X-axis represents the number of genes. Wald tests defined in DEseq2 were used to calculate the p values. (h) Dot plot showing enriched GO terms of 478 upregulated genes from menin inhibitor MI-389 treated MV4-11 human MLL leukemia cells. Wald tests defined in DEseq2 were used to calculate the p values. (i) Percentage of infiltrated Neutrophil cells in A549 xenograft tumors with and without knockout of MEN1 or in combination with MAVS and/or cGAS knockout. Mean ± s.e.m of quantifications from 10 tumor IHC sections biological replicates were shown (unpaired two-tailed Student's t-test). *: p value <0.05. Source data
Extended Data Fig. 7
Extended Data Fig. 7. Men1’s function in immunodeficient models beyond lung cancer, related to Fig. 4.
(a) Normalized cytokine-cytokine receptor interaction signature in MEN1-low and MEN1-high patients from 32 cancer (sub-)types from the TCGA cohorts. Mean ± s.d. of 8-224 biological replicates were shown (unpaired two-tailed Student's t-test). *: p value <0.05; **: p value <0.01; ***: p value <0.001. (b) Venn diagram showing overlap of cytokine-related genes upregulated in MEN1-low compared to MEN1-high patients of lung, colon, breast, prostate and skin cancer from the TCGA cohort. (c) Western blot of control (sgCtrl) and MEN1 knockout (sgMEN1-1, sgMEN1-2) HCT116 cells. GAPDH was used as a loading control. (d) Western blot of control (sgCtrl) and Men1 knockout (sgMen1-1, sgMen1-2) CT26 cells. Vinculin was used as a loading control. (e) Colony formation of CT26 cells with and without knockout of Men1. (f) Representative IHC images and dot plot summary showing the infiltration of neutrophils for control (sgCtrl) and Men1 knockout (sgMen1-1, sgMen1-2) CT26 tumors from immunodeficient mice. Quantifications from 10 tumor IHC sections were shown (unpaired two-tailed Student's t-test). ***: p value <0.001; ****: p value <0.0001. Source data
Extended Data Fig. 8
Extended Data Fig. 8. Men1’s function in immunocompetent mouse models, related to Fig. 4.
(a) Western blot analysis of Men1 in control (sgCtrl) and Men1 knockout (sgMen1-1, sgMen1-2) 4T1 mouse breast cancer cells. Vinculin was used as a loading control. (b) Tumor growth in immunodeficient (left) and immunocompetent (right) BALB/c mice inoculated with control (sgCtrl) or Men1 knockout (sgMen1-1, sgMen1-2) 4T1 cells. Each data point represents mean ± s.e.m. tumor volumes (n=10 in sgCtrl, sgMen1-1, and sgMen1-2 group). Two-way ANOVA test was used for the statistical test of the growth curves. ****: p value <0.0001. (c) Western blot analysis of Men1 in control (sgCtrl) and Men1 knockout (sgMen1-1, sgMen1-2) in HKP1 mouse lung cancer cells (left) and DKO mouse prostate cancer cells (right). Vinculin was used as a loading control. (d) Tumor growth in immunocompetent C57BL/6J mice inoculated with control (sgCtrl) or Men1 knockout (sgMen1-1, sgMen1-2) DKO cells. Each data point represents mean ± s.e.m. tumor volumes (n=7 in sgCtrl, and sgMen1 group). Two-way ANOVA test was used for the statistical test of the growth curves. **: p value <0.01 (e) Tumor growth in immunocompetent C57BL/6J mice inoculated with control (sgCtrl) or Men1 knockout (sgMen1-1, sgMen1-2) HKP1 cells. Each data point represents mean ± s.e.m. tumor volumes (n=10 in sgCtrl, sgMen1-1, and sgMen1-2 group). Two-way ANOVA test was used for the statistical test of the growth curves. ****: p value <0.0001. (f) KEGG analysis of up-regulated genes in Men1 KO versus control CT26 tumors was performed and top 5 terms were shown. X-axis represents the number of genes. Wald tests defined in DEseq2 were used to calculate the p values. (g) KEGG analysis of down-regulated genes in Men1 KO versus control CT26 tumors. Wald tests defined in DEseq2 were used to calculate the p values. (h) DESeq normalized read counts of Ccl4, Cxcl9 and Cxcl10 in control (sgCtrl) and Men1 knockout (sgMen1-1, sgMen1-2) CT26 tumors. Mean ± s.e.m of 2 or 3 biological replicates were shown (unpaired two-tailed Student's t-test). *: p value <0.05; **: p value <0.01 (i) RT-qPCR showing the abundance of representative cytokine-related genes in Men1 knockout DKO cells (left) and HKP1 cells (right) compared to the control cells. Mean ± s.e.m of 3 biological replicates were shown (unpaired two-tailed Student's t-test). **: p value <0.01; ****: p value <0.0001. Source data
Extended Data Fig. 9
Extended Data Fig. 9. scRNA-seq and CyTOF analysis reveal increased immune cell infiltration in Men1 knockout CT26 tumors, related to Fig. 6.
(a) Schematic view of CT26 tumor scRNA-seq and CyTOF experiments. (b) Inferred copy number (CNA) for all the cells. Red indicates copy number gain and blue indicates copy number loss. (c) UMAP view of single cells from scRNA-seq profiling, color coded by tumor samples with (red) or without (blue) deletion of Men1. (d) Bar plot showing the differences of the number of cells in each sub-clusters in Men1-knockout versus control tumor samples from scRNA-seq profiling. (e) Heatmap showing the marker gene expression in each sub-clusters. (f) UMAP view of single cells from CyTOF profiling, color coded by tumor samples with (red) or without (blue) deletion of Men1. (g) Bar plot showing the differences of the number of cells in each sub-clusters in Men1-knockout versus control tumor samples from CyTOF profiling. (h) Tumor growth rate of A549 xenograft in humanized mice with and without knockout of MEN1. Each data point represents mean ± s.e.m. tumor volumes (n = 5 in sgCtrl and sgMEN1 group). Two-way ANOVA test was used for the statistical test of the growth curves. ****: p value <0.0001. (i) Bar plot showing the percentage of infiltrated CD8+ T cells in tumors with and without knockout of MEN1. Mean ± s.d. of quantifications from 6 and 8 IHC sections for sgCtrl and sgMEN1biological replicates were shown for each measurement (unpaired two-tailed Student's t-test). *: p value <0.05. (j) Representative images of CD8+ T cell staining in tumors with and without knockout of MEN1. Source data
Extended Data Fig. 10
Extended Data Fig. 10. Pharmacological inhibition of menin reduces tumor growth in syngeneic models in a similar mechanism, related to Fig. 6.
(a) qRT-PCR showing the abundance of representative cytokine-related genes with ziftomenib treatment or in combination with cGas or Mavs knockout in CT26 cells. Housekeeping gene Tbp was used as a control. Mean ± s.e.m. of 2 biological replicates were shown for each measurement (unpaired two-tailed Student's t-test). *: p value <0.05; **: p value <0.01. (b) Western blot of total and phospho-TBK1 in DMSO (Ctrl) and ziftomenib treated CT26 mouse colon cancer cells. Vinculin was used as a loading control. (c-e) RT-qPCR showing the expression of representative cytokine-related genes in lung and pancreatic cancer explant PDX tissues with DMSO (Ctrl) or ziftomenib treatment. Mean ± s.e.m. of 2-4 biological replicates were shown for each measurement (unpaired two-tailed Student's t-test). ***: p value <0.001; ****: p value <0.0001. (f) RT-qPCR showing the expression of representative cytokine-related genes in a lung cancer patient-derived organoid model with DMSO (Ctrl) or ziftomenib treatment. Mean ± s.e.m. of 3 biological replicates were shown for each measurement (unpaired two-tailed Student's t-test). **: p value <0.01; ****: p value <0.0001. (g) Western blot of menin in DMSO or ziftomenib treated A549 cells. (h) ChIP-qPCR results showing increased binding of MLL1 and H3K4me3 at selective repeat regions in A549 cells with ziftomenib treatment. Mean ± s.e.m. of 3 biological replicates were shown for each measurement (unpaired two-tailed Student's t-test). *: p value <0.05; ***: p value <0.001; ****: p value <0.0001. (i) 4T1 tumor growth with vehicle or ziftomenib treatment. Each data point represents mean ± s.e.m. tumor volumes (n=10 for each arm). Two-way ANOVA test was used for statistical analysis. ***: p value < 0.001. (j) Harvested 4T1 tumor weight from the mice treatment with vehicle or ziftomenib at the experimental endpoint. Mean ± s.e.m. of 7 and 10 biological replicates for vehicle and ziftomenib treatment group were shown for each measurement (unpaired two-tailed Student's t-test). *: p value <0.05 (k) Tumor growth of pancreatic PDX model OCIP200 in immunodeficient NOD-SCID mice treated with DMSO or ziftomenib. Each data point represents mean ± s.e.m. tumor volumes (n=5 for each arm). Two-way ANOVA test was used for statistical analysis. *: p value <0.05. a, Created with BioRender.com. Source data

References

    1. Jin, M.-Z. & Jin, W.-L. The updated landscape of tumor microenvironment and drug repurposing. Signal Transduct. Target Ther.5, 166 (2020). - PMC - PubMed
    1. Mantovani, A., Allavena, P., Sica, A. & Balkwill, F. Cancer-related inflammation. Nature454, 436–444 (2008). - PubMed
    1. Hanahan, D. & Weinberg, R. A. Hallmarks of cancer: the next generation. Cell144, 646–674 (2011). - PubMed
    1. Balkwill, F. R., Capasso, M. & Hagemann, T. The tumor microenvironment at a glance. J. Cell Sci.125, 5591–5596 (2012). - PubMed
    1. Qian, J. et al. A pan-cancer blueprint of the heterogeneous tumor microenvironment revealed by single-cell profiling. Cell Res.30, 745–762 (2020). - PMC - PubMed

MeSH terms

Substances