Randomized Controlled Trial
. 2024 Sep 4;22(1):358.
doi: 10.1186/s12916-024-03562-1.

Effects of fructan and gluten on gut microbiota in individuals with self-reported non-celiac gluten/wheat sensitivity-a randomised controlled crossover trial

Affiliations
Randomized Controlled Trial

Effects of fructan and gluten on gut microbiota in individuals with self-reported non-celiac gluten/wheat sensitivity-a randomised controlled crossover trial

Anne Mari Herfindal et al. BMC Med. .

Abstract

Background: Individuals with non-celiac gluten/wheat sensitivity (NCGWS) experience improvement in gastrointestinal symptoms following a gluten-free diet. Although previous results have indicated that fructo-oligosaccharides (FOS), a type of short-chain fructans, were more likely to induce symptoms than gluten in self-reported NCGWS patients, the underlying mechanisms are unresolved.

Methods: Our main objective was therefore to investigate whether FOS-fructans and gluten affect the composition and diversity of the faecal microbiota (16S rRNA gene sequencing), faecal metabolites of microbial fermentation (short-chain fatty acids [SCFA]; gas chromatography with flame ionization detector), and a faecal biomarker of gut inflammation (neutrophil gelatinase-associated lipocalin, also known as lipocalin 2, NGAL/LCN2; ELISA). In the randomised double-blind placebo-controlled crossover study, 59 participants with self-reported NCGWS underwent three different 7-day diet challenges with gluten (5.7 g/day), FOS-fructans (2.1 g/day), and placebo separately (three periods, six challenge sequences).

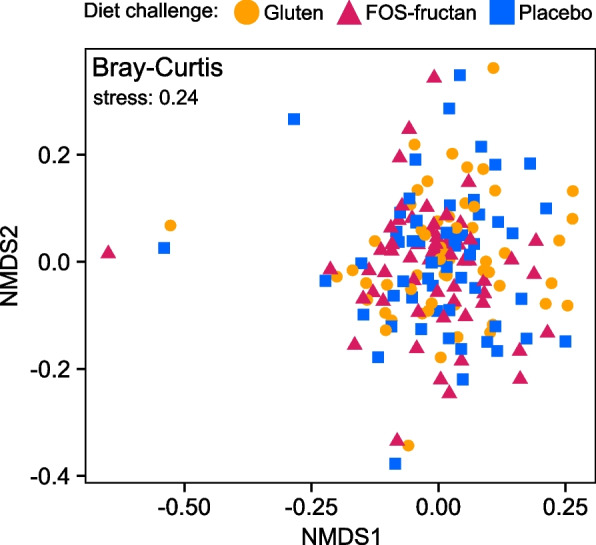
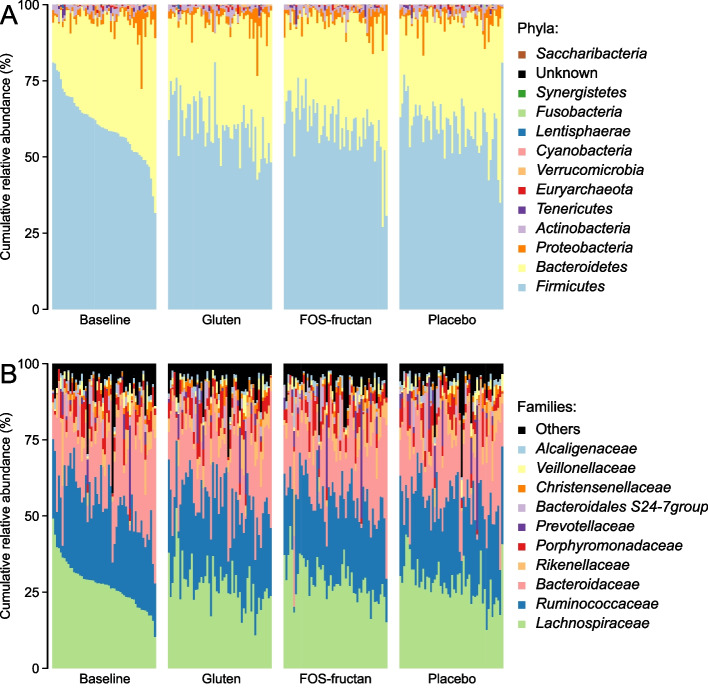
Results: The relative abundances of certain bacterial taxa were affected differently by the diet challenges. After the FOS-fructan challenge, Fusicatenibacter increased, while Eubacterium (E.) coprostanoligenes group, Anaerotruncus, and unknown Ruminococcaceae genera decreased. The gluten challenge was primarily characterized by increased abundance of Eubacterium xylanophilum group. However, no differences were found for bacterial diversity (α-diversity), overall bacterial community structure (β-diversity), faecal metabolites (SCFA), or NGAL/LCN2. Furthermore, gastrointestinal symptoms in response to FOS-fructans were generally not linked to substantial shifts in the gut bacterial community. However, the reduction in E. coprostanoligenes group following the FOS-fructan challenge was associated with increased gastrointestinal pain. Finally, correlation analysis revealed that changes in gastrointestinal symptoms following the FOS-fructan and gluten challenges were linked to varying bacterial abundances at baseline.

Conclusions: In conclusion, while FOS-fructans induced more gastrointestinal symptoms than gluten in the NCGWS patients, we did not find that substantial shifts in the composition nor function of the faecal microbiota could explain these differences in the current study. However, our results indicate that individual variations in baseline bacterial composition/function may influence the gastrointestinal symptom response to both FOS-fructans and gluten. Additionally, the change in E. coprostanoligenes group, which was associated with increased symptoms, implies that attention should be given to these bacteria in future trials investigating the impact of dietary treatments on gastrointestinal symptoms.

Trial registration: Clinicaltrials.gov as NCT02464150.

Keywords: FODMAP; Fructan; Fructo-oligosaccharides (FOS); Gastrointestinal symptoms; Gluten; Gut microbiota; Lipocalin-2 (LCN2); Neutrophil gelatinase-associated lipocalin (NGAL); Non-celiac gluten/wheat sensitivity (NCGWS); Short-chain fatty acids (SCFA).


Conflict of interest statement

The authors declare that they have no competing interests.

Figures

Fig. 1
Fig. 1
Timeline and data collection during the randomised double-blind placebo-controlled crossover study. FOS fructo-oligosaccharides, GSRS-IBS gastrointestinal symptom rating scale IBS version, IBS irritable bowel syndrome
Fig. 2
Fig. 2
Flow chart of the population selection process and overview of analysed samples/data. IBD Inflammatory bowel disease, NGAL Human neutrophil gelatinase-associated lipocalin, SCFA Short-chain fatty acids, WA Wheat allergy
Fig. 3
Fig. 3
Ordination plots from nonmetric multidimensional scaling (NMDS) of Bray–Curtis distances. Each symbol represents one follow-up sample from one participant after a given 7-day challenge (gluten, FOS-fructan, or placebo), in total 169 samples. Stress values indicate the goodness-of-fit of the NMDS. FOS fructo-oligosaccharides
Fig. 4
Fig. 4
Faecal bacterial abundances (%) at baseline and following the 7-day gluten, FOS-fructan, and placebo challenges. A Bacterial phyla (all detected) and B abundant families. Only participants with 16S sequencing data from all four time points are included in the figure (n = 54). One bar represents one participant at a given time point. Participant bars for baseline and after each challenge are ordered according to the abundance of Firmicutes (in A) and Lachnospiraceae (in B) at baseline. Taxa are ordered according to mean overall abundance. Families with a mean overall abundance ≤ 1% are displayed as ‘Others’. FOS fructo-oligosaccharides
Fig. 5
Fig. 5
Correlations between changes in faecal outcomes and changes in GI symptoms. Correlograms illustrating Spearman’s rank correlation coefficients (Rho) between changes (‘∆’) in gastrointestinal symptoms (GSRS-IBS total, pain, bloating, constipation, diarrhoea, and satiety dimension scores) and changes in faecal taxa abundances following the 7-day gluten, FOS-fructan, and placebo challenges. The change values for each diet challenge were calculated for each participant by subtracting the baseline value from the follow-up value. The colour scale indicates the strength and direction of the correlations (–0.36 < Rho < 0.32). Significant correlations (not adjusted for multiple testing) are marked with asterisks (*P < 0.05, **P < 0.01). A positive correlation indicates that increased taxon abundances are associated with increased GSRS-IBS scores, while a negative correlation indicates that reduced taxon abundances are associated with increased GSRS-IBS scores. Only the taxa that had changed differently across the diet challenges (see ‘Results’ Sect. ‘Differences in faecal bacterial abundances across diet challenges’ and Table 2) were included in the analysis. The arrows indicate the direction of change that was observed for the taxon following the different diet challenges, in accordance with results shown in Table 2 (upwards arrow indicates increased abundance, downwards arrow indicates decreased abundance). FOS fructo-oligosaccharides, GSRS-IBS gastrointestinal symptom rating scale IBS version, IBS irritable bowel syndrome
Fig. 6
Fig. 6
Correlations between faecal outcomes at baseline and changes in GI symptoms. Correlograms illustrating Spearman’s rank correlation coefficients (Rho) between changes (‘∆’) in gastrointestinal symptoms (GSRS-IBS total, pain, bloating, constipation, diarrhoea, and satiety dimension scores) following the 7-day gluten, FOS-fructan, and placebo challenges and baseline (‘Bas’) faecal A taxon abundances (−0.37 < Rho < 0.39) B α-diversity (−0.32 < Rho < 0.12), C SCFA (–0.28 < Rho < 0.27), and D NGAL/LCN2 (ng/g faeces; –0.05 < Rho < 0.38). The change values for each diet challenge were calculated for each participant by subtracting the baseline value from the follow-up value. The colour scales indicate the strength and direction of the correlations. Significant correlations (not adjusted for multiple testing) are marked with asterisk (*P < 0.05, **P < 0.01). A positive correlation indicates that higher baseline values of the faecal outcome are associated with increased GSRS-IBS scores, while a negative correlation indicates that lower baseline values of the faecal outcome are associated with increased GSRS-IBS scores. A A taxon was excluded from the correlation analysis if it was detected in less than 50% of the baseline samples. Only taxa with significant correlations are shown in the figure (not adjusted for multiple testing). C Both SCFA concentrations (‘conc’, mmol/kg faeces) and proportional levels (‘%’, of total SCFA concentration) were used in the analysis. FOS fructo-oligosaccharides, GSRS-IBS gastrointestinal symptom rating scale IBS version, IBS irritable bowel syndrome, NGAL/LCN2 neutrophil gelatinase-associated lipocalin/lipocalin 2, SCFA short-chain fatty acids

References

    1. Cooper BT, Holmes GKT, Ferguson R, Thompson RA, Allan RN, Cooke WT. Gluten-sensitive diarrhea without evidence of celiac disease. Gastroenterology. 1980;79(5):801–6. 10.1016/0016-5085(80)90432-1 - DOI - PubMed
    1. Cardenas-Torres FI, Cabrera-Chavez F, Figueroa-Salcido OG, Ontiveros N. Non-celiac gluten sensitivity: an update. Medicina (Kaunas). 2021;57(6):526. 10.3390/medicina57060526 - DOI - PMC - PubMed
    1. Henggeler JC, Veríssimo M, Ramos F. Non-coeliac gluten sensitivity: a review of the literature. Trends Food Sci Technol. 2017;66:84–92. 10.1016/j.tifs.2017.05.018 - DOI
    1. Catassi C, Elli L, Bonaz B, Bouma G, Carroccio A, Castillejo G, et al. Diagnosis of non-celiac gluten sensitivity (NCGS): the Salerno experts’ criteria. Nutrients. 2015;7(6):4966–77. 10.3390/nu7064966 - DOI - PMC - PubMed
    1. Cianferoni A. Wheat allergy: diagnosis and management. J Asthma Allergy. 2016;9:13–25. 10.2147/JAA.S81550 - DOI - PMC - PubMed

Publication types

Associated data