. 2024 Sep 4;15(1):278.
doi: 10.1186/s13287-024-03896-w.

The antifibrotic potential of IMT504: modulation of GLAST + Wnt1 + bone marrow stromal progenitors and hepatic microenvironment

Affiliations

The antifibrotic potential of IMT504: modulation of GLAST + Wnt1 + bone marrow stromal progenitors and hepatic microenvironment

Maximiliano Borda et al. Stem Cell Res Ther. .

Abstract

Background: The immunomodulatory oligodeoxynucleotide (ODN) IMT504 might harbor antifibrotic properties within the liver.

Methods: Fibrosis models were induced in mice through thioacetamide (TAA) administration and bile-duct ligation. Cre-loxP mice were utilized to identify GLAST + Wnt1 + bone marrow stromal progenitors (BMSPs) and to examine their contribution with cells in the liver. In vivo and in vitro assays; flow-cytometry, immunohistochemistry, and qPCR were conducted.

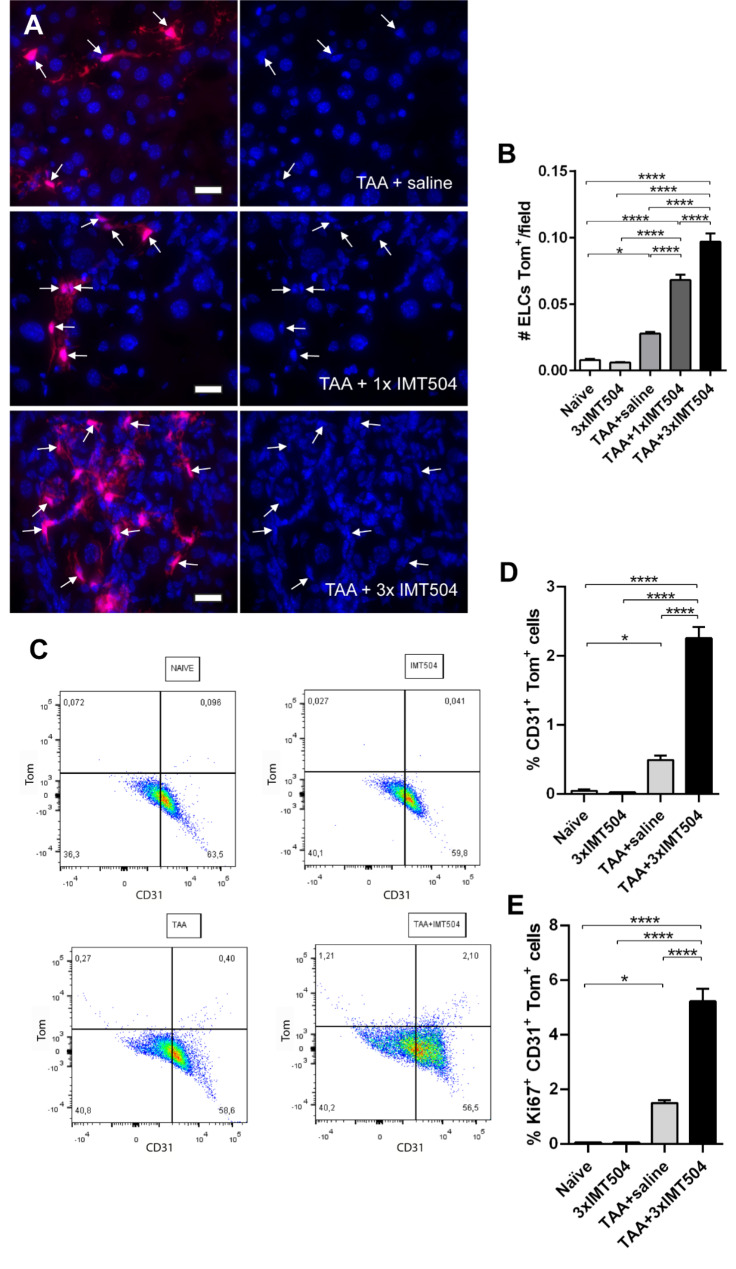
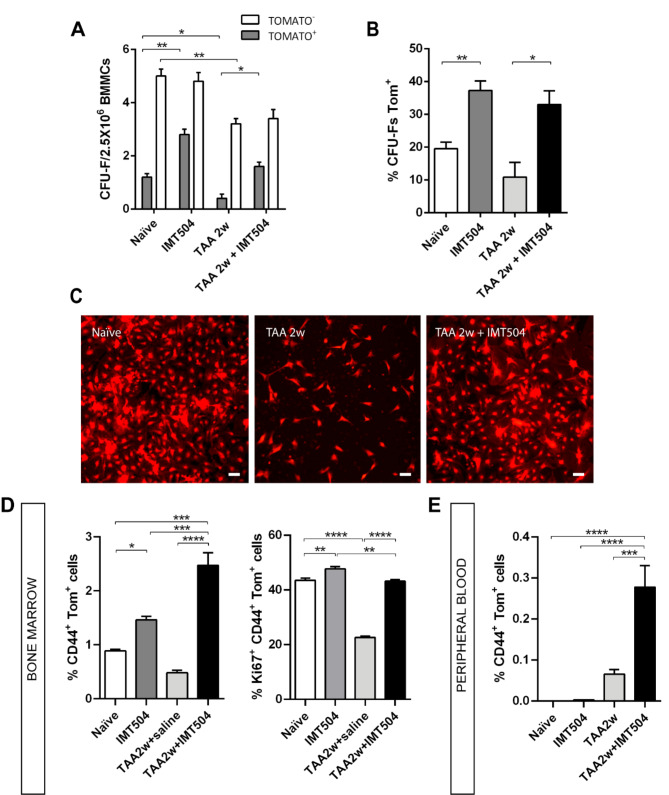
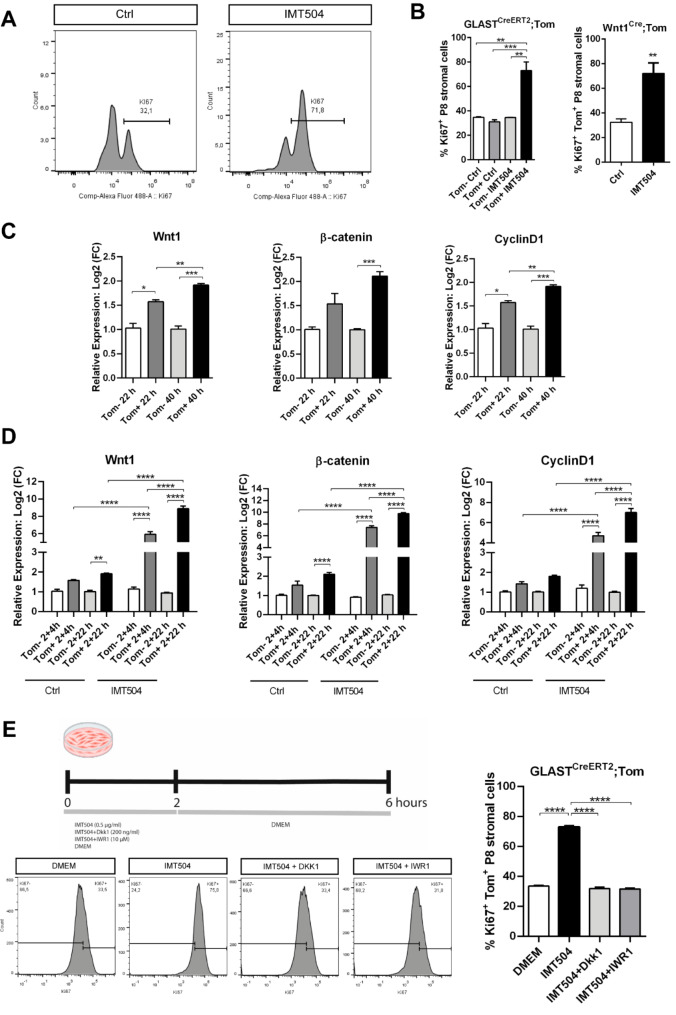
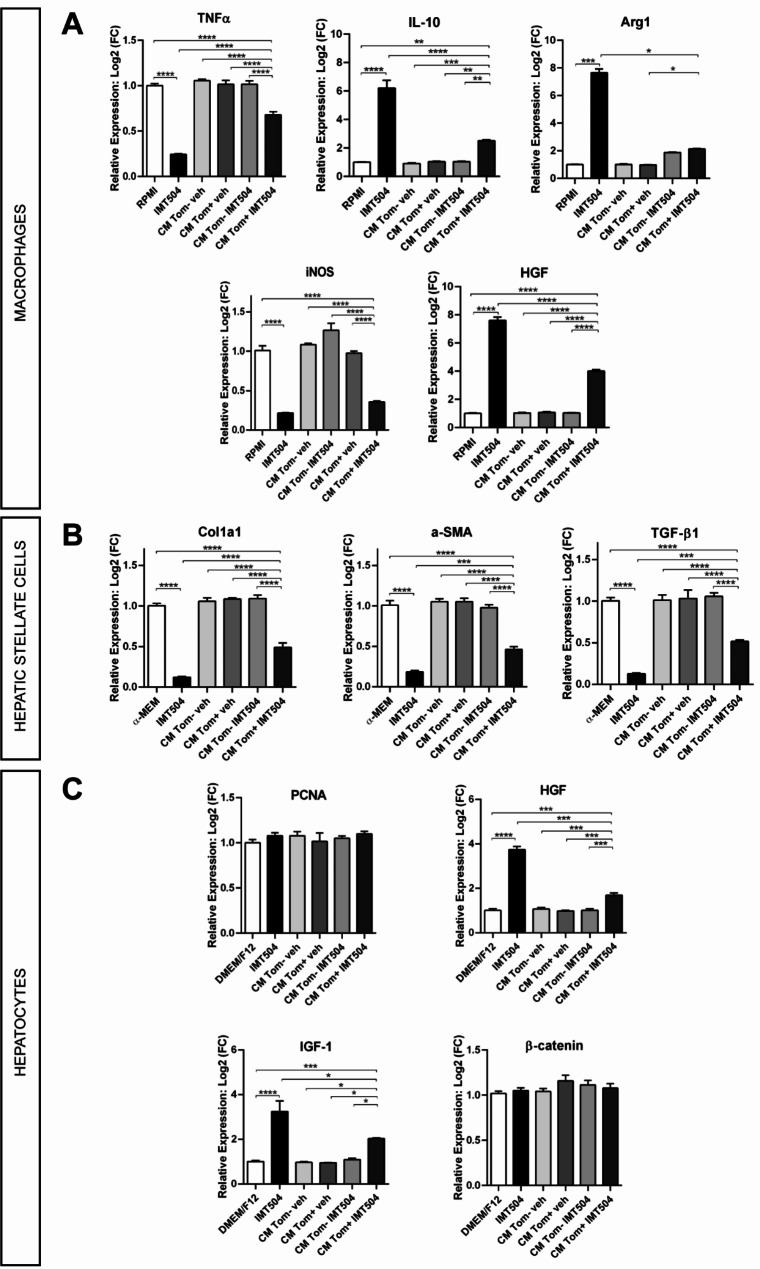
Results: IMT504 demonstrated significant inhibition of liver fibrogenesis progression and reversal of established fibrosis. Early responses to IMT504 involved the suppression of profibrogenic and proinflammatory markers, coupled with an augmentation of hepatocyte proliferation. Additionally, this ODN stimulated the proliferation and mobilization of GLAST + Wnt1 + BMSPs, likely amplifying their contribution with endothelial- and hepatocytes-like cells. Moreover, IMT504 significantly modulated the expression levels of Wnt ligands and signaling pathway/target genes specifically within GLAST + Wnt1 + BMSPs, with minimal impact on other BMSPs. Intriguingly, both IMT504 and conditioned media from IMT504-pre-treated GLAST + Wnt1 + BMSPs shifted the phenotype of fibrotic macrophages, hepatic stellate cells, and hepatocytes, consistent with the potent antifibrotic effects observed.

Conclusion: In summary, our findings identify IMT504 as a promising candidate molecule with potent antifibrotic properties, operating through both direct and indirect mechanisms, including the activation of GLAST + Wnt1 + BMSPs.

Keywords: Bone marrow stromal progenitors; GLAST; Hepatic stellate cells; Hepatocytes; Immunomodulation; Liver progenitors; Macrophages; Plasticity; Wnt.


Conflict of interest statement

The authors declare no competing interests.

Figures

Fig. 1
Fig. 1
IMT504 inhibits liver fibrogenesis. (A) Schematic view of derivation of GLASTCreERT2;Rosa26tdTomato mice and of the experimental design. (B) Representative micrographs showing Sirius red staining of liver sections obtained from GLASTCreERT2; Rosa26Tom mice (Tx P2) from different experimental groups. Scale bars: 200 μm. (C) Statistical comparisons in between groups. **p < 0.01; ***p < 0.001; ****p < 0.0001; Dunn`s multiple comparisons test; n = 4. (D) Statistical comparisons of qPCR expression levels of profibrogenic and immunomodulatory markers in whole liver tissue, and of proliferation, DNA repair, hepatocyte function and cellular stress in the parenchymatic-enriched liver fraction at 1 day after IMT504 or vehicle-application, 2 weeks after TAA-treatment onset. *p < 0.05; **p < 0.01; ***p < 0.001; ****p < 0.0001; *vs. TAA + S. Mann-Whitney: COL1a1, a-SMA, TGF-β1, IL-1β and iNOS; unpaired t-student: all other markers
Fig. 2
Fig. 2
IMT504 improves regression of liver fibrosis. (A) Schematic of the experimental design. (B) Representative micrographs showing Sirius red staining of liver sections obtained from CD1 mice of different experimental groups. Scale bars: 200 μm. (C) Statistical comparisons in between groups. *p < 0.05; ****p < 0.0001; Dunn`s multiple comparisons test; n = 4. (D) Statistical comparisons of qPCR expression levels of profibrogenic, immune/inflammation and proliferation/parenchymal function markers in whole liver tissue at 14 days after saline/IMT504 application (regression model). *p < 0.05; **p < 0.01; ***p < 0.001; ****p < 0.0001; Tukey´s multiple comparisons test; n = 3
Fig. 3
Fig. 3
IMT504 likely enhances the contribution of GLAST+ Wnt1+ BMSPs with ELCs in the liver during fibrogenesis. (A) Representative microphotographs showing ELCs Tom⁺ in GLASTCreERT2; Rosa26Tom mice (Tx P2) of different experimental groups. Scale bars: 20 μm. (B) Statistical comparisons of numbers of endothelial-like Tom+ cells; n = 4. (C) Representative flow cytometry plots showing the abundance of CD31+ Tom+ in the non-parenchyma enriched fraction of the liver. (D) Statistical comparisons of percentage of CD31+ Tom+ ELCs, in the non-parenchymatic liver fraction, from flow cytometry analyses; n = 5. (E) Statistical comparisons of percentage of Ki67+ cells among the total of CD31+ Tom+ ELCs, from flow cytometry analyses; n = 4. (B, D,E) *p < 0.05; **p < 0.01; ****p < 0.0001. Tukey`s multiple comparisons test
Fig. 4
Fig. 4
IMT504 likely enhances the contribution of GLAST+ Wnt1+ BMSPs with HLCs in the liver during fibrogenesis. (A) Representative microphotographs showing Tom+ HLCs in GLASTCreERT2; Rosa26Tom mice (Tx P2) of different treatments. Scale bars: 20 μm. (B) Statistical comparisons of numbers of Tom+ HLCs; n = 4. (C) Representative flow cytometry plots showing the abundance of Albumin+ Tom+ in the parenchyma enriched fraction of the liver. (D) Statistical comparisons of the percentage of Albumin+ Tom+ HLCs, from flow cytometry analyses; n = 4. (E) Statistical comparisons of percentage of Ki67+ cells among the total of Albumin+ Tom+ HLCs, from flow cytometry analyses; n = 4. (B, D, E) ***p < 0.001; ****p < 0.0001; Tukey`s multiple comparison test
Fig. 5
Fig. 5
In vivo effect of IMT504 on Wnt1 or GLAST-traced bone marrow mononuclear cells. (A) Statistical comparisons of numbers of CFU-Fs, Tom+ or Tom, obtained from BM-MNCs of Wnt1Cre; Rosa26Tom which were or not treated with TAA during 2 weeks, and were s.c. injected or not with IMT504. (B) Statistical comparisons of percentage of CFU-Fs Tom+. (A, B) Dunn`s multiple comparison test; n = 6. (C) Microphotographs showing representative colonies obtained from naïve, TAA 2w and TAA 2w + IMT504 treated mice. Scale bar: 50 μm. (D, left) Statistical comparisons of percentage of CD44+ Tom+ cells within the bone marrow after 2 weeks of TAA and/or IMT504 treatments, as measured by flow cytometry. (D, right) Statistical comparisons of percentage of Ki67+ cells among the total of CD44+ Tom+ cells within the bone marrow from GLASTCreERT2; Rosa26Tom (Tx P2) after 2 weeks of TAA and IMT504/saline treatments, as measured by flow cytometry. (E) Statistical comparisons of percentage of CD44+ Tom+ cells within the peripheral blood after 2 weeks of TAA and IMT504/saline treatments, as measured by flow cytometry. (D, E) Turkey`s multiple comparison test; n = 4. (A, B,D, E) *p < 0.05; **p < 0.01; ***p < 0.001; ****p < 0.0001
Fig. 6
Fig. 6
Effect of IMT504 on the proliferation of P8 GLAST+ Wnt1+ BMSPs (A) Representative histograms from flow-cytometry analyses of Tom+ cells, treated or not with IMT504, immunolabeled for Ki67, and (B) statistical comparisons in between Tom+ and/or Tom- cells of different experimental conditions obtained from different double-transgenic mice; left, Tukey´s multiple comparisons test (n = 6); right: t-student (n = 5). (C) Statistical comparisons showing changes in Wnt1, β-catenin and Cyclin-D1 mRNA expression levels, obtained by qPCR analyses, in between vehicle-treated Tom+ and Tom cells. (D) Statistical comparisons showing changes in Wnt1, β-catenin and Cyclin-D1 expression levels, obtained by qPCR analyses, in between cells which were treated with vehicle (Ctrl) or IMT504. (E) Experimental schematic figure, representative histograms from flow-cytometry analyses of Tom+ cells immunolabeled for Ki67 and statistical comparisons in between different experimental conditions. (C-E) Tukey´s multiple comparisons test; n = 4. (B-E) *p < 0.05; **p < 0.01; ***p < 0,001; ****p < 0.0001
Fig. 7
Fig. 7
Effect of IMT504 on the mobilization of P8 GLAST+ Wnt1+ BMSPs. (A) Representative images showing DAPI staining on cells which have passed through membrane pores during 4 h in a Boyden chamber assay; scale bars: 50 μm. (B) Statistical comparisons of different experimental conditions; Tukey`s multiple comparisons test; n = 5. (C) Statistical comparisons showing changes in E-cadherin expression levels, as measured by qPCR, in between Tom+ and/or Tom cells which were pretreated or not with IMT504; n = 3. (B, C) *p < 0,05; **p < 0,01; ***p < 0.001; ****p < 0.0001; Tukey´s multiple comparisons test
Fig. 8
Fig. 8
Effect of IMT504 or conditioned media (CM) from GLAST+ Wnt1+ BMSPs or Tom BMSPs treated with IMT504 or vehicle (veh) on the expression pattern of different liver cell populations. (A) Statistical comparisons of TNF-α, IL-10, arginase 1, iNOS and HGF mRNA levels in primary cultured macrophages obtained from fibrotic livers (treated with thioacetamide for 6 weeks) after different experimental treatments, as measured by qPCR. (B) Statistical comparisons of collagen 1a1, alpha-smooth muscle actin and TGF-β mRNA levels in CFSC-2G cells. (C) Statistical comparisons of PCNA, HGF, IGF-I and β-catenin mRNA levels in primary cultured hepatocytes from healthy livers. *p < 0,05; **p < 0,01; ***p < 0.001; ****p < 0.0001; Tukey´s multiple comparisons test; n = 3

Similar articles

References

    1. Aquino JB, Bolontrade MF, Garcia MG, Podhajcer OL, Mazzolini G. Mesenchymal stem cells as therapeutic tools and gene carriers in liver fibrosis and hepatocellular carcinoma. Gene Ther. 2010;17(6):692–708. 10.1038/gt.2010.10. 10.1038/gt.2010.10 - DOI - PubMed
    1. Fiore EJ, Bayo JM, Garcia MG, Malvicini M, Lloyd R, Piccioni F, Rizzo M, Peixoto E, Sola MB, Atorrasagasti C, Alaniz L, Camilletti MA, Enguita M, Prieto J, Aquino JB, Mazzolini G. Mesenchymal stromal cells engineered to produce IGF-I by recombinant adenovirus ameliorate liver fibrosis in mice. Stem Cells Dev. 2015;24(6):791–801. 10.1089/scd.2014.0174. 10.1089/scd.2014.0174 - DOI - PMC - PubMed
    1. Fiore EJ, Mazzolini G, Aquino JB. Mesenchymal Stem/Stromal cells in liver fibrosis: recent findings, Old/New caveats and Future perspectives. Stem Cell Rev. 2015;11(4):586–97. 10.1007/s12015-015-9585-9.10.1007/s12015-015-9585-9 - DOI - PubMed
    1. Baccin C, Al-Sabah J, Velten L, Helbling PM, Grunschlager F, Hernandez-Malmierca P, Nombela-Arrieta C, Steinmetz LM, Trumpp A, Haas S. Combined single-cell and spatial transcriptomics reveal the molecular, cellular and spatial bone marrow niche organization. Nat Cell Biol. 2020;22(1):38–48. 10.1038/s41556-019-0439-6. 10.1038/s41556-019-0439-6 - DOI - PMC - PubMed
    1. Baryawno N, Przybylski D, Kowalczyk MS, Kfoury Y, Severe N, Gustafsson K, Kokkaliaris KD, Mercier F, Tabaka M, Hofree M, Dionne D, Papazian A, Lee D, Ashenberg O, Subramanian A, Vaishnav ED, Rozenblatt-Rosen O, Regev A, Scadden DT. A Cellular Taxonomy of the bone marrow stroma in Homeostasis and Leukemia. Cell. 2019;177(7):1915–32. 10.1016/j.cell.2019.04.040. e1916. 10.1016/j.cell.2019.04.040 - DOI - PMC - PubMed

LinkOut - more resources