. 2024 Sep 3;22(1):534.
doi: 10.1186/s12951-024-02782-0.

MiR-100-5p-rich small extracellular vesicles from activated neuron to aggravate microglial activation and neuronal activity after stroke

Affiliations

MiR-100-5p-rich small extracellular vesicles from activated neuron to aggravate microglial activation and neuronal activity after stroke

Danqing Xin et al. J Nanobiotechnology. .

Abstract

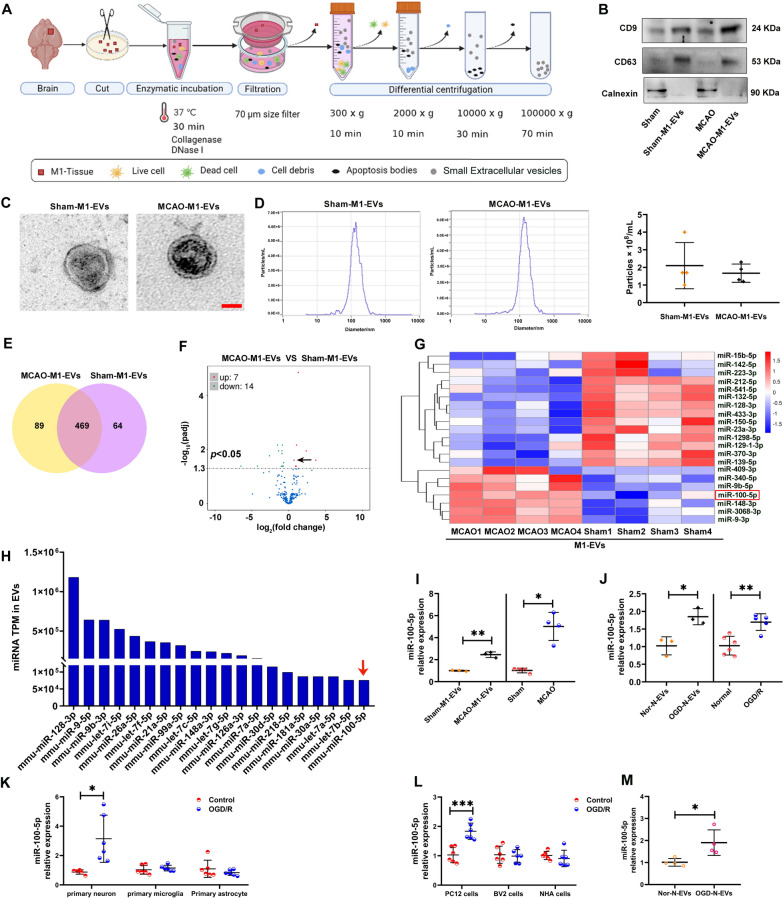
Ischemic stroke is a common cause of mortality and severe disability in human and currently lacks effective treatment. Neuronal activation and neuroinflammation are the major two causes of neuronal damage. However, little is known about the connection of these two phenomena. This study uses middle cerebral artery occlusion mouse model and chemogenetic techniques to study the underlying mechanisms of neuronal excitotoxicity and severe neuroinflammation after ischemic stroke. Chemogenetic inhibition of neuronal activity in ipsilesional M1 alleviates infarct area and neuroinflammation, and improves motor recovery in ischemia mice. This study identifies that ischemic challenge triggers neuron to produce unique small extracellular vesicles (EVs) to aberrantly activate adjacent neurons which enlarge the neuron damage range. Importantly, these EVs also drive microglia activation to exacerbate neuroinflammation. Mechanistically, EVs from ischemia-evoked neuronal activity induce neuronal apoptosis and innate immune responses by transferring higher miR-100-5p to adjacent neuron and microglia. MiR-100-5p can bind to and activate TLR7 through U18U19G20-motif, thereby activating NF-κB pathway. Furthermore, knock-down of miR-100-5p expression improves poststroke outcomes in mice. Taken together, this study suggests that the combination of inhibiting aberrant neuronal activity and the secretion of specific EVs-miRNAs may serve as novel methods for stroke treatment.

Keywords: MiR-100-5p; Microglial activation; Neuronal activity; Small extracellular vesicles; Stroke.


Conflict of interest statement

The authors declare no competing interests.

Figures

Fig. 1
Fig. 1
Chemogenetic inhibition of M1 neuronal activity after ischemic stroke. A An example of FACS sorting of c-Fos+ cells, CaMKIIα+/c-Fos+ neurons and GAD67+/c-Fos+ neurons in M1 at 6 h after stroke. Sorting of c-Fos+ cells are located right (P3). Sorting of CaMKIIα+/c-Fos+ neurons (P4) or GAD67+/c-Fos+ neurons (P5) are located in the top right quadrants, respectively. B Percentage of c-Fos+ cells by FACS. N = 3/group. C Percentage of CaMKIIα+/c-Fos+ neurons and GAD67+/c-Fos+ neurons by FACS. N = 3/group. D Representative images and quantification of CaMKIIα+ or GAD67+ cells colabeled with c-Fos+ cells in M1 of Sham and MCAO mice. N = 3/group. Scale bar = 25 μm. E Top: Schematic shows location of viral vector (AAV9-hSyn-HA-hM4(Gi)-IRES-mCitrine (hM4Di)) injections (green) in M1. Scale bar = 100 μm. Bottom: Representative imaging shows expression of the mCitrine tag around M1. Scale bar = 50 μm. F Experimental design. Two weeks prior to surgery, viral administration was performed under anesthesia. Viral vector contains the DREADDs transgene (hM4Di, AAV9-hSyn-HA-hM3(Dq)-IRES-mCitrine (hM3Dq)). The intraperitoneal (i.p.) injection of clozapine-N-oxide (CNO) (1 mg/kg body weight) or Vehicle was administered in conscious mice for 5 times. CNO or Vehicle (once every 24 h, 3 times in total) was injected intraperitoneally 3 d before MCAO. The fourth injection of CNO or Vehicle was administered at 30 min before MCAO. The last injection of CNO or Vehicle was administered at 23.5 h after MCAO. The chosen doses of CNO did not induce any behavioral signs of seizure activity. At 24 h post-surgery, the tissues were collected for next experiment. G hM4Di or hM3Dq (green, infected cell) in M1, co-localize with MAP2 staining (red) 15 d after virus infection. Scale bar = 25 μm. H Western blot measurements of c-Fos protein expression in M1 and injury core of hM4Di + MCAO mice or hM3Dq + MCAO mice following Vehicle or CNO treatment at 24 h after stroke. The levels of c-Fos protein were quantitated by normalizing to β-actin. N = 4/group. All data are represented as mean ± SD. ** p < 0.01, *** p < 0.001 according to t-test in B-D. * p < 0.05 according to Kruskal–Wallis test in H (in M1). M1 primary motor cortex, M2 secondary motor cortex, TTC 2,3,5-triphenyltetrazolium chloride monohydrate, WB Western blot, IF Immunofluorescence staining, IHC Immunohistochemistry, HE Hematoxylin Eosin
Fig. 2
Fig. 2
Decreasing M1 neuronal activity rescued the neurological impairment and brain infarct area after ischemic stroke in mice. Neurological tests, including mNSS A (N = 7 for hM3Dq + MCAO + Vehicle group and hM3Dq + MCAO + CNO group, N = 10 for hM4Di + MCAO + Vehicle group and hM4Di + MCAO + CNO group), negative geotaxis test B (N = 10/group), Kondziella’s inverted screen test C (N = 7 for hM3Dq + MCAO + Vehicle group and hM3Dq + MCAO + CNO group; N = 10 for hM4Di + MCAO + Vehicle group and N = 8 for hM4Di + MCAO + CNO group), and grid-walking test D (N = 9 for hM3Dq + MCAO + Vehicle group, hM3Dq + MCAO + CNO group, and hM4Di + MCAO + Vehicle group, N = 8 for hM4Di + MCAO + CNO group). E Representative TTC staining of brain sections from hM3Dq + MCAO or hM4Di + MCAO mice following Vehicle or CNO treatment, the infarct area is shown in white. F Bar graph shows percentages of infarct area of indicated groups. N = 4/group. G Top: Representative TUNEL staining of brain sections from mice hM3Dq + MCAO or hM4Di + MCAO mice following Vehicle or CNO treatment. Scale bar = 1 mm. Bottom: Magnification of white frames in M1 and injury core. Scale bar = 100 μm. H Bar graph shows percentages of apoptosis rate of indicated groups. N = 4/group. All data are represented as mean ± SD.* p < 0.05, ** p < 0.01, *** p < 0.001 according to Kruskal–Wallis test in AC. * p < 0.05, ** p < 0.01, *** p < 0.001 according to two-way ANOVA followed by the Bonferroni’s post hoc test in D, F, H
Fig. 3
Fig. 3
Decreasing M1 neuronal activity inhibited microglia activation and inflammatory response in M1 of the ischemic brain. A, I Representative immunofluorescent staining for Iba-1 in the M1 of indicated groups, Scale bar = 25 μm. B, J Bar graph shows the number of Iba-1+ cell of indicated groups, N = 4/group. C, K Representative images of Iba1+ microglia and the Sholl analysis, the intersection number per radius over the distance from the cell body was displayed graphically in the curve. Scale bar = 10 μm. DF, LN The interactions, cell body area and maximum branch length were analyzed. N = 3/group. G, O Western blot measurements of Iba-1, IL-1β, TNF-α and Arg-1 protein levels in M1 of indicated groups. H, P The levels of Iba-1, IL-1β, TNF-α and Arg-1 were quantitated by normalizing to β-actin. N = 4/group. All data are represented as mean ± SD. * p < 0.05, ** p < 0.01, *** p < 0.001 according to t-test in A, H (IL-1β, TNF-α and Arg-1), DF, J, LN and P. * p < 0.05 according to Mann–Whitney U test in H (Iba-1)
Fig. 4
Fig. 4
Neuronal activity altered the expression of EVs-miRNA in M1 following ischemia stroke. A Schematic of the EVs isolation method from the M1 of Sham and MCAO mice (referred to as Sham-M1-EVs and MCAO-M1-EVs). B Western blot analysis of brain lysate and associated EVs (Sham-M1-EVs and MCAO-M1-EVs) for identified specific EVs proteins, as well as common EVs (CD9, CD63) and non‐EVs (calnexin) protein markers. C Transmission electron microscopy (TEM) images of isolated Sham-M1-EVs and MCAO-M1-EVs. Scale bar = 50 nm. D Size distribution of the isolated Sham-M1-EVs and MCAO-M1-EVs determined using ZetaView. The quantity of Sham-M1-EVs group and MCAO-M1-EVs group were measured using ZetaView. N = 3/group. E EVs miRNA abundance analysis by next-generation sequencing. Venn diagrams of the number of miRNA in M1-derived EVs from Sham mice (referred to as Sham-M1-EVs) and MCAO mice (referred to as MCAO-M1-EVs). The number in the center refers to miRNAs with no specific expression in M1-EVs studied. F Volcano plot of differential miRNA expression. The black dots represent the miRNA with no significant difference, the red dots represent the significantly upregulated differential miRNA, and the green dots represent the significantly downregulated differential miRNA. Black arrow indicates miR-100-5p. G Heatmap displaying of differential miRNA expression. MiRNA expression is hierarchically clustered on the y-axis, and M1-EVs from Sham and MCAO mice are hierarchically clustered on the x-axis. High expression based on normalized Ct is shown in red and low expression in blue. H The top 20 abundant miRNA in Sham-M1-EVs and MCAO-M1-EVs are shown. I qRT-PCR measurements of miR-100-5p in Sham-M1-EVs and MCAO-M1-EVs (N = 3 pools within Sham-M1-EVs group, and MCAO-M1-EVs group, 4 brains per pool), and M1 of Sham and MCAO mice (N = 4/group). J qRT-PCR measurements of miR-100-5p in Nor-N-EVs and OGD-N-EVs (N = 3/group), and normal and OGD/R-exposed PC12 cells (N = 6 for Normal group and N = 5 for OGD/R group). K Primary neuron, microglia and astrocytes were exposed to OGD/R, the expression of miR-100-5p in cells were detected by qRT-PCR. N = 5 for Control group in primary neuron and N = 6 for others group. L PC12 cells, BV-2 cells and fetal-derived normal human astrocytes (NHA) were exposed to OGD/R, the expression of miR-100-5p in cells were detected by qRT-PCR. N = 6/group. M BV-2 cells were incubated with OGD-N-EVs or OGD-N-EVs for 24 h, the expression of miR-100-5p in cells were detected by qRT-PCR. N = 4/group. All data are represented as mean ± SD. * p < 0.05, ** p < 0.01, *** p < 0.001 according to t-test in I (left), J, K (primary neuron) and L. * p < 0.05 according to Mann-Whitney U test in I (right) and M.
Fig. 5
Fig. 5
Neuronal activity-releasing EVs led to microglia activation in vitro. A TEM images of EVs from normal PC12 cells (referred to as Nor-N-EVs) and OGD/R-exposed PC12 cells (referred to as OGD-N-EVs). Scale bar = 50 nm. B The Size distribution and quantity of the isolated Nor-N-EVs and OGD-N-EVs were determined using ZetaView. N = 3/group. C Western blot analysis of Nor-N-EVs and OGD-N-EVs for identified specific EVs proteins, as well as common EVs (CD9, CD63) and non-EVs (Calnexin) protein markers. D Top: An in vitro experiment illustration for CD63 labeled EVs. Bottom: CD63 plasmid was transfected with PC12 cells for 48 h and then exposed OGD/R or not, finally collected EVs (referred to as CD63-labeled OGD-N-EVs and CD63-labeled Nor-N-EVs). The collected EVs incubated with BV-2 cells or PC12 cells for 24 h. Then staining with Iba-1 (red) or NeuN (red) and DAPI (blue). Scale bar = 20 μm. E Top: An in vitro experiment illustration for PKH67-labeled OGD-N-EVs. Bottom: PKH67-labeled OGD-N-EVs were engulfed by Iba-1 labeled primary microglia and BV-2 cells at 24 h following EVs treatment. PKH67-labeled OGD-N-EVs were engulfed by NeuN labeled primary neuron and PC12 cells at 24 h following EVs treatment. Scale bar = 50 μm. F Western blot measurements of IL-1β and Arg-1 protein of BV-2 cells and primary microglia 24 h following Nor-N-EVs and OGD-N-EVs treatment. G The levels of IL-1β and Arg-1 of BV-2 cells were quantitated by normalizing to β-actin. N = 4/group. H The levels of IL-1β and Arg-1 of primary microglia were quantitated by normalizing to β-actin. N = 4/group. All data are represented as mean ± SD. * p < 0.05 according to one-way ANOVA followed by Bonferroni’s post hoc test
Fig. 6
Fig. 6
MiR-100-5p showed positive feedback of neuronal activity. A PC12 cells were transfected with hM3Dq plasmid for 48 h, then fixed and taken the images. Scale bar = 20 μm. B Primary neuron were transfected with the hM3Dq plasmid for 48 h, then 10 μM CNO was added to cell cultures, and the firing of action currents in primary neurons was recorded. C After PC12 cells were transfected with hM3Dq plasmid for 48 h, 3 μM CNO or the Vehicle control was added to detect calcium imaging by confocal microscopy. Scale bar = 50 μm. D After PC12 cells were transfected with hM3Dq plasmid for 48 h, 3 μM CNO or the Vehicle control was added to detect the intracellular Ca2+ changes by microplate reader. N = 6/group. E The level of c-Fos was measured 48 h following hM3Dq plasmid transfection with western blot. The levels of c-Fos were quantitated by normalizing to β-actin. N = 4/group. F The level of miR-100-5p in cells from hM3Dq plasmid transfection with PC12 cells. N = 4/group. G PC12 cells were incubated with OGD-N-EVs or OGD-N-EVs for 24 h, the expression of miR-100-5p in PC12 cells were detected by qRT-PCR. N = 4/group. H The level of miR-100-5p in cells from miR-100-5p mimics (mimics) treatment with PC12 cells. I Primary neuron was transfected with the mimics or NC for 48 h, and the firing of action currents in primary neurons was recorded. N = 6/group. J After PC12 cells were transfected with miR-100-5p mimics (mimics) for 48 h, calcium imaging was detected by confocal microscopy. Scale bar = 50 μm. K Ca2+ concentrations in PC12 cells were measured 48 h following miR-100-5p mimics (mimics) treatment with a microplate reader. N = 6/group. L The level of c-Fos mRNA was measured at 24 h following miR-100-5p mimics (mimics) treatment by qRT-PCR. N = 4/group. M The level of c-Fos was measured 48 h following miR-100-5p mimics (mimics) treatment with western blot. The levels of c-Fos were quantitated by normalizing to β-actin. N = 4/group. N After PC12 cells were transfected with hM4Di plasmid with/without OGD/R-exposure or miR-100-5p mimics (mimics) treatment, and then the calcium imaging was detected by confocal microscopy. Scale bar = 50 μm. O PC12 cells were transfected with hM4Di plasmid with/without OGD/R-exposure or miR-100-5p mimics (mimics) treatment, and then measured Ca2+ concentrations by a microplate reader. N = 6/group. P CCK8 measurements of PC12 cell viability following 50 nM of miR-100-5p mimics (mimics) and its negative control (NC) treatment. N = 6/group. All data are represented as mean ± SD. * p < 0.05, ** p < 0.01, *** p < 0.001 according to t-test
Fig. 7
Fig. 7
MiR-100-5p activated innate immune response and neurotoxicity via its U18U19G20-containing motif and direct association with TLR7. A Top: Experimental design, PC12 cells were transfected with 50 nM NC or miR-100-5p mimics for 24 h, and collected EVs (referred as NC-EVs and miR-100-5p-EVs). Bottom: Primary microglia and BV-2 cells were incubated with miR-100-5p-EVs (5-Carboxyfluorescein, FAM) (green) for 24 h. Cells were then fixed and stained with Iba-1 (red). Scale bar = 25 μm. B Western blot measurements of IL-1β, TNF-α, Arg-1 and TLR7 protein of BV-2 cells following NC-EVsand miR-100-5p-EVs treatment for 24 h. N = 4/group. C Western blot measurements of IL-1β, TNF-α, Arg-1 and TLR7 protein of BV-2 cells following 50 nM miR-100-5p mimics (mimics) and its negative control (NC) treatment for 48 h. The levels of IL-1β, TNF-α, Arg-1 and TLR7 were quantitated by normalizing to β-actin. N = 4/group. D Nucleotide sequences of miR-100-5p and its various U/A and or G/A mutants. The U18U19G20U21 motif sequence is highlighted in gray shade. The seed sequences are highlighted in blue shade. U/A and or G/A mutants are in red. E Western blot measurements of IL-1β protein of BV-2 cells following 50 nM of miR-100-5p or its various U/A and or G/A mutants treatment. N = 4/group. F HEK293T cells were transfected with TLR7 plasmid (green) and with/without miR-100-5p-FAM (green). Scale bar = 20 μm. G Representative immunoprecipitation (IP) using anti-IgG or anti-TLR7 antibody in HEK293T cells followed by western blot for TLR7. H qRT-PCR analysis of miR-100-5p associated with TLR7. N = 4/group. I Western blot measurements of IL-1β of HEK293T cells following 50 nM of miR-100-5p mimics (mimics) with/without TLR7 plasmid (2 µg/mL) transfection. The levels of IL-1β were quantitated by normalizing to β-actin. N = 4/group. J Expression of TLR7 in BV-2 cells was knocked down via siRNA technology. TLR7 and IL-1β protein was measured with western blot. The levels of TLR7 and IL-1β were quantitated by normalizing to β-actin. N = 4/group. K BV-2 cells were transfected with TLR7 siRNA (50 nM) and miR-100-5p mimics (mimics) (50 nM) or its negative control (NC) for 48 h. The levels of IL-1β were investigated by western blot. The levels of IL-1β were quantitated by normalizing to β-actin. N = 4/group. All data are represented as mean ± SD. * p < 0.05, ** p < 0.01 according to t-test in B, C, E, H, J and K. * p < 0.05, ** p < 0.01, *** p < 0.001 according to one-way ANOVA followed by Bonferroni’s post hoc test in I
Fig. 8
Fig. 8
MiR-100-5p activated NF-κB via TLR7 signaling. A Western blot measurements of NF-κB and phosphorylated NF-κB (p-NF-κB) levels in the M1 of each group. N = 4/group. B BV-2 cells were treated with 50 nM of miR-100-5p mimics (mimics) and its negative control (NC) for 48 h, then stained with NF-κB (red) and DAPI (blue). Scale bar = 20 μm. C BV-2 cells were treated with 50 nM of miR-100-5p mimics (mimics) and its negative control (NC) for 48 h. Then cells were lysed and tested for NF-κB and p-NF-κB. N = 4/group. D BV-2 cells were treated with 50 nM of miR-100-5p mimics (mimics) and its mutant for 48 h, cells were lysed and tested for NF-κB and p-NF-κB. N = 4/group. E Expression of TLR7 in BV-2 cells was knocked down via siRNA technology. Then, NF-κB and p-NF-κB protein were measured with western blot. The levels of NF-κB and p-NF-κB was quantitated by normalizing to β-actin. N = 4/group. F BV-2 cells were transfected with TLR7 siRNA (50 nM) and miR-100-5p mimics (mimics) (50 nM) or its negative control (NC) for 48 h. The levels of NF-κB and p-NF-κB were quantitated by normalizing to β-actin. N = 4/group. All data are represented as mean ± SD. * p < 0.05 according to t-test except D (mimics vs mut U19-A). * p < 0.05 according to Mann–Whitney U test in D (mimics vs mut U19-A)
Fig. 9
Fig. 9
Knockdown of miR-100-5p by antagomiR could partially prevented stroke via reducing inflammation and improving organ function. A Experimental design. The mice were administered with miR-100-5p antagomiR (miR-100-5panta) (100 pmol) or the control antagomiR (controlanta) via unilateral stereotaxic microinjection into intracerebroventricular 48 h prior to MCAO. Twenty-four hours after MCAO, the mice were behavioral studies, infarction, inflammation and apoptosis examination. i.c.v: intracerebroventricular. B Twenty-four hours after MCAO, miR-100-5p abundance was measured in M1 and core with qRT-PCR. N = 4/group. Neurological tests, including mNSS C, negative geotaxis test D, and Kondziella’s inverted screen test E were performed in MCAO mice following miR-100-5panta (100 pmol) or controlanta pre-treatment. N = 8/group. F Representative TTC staining of brain sections from MCAO mice following miR-100-5panta or controlanta pre-treatment, the infarct area is shown in white. Bar graph shows percentages of infarct area of indicated groups. N = 4/group. G Representative TUNEL staining of brain sections from MCAO mice following miR-100-5panta or controlanta pre-treatment. Scale bar = 50 μm. Bar graph shows percentages of apoptosis rate of indicated groups. N = 4/group. H Iba-1 staining of brain sections from MCAO mice following miR-100-5panta or controlanta pre-treatment. Scale bar = 25 μm. Bar graph shows the number of Iba-1+ cell of indicated groups. N = 4/group. I Representative images of Iba1+ microglia and the Sholl analysis, the intersection number per radius over the distance from the cell body was displayed graphically in the curve. Scale bar = 10 μm. JL The interactions, cell body area and maximum branch length were analyzed. N = 3/group. All data are represented as mean ± SD. * p < 0.05, ** p < 0.01, *** p < 0.001 according to t-test except E. ** p < 0.01 according to Mann–Whitney U test in E

References

    1. George PM, Steinberg GK. Novel stroke therapeutics: unraveling stroke pathophysiology and its impact on clinical treatments. Neuron. 2015;87:297–309. 10.1016/j.neuron.2015.05.041 - DOI - PMC - PubMed
    1. Hartings JA, Rolli ML, Lu X-CM, Tortella FC. Delayed secondary phase of peri-infarct depolarizations after focal cerebral ischemia: relation to infarct growth and neuroprotection. J Neurosci. 2003;23:11602–10. 10.1523/JNEUROSCI.23-37-11602.2003 - DOI - PMC - PubMed
    1. Chamorro Á, Dirnagl U, Urra X, Planas AM. Neuroprotection in acute stroke: targeting excitotoxicity, oxidative and nitrosative stress, and inflammation. Lancet Neurol. 2016;15:869–81. 10.1016/S1474-4422(16)00114-9 - DOI - PubMed
    1. von Bornstädt D, Houben T, Seidel JL, Zheng Y, Dilekoz E, Qin T, et al. Supply-demand mismatch transients in susceptible peri-infarct hot zones explain the origins of spreading injury depolarizations. Neuron. 2015;85:1117–31. 10.1016/j.neuron.2015.02.007 - DOI - PMC - PubMed
    1. Hossmann KA. Periinfarct depolarizations. Cerebrovasc Brain Metab Rev. 1996;8:195–208. - PubMed

MeSH terms

LinkOut - more resources