. 2024 Oct 28;52(19):11500-11518.
doi: 10.1093/nar/gkae752.

LAP2alpha facilitates myogenic gene expression by preventing nucleoplasmic lamin A/C from spreading to active chromatin regions

Affiliations

LAP2alpha facilitates myogenic gene expression by preventing nucleoplasmic lamin A/C from spreading to active chromatin regions

Simona Ferraioli et al. Nucleic Acids Res. .

Abstract

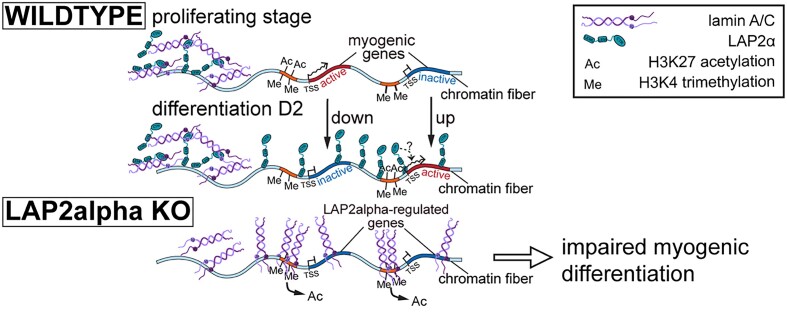
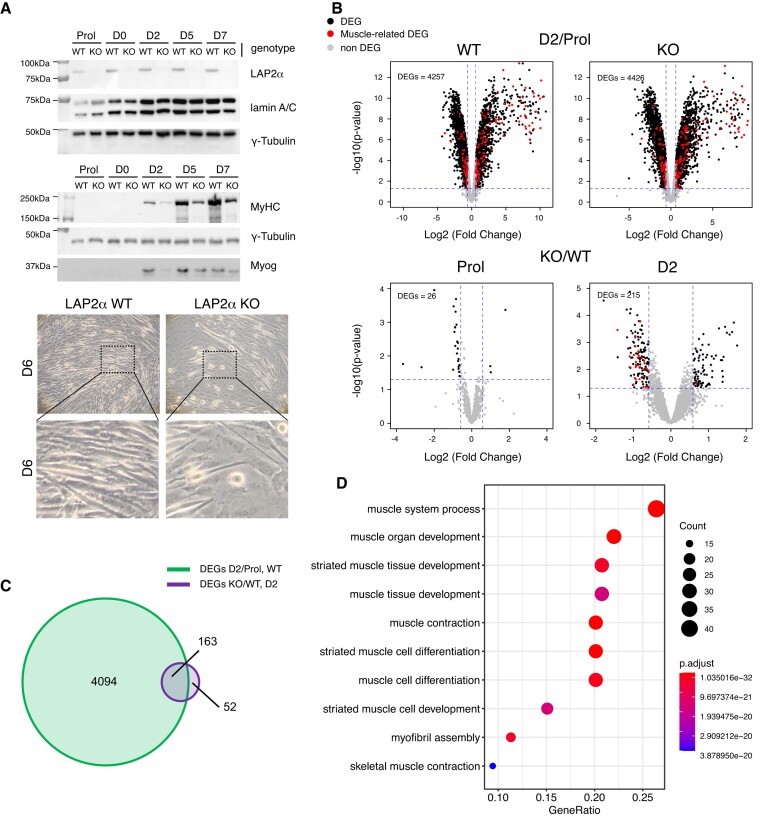
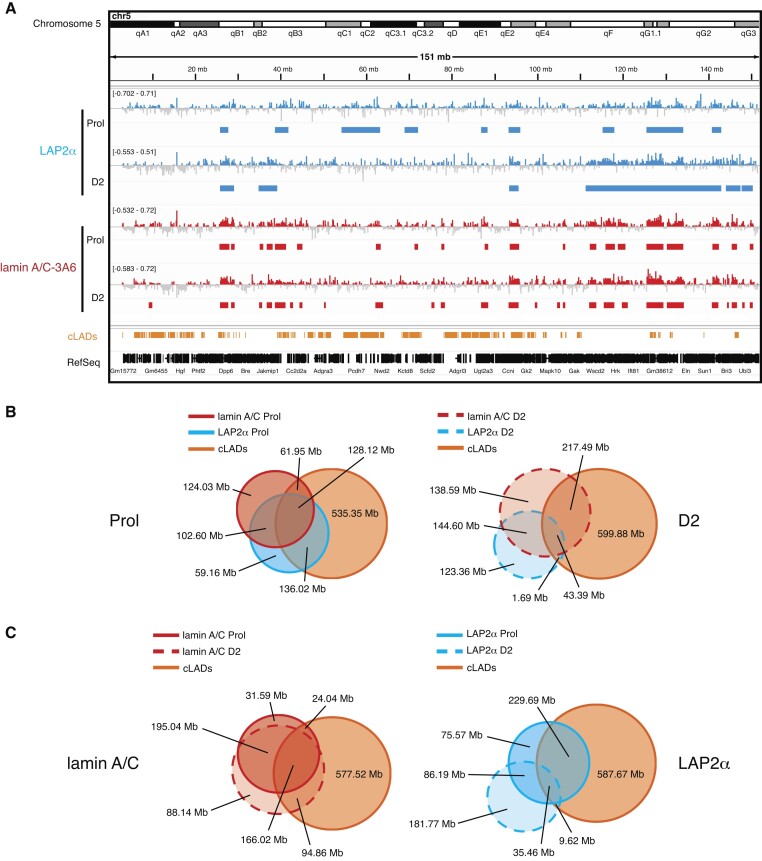
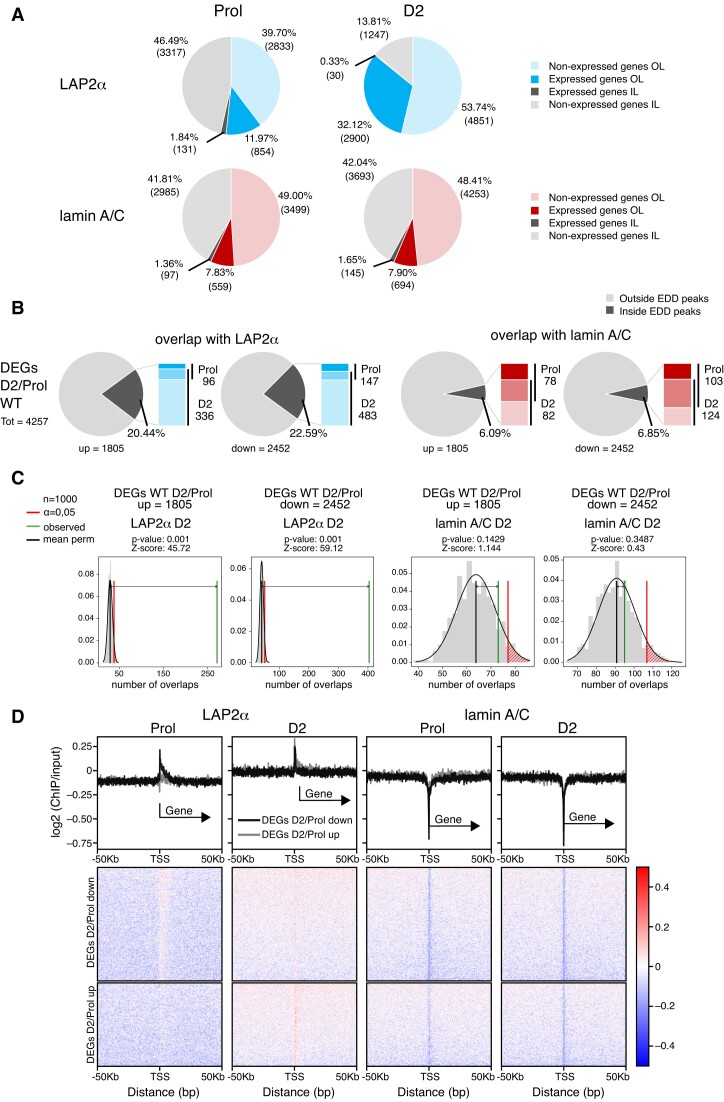
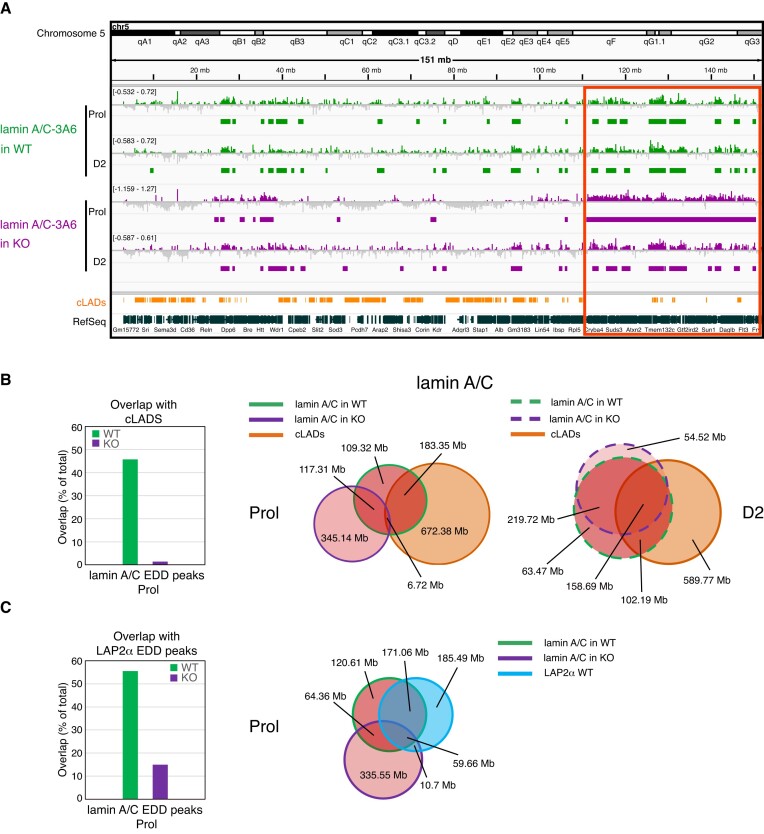
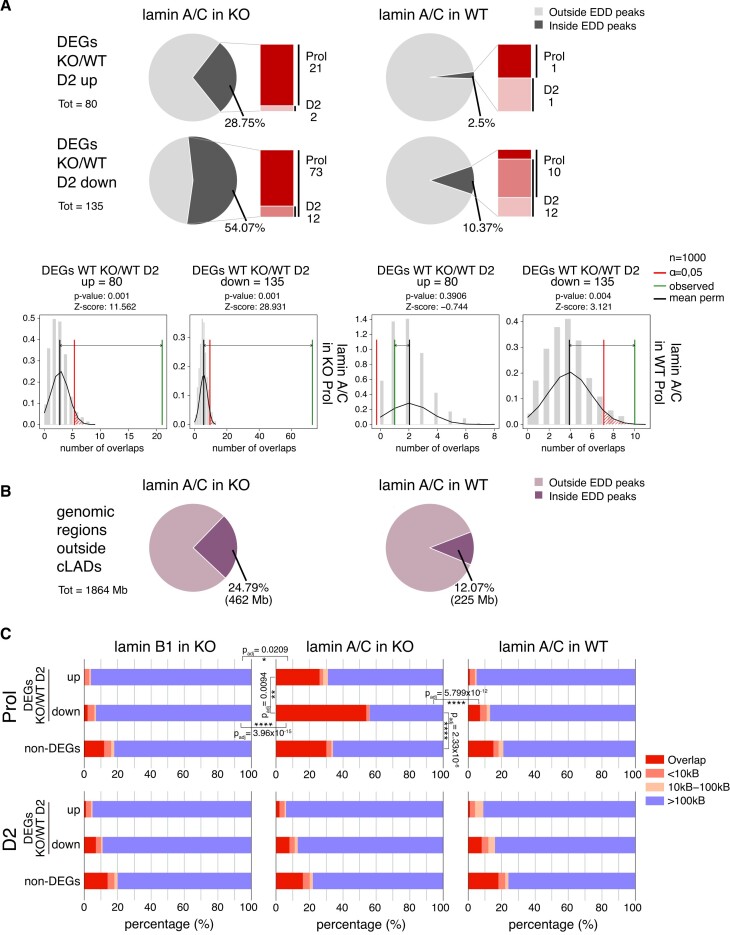
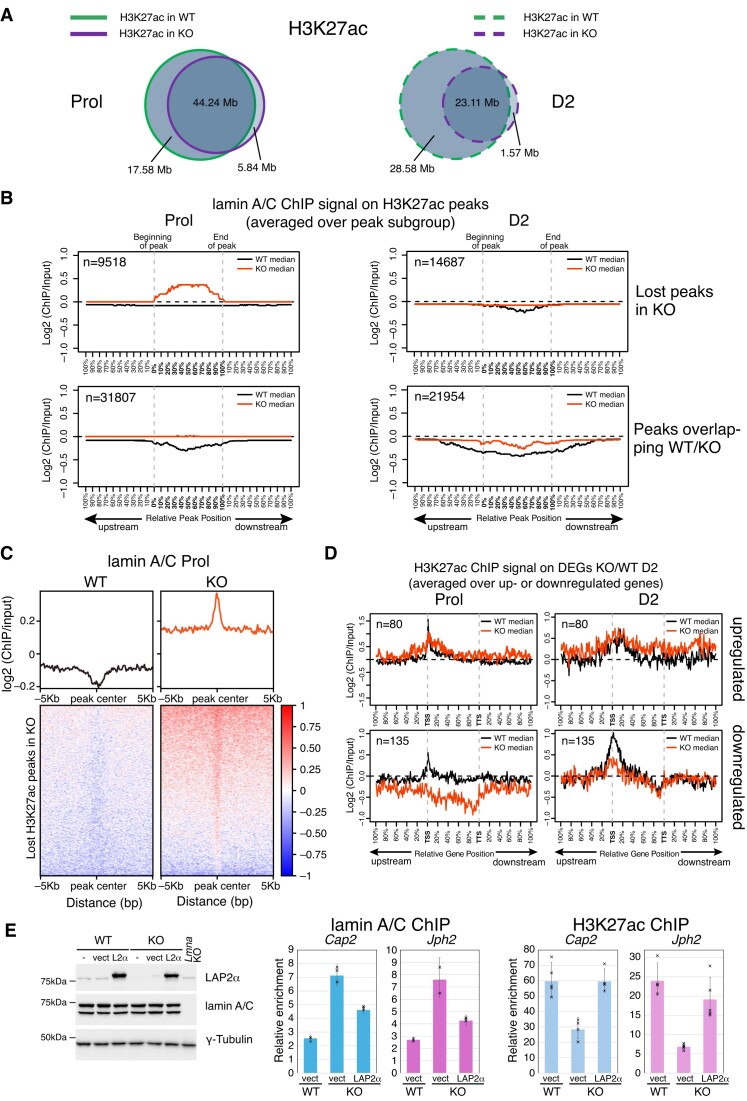
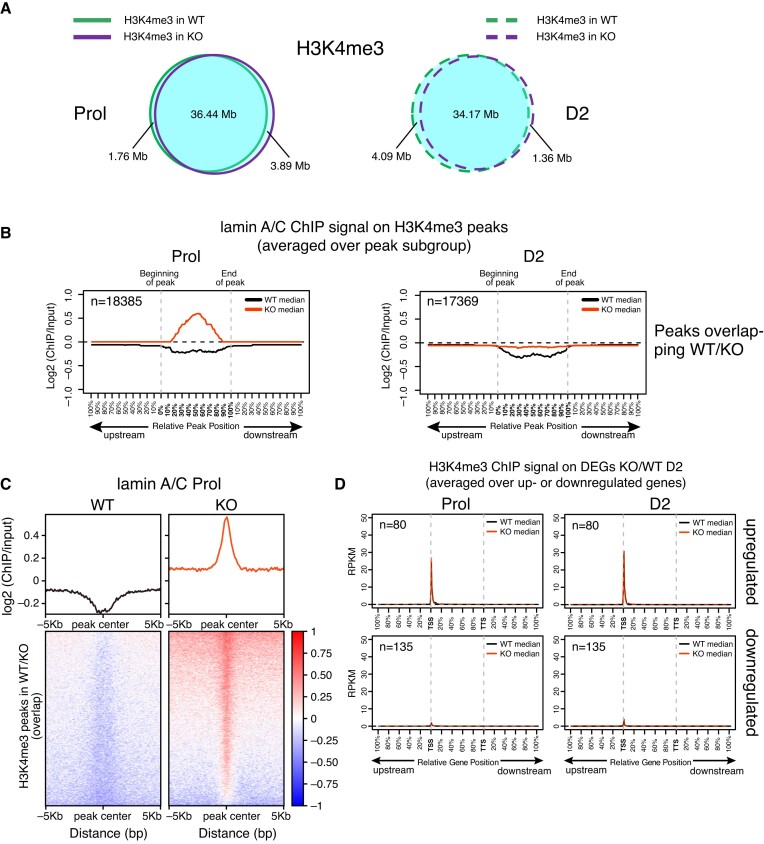
A-type lamins form a filamentous meshwork beneath the nuclear membrane that anchors large heterochromatic genomic regions at the nuclear periphery. A-type lamins also exist as a dynamic, non-filamentous pool in the nuclear interior, where they interact with lamin-associated polypeptide 2 alpha (LAP2α). Both proteins associate with largely overlapping euchromatic genomic regions in the nucleoplasm, but the functional significance of this interaction is poorly understood. Here, we report that LAP2α relocates towards regions containing myogenic genes in the early stages of muscle differentiation, possibly facilitating efficient gene regulation, while lamins A and C mostly associate with genomic regions away from these genes. Strikingly, upon depletion of LAP2α, A-type lamins spread across active chromatin and accumulate at regions of active H3K27ac and H3K4me3 histone marks in the vicinity of myogenic genes whose expression is impaired in the absence of LAP2α. Reorganization of A-type lamins on chromatin is accompanied by depletion of the active chromatin mark H3K27ac and a significantly impaired myogenic differentiation. Thus, the interplay of LAP2α and A-type lamins is crucial for proper positioning of intranuclear lamin A/C on chromatin to allow efficient myogenic differentiation.


Figures

Graphical Abstract
Graphical Abstract
Figure 1.
Figure 1.
Depletion of LAP2α in myoblasts causes impaired differentiation affecting a subgroup of myogenic genes in early differentiation stages. (A) Wildtype (WT) and LAP2α knockout (KO) immortalized myoblasts were differentiated in vitro for 7 days (D0–D7) or kept in the proliferating stage (Prol) and analyzed by Western blotting (upper panel) for the expression of LAP2α, lamin A/C and different myogenic markers as indicated on the right (MyHC: Myosin heavy chain; Myog: Myogenin). Images of wildtype and LAP2α knockout cells were obtained by phase-contrast light microscopy (100× magnification) six days after the induction of differentiation (lower panel). The dashed box denotes the area shown as enlarged image below. (B) Wildtype and LAP2α knockout cells were differentiated as in (A), RNA was isolated and analyzed by RNA-sequencing. Volcano plots display differentially expressed genes (DEGs) in wildtype and knockout differentiating (D2: day 2 of differentiation) versus proliferating (Prol) myoblasts (upper panel). DEGs in LAP2α knockout versus wildtype proliferating and differentiating cells (D2) were also analyzed (lower panel). Significantly differentially expressed genes are depicted in black. Genes related to muscle differentiation are depicted in red. Non-significantly changed genes are depicted in grey. (C) Venn diagram displaying the overlap of differentially expressed genes in differentiating (D2) versus proliferating wildtype myoblasts (DEGs D2/Prol WT; 4257 genes) and differentiating (D2) LAP2α knockout versus wildtype myoblasts (DEGs KO/WT D2; 215 genes). (D) 163 overlapping genes from (C) were subjected to gene-ontology (GO) analysis. Most significantly-enriched GO terms for biological processes are depicted, including the number of genes (count) found in each specific GO term, the fraction of genes compared to all genes within that GO term (gene ratio) and the adjusted P value (P adjust).
Figure 2.
Figure 2.
LAP2α and lamin A/C bind to large overlapping euchromatic regions in myoblasts and partially relocate during early myogenic differentiation. (A) ChIP-seq analysis was performed in proliferating (Prol) and differentiating wildtype immortalized myoblasts (D2: day 2 of differentiation) for LAP2α (blue) and lamin A/C (3A6 antibody; red) as indicated. IGV browser was used to display log2 ratio of ChIP over input signal tracks of mouse chromosome 5. Positive log2 ratio values are depicted in color, negative values in grey. Peaks called by the Enriched Domain Detector software (EDD) are depicted for each ChIP track. The scale of each log2 ratio track is indicated on the left. cLADs: constant lamina-associated domains. RefSeq: Gene annotations are from the NCBI reference sequence database. (B) Venn diagrams depicting the overlap of LAP2α (blue circle) and lamin A/C ChIP EDD peaks (red circle) in proliferating cells (left panel, solid lines) and differentiating cells (D2; right panel, dashed lines). Additionally, the overlap with cLAD regions is displayed (orange circle). The total genomic lengths of overlapping and non-overlapping regions between peak sets were identified using the intersect function of the BEDTools suite and are shown in megabases (Mb). (C) Venn diagrams as in (B) but depicting the overlap of lamin A/C (red circles, left panel) and LAP2α (blue circles, right panel) EDD peaks in proliferating (solid lines) and differentiating cells (D2; dashed lines).
Figure 3.
Figure 3.
LAP2α relocalizes to chromatin regions containing myogenic genes in differentiating cells. (A) Pie charts depicting the percentages of expressed and non-expressed genes within LAP2α (blue; upper panel) or lamin A/C (red; lower panel) EDD peaks in proliferating (Prol; left panel) and differentiating cells (D2; right panel), additionally distinguishing genes outside of cLADs (OL; in color) and inside of cLADs (IL; in grey). Numbers in parentheses correspond to absolute numbers of genes. (B) Pie charts showing the percentages of differentially expressed genes during early differentiation of wildtype cells (DEGs D2/Prol WT; 4257 genes) split into up- (1805) and downregulated (2452) genes that are found within or outside of LAP2α (panel 1 and 2) and lamin A/C (panel 3 and 4) EDD peaks. Bar charts on the right of each pie chart depict the number of DEGs found within EDD peaks in each differentiation stage (proliferating versus D2; dark versus light color, respectively; genes found in both stages are depicted in an intermediate color). (C) EDD peaks for LAP2α (panel 1 and 2) and lamin A/C (panel 3 and 4) in differentiation stage D2 were randomized 1000 times to yield genomic regions of the same size and the overlap with up- and downregulated DEGs D2/Prol WT was determined. The distributions of these randomized overlaps were plotted as histograms with the red line demarcating statistical significance at α=0.05 and the green line marking the observed overlap of DEGs with EDD peaks. Mean perm: mean value for random permutation tests (black line). (D) Heat maps displaying log2 ratio signal (ChIP over input) for LAP2α (panels 1 and 2) and lamin A/C (panels 3 and 4) in proliferating (Prol) and differentiating (D2) myoblasts on genes that are downregulated (DEGs D2/Prol down) or upregulated (DEGs D2/Prol up) during early differentiation. Graphs on top of heatmaps show mean log2 ratio tracks on down- (black) or upregulated genes (grey). TSS: transcription start site.
Figure 4.
Figure 4.
Lamin A/C spreads on euchromatin upon LAP2α depletion, moving away from cLADs and formerly LAP2α-bound regions. (A) ChIP-seq analysis was performed in proliferating (Prol) and differentiating (D2) wildtype (WT; green) and LAP2α knockout (KO; purple) myoblasts using lamin A/C antibody 3A6 as indicated. IGV browser was used to display log2 ratios of ChIP over input signal tracks of mouse chromosome 5. Positive log2 ratio values are depicted in color, negative values in grey. Peaks called by the Enriched Domain Detector software (EDD) are depicted for each ChIP track. The scale of each log2 ratio track is indicated on the left. Red box demarcates regions of lamin spreading on chromatin in proliferating LAP2α knockout cells. cLADs: constant lamina-associated domains. RefSeq: Gene annotations from the NCBI reference sequence database. (B) Venn diagrams depicting the overlap of lamin A/C ChIP EDD peaks in wildtype (red circles with green line) and LAP2α knockout (red circles with purple line) proliferating (Prol; middle panel, solid lines) and differentiating cells (D2; right panel, dashed lines). Additionally, the overlap with cLAD regions is displayed (orange circle). The total genomic lengths of overlapping and non-overlapping regions between peak sets were identified using the intersect function of the BEDTools suite and are shown in megabases (Mb). Bar graph on the left displays the overlap in % of lamin A/C EDD peaks with cLADs in wildtype and LAP2α knockout cells. (C) Venn diagrams as in (B), but depicting the overlap of lamin A/C ChIP EDD peaks in wildtype and LAP2α knockout proliferating cells (red circles with green and purple line, respectively) with wildtype LAP2α EDD peaks (blue circle). Bar graph on the left displays the overlap in % of lamin A/C EDD peaks in wildtype and LAP2α knockout cells with wildtype LAP2α EDD peaks.
Figure 5.
Figure 5.
Lamin A/C relocalizes to chromatin regions overlapping with genes that are downregulated in LAP2α knockout cells. (A) Upper and middle panel: Pie charts showing the percentages of differentially expressed genes in LAP2α knockout versus wildtype myoblasts during differentiation (DEGs KO/WT D2; 215 genes) split into up- (80 genes; upper panel) and downregulated genes (135 genes; middle panel) that are found within or outside of lamin A/C EDD peaks in knockout (KO; left panel) and wildtype cells (WT; right panel). Bar charts on the right of each pie chart depict the number of DEGs found within EDD peaks in each differentiation stage (proliferating versus D2; dark versus light color, respectively; genes found in both stages are depicted in an intermediate color). Bottom panel: Lamin A/C EDD peaks for proliferating knockout (left panel) and wildtype myoblasts (right panel) were randomized 1000 times to yield genomic regions of the same size and the overlap with DEGs KO/WT D2 split into up- and downregulated genes was determined. The distribution of these randomized overlaps was plotted as histograms with the red line demarcating statistical significance at α=0.05 and the green line marking the observed overlap of DEGs with EDD peaks. Mean perm: Mean value for random permutation tests (black line). (B) Pie charts showing the percentages of genomic regions outside cLADs (1864 megabases) that are found within or outside of lamin A/C EDD peaks in knockout (KO; left panel) and wildtype cells (WT; right panel). Total lengths of overlapping regions are shown in brackets (Mb: megabases). (C) The genomic distances in basepairs of 215 DEGs KO/WT D2 (split into up- and downregulated genes) to the closest lamin A/C EDD peaks were determined in proliferating (Prol; upper panel) and differentiating (D2; lower panel) LAP2α knockout (middle panel) or wildtype myoblasts (right panel) and plotted in bar charts. The distances of non-differentially expressed genes (non-DEGs) to EDD peaks were also determined and plotted as a control. For LAP2α knockout myoblasts, the same analysis was performed for lamin B1 ChIP-seq EDD peaks (left panel). Statistically significant comparisons are indicated with * P< 0.05; **P< 0.01; ****P< 0.0001; Padj: P-value (KS test) adjusted for multiple testing. All other pairwise comparisons using the KS test were non-significant (P> 0.05).
Figure 6.
Figure 6.
Accumulation of lamin A/C correlates with loss of active H3K27ac histone marks in LAP2α knockout cells. (A) ChIP-seq analysis was performed in wildtype (WT) and LAP2α knockout (KO) myoblasts using an H3K27ac-specific antibody. Venn diagrams depict the overlap of H3K27ac ChIP peaks in wildtype (green) and LAP2α knockout (purple) proliferating (Prol; left panel, solid lines) and differentiating cells (D2; right panel, dashed lines). The total genomic lengths of overlapping and non-overlapping regions between peak sets were identified using the intersect function of the BEDTools suite and are shown in megabases (Mb). (B) Median log2 ratio tracks (ChIP over input) of lamin A/C in proliferating (Prol) and differentiating (D2) wildtype (WT; black) and LAP2α knockout myoblasts (KO; red) were plotted on H3K27ac ChIP-seq peaks subdivided into peaks that are lost upon depletion of LAP2α (lost peaks in KO; upper panel) and those that are maintained (peaks overlapping WT/KO; lower panel). Peak lengths were normalized by scaling (full length of peak = 100%). One peak-length upstream of the beginning of each peak and downstream of the end of each peak was also plotted. (C) Heat maps displaying log2 ratio signal (ChIP over input) for lamin A/C in proliferating (Prol) wildtype (left panel) and LAP2α knockout myoblasts (right panel) on H3K27ac ChIP-seq peaks that are lost in KO cells. Graphs on top of heatmaps show mean log2 ratio tracks. (D) Median H3K27ac ChIP log2 ratio tracks (ChIP over input) in proliferating (left panel) and differentiating (D2; right panel) wildtype (black) and LAP2α knockout (red) myoblasts on deregulated genes in LAP2α knockout (DEGs KO/WT D2; 215 genes) split into up- and downregulated genes are shown. Gene lengths were normalized by scaling (full length of gene = 100%). One gene-length upstream of the TSS (transcription start site) and downstream of the TTS (transcription termination site) was also plotted. (E) Left panel: WT and LAP2α KO myoblasts were either left untreated (-), transduced with an empty lentiviral vector (vect) or with the same vector encoding FLAG-tagged wildtype LAP2α (L2α), followed by Western blot analysis using the indicated antibodies. Lamin A/C knockout (Lmna KO) myoblasts were included as a control. Right and middle panel: ChIP-qPCR analysis was performed in vector-transduced WT and LAP2α KO cells, as well as LAP2α KO cells expressing wildtype LAP2α, using antibodies to lamin A/C (middle) and H3K27ac (right). Precipitated chromatin was analyzed using primers specific to the regulatory region (±1kB up- and downstream of TSS) of two genes (Cap2, Jph2) that are downregulated in LAP2α KO cells. Data are displayed as average fold enrichment of specific ChIP/IgG control ± standard deviation of 3 (lamin A/C) and 5 (H3K27ac) technical replicates of a representative experiment. Single data points are depicted for each column.
Figure 7.
Figure 7.
H3K4me3 histone marks are not affected by accumulation of lamin A/C in LAP2α knockout cells. (A) ChIP-seq analysis was performed in wildtype (WT) and LAP2α knockout (KO) myoblasts using an H3K4me3-specific antibody. Venn diagrams depict the overlap of H3K4me3 ChIP peaks in wildtype (green) and LAP2α knockout (purple) proliferating (Prol; left panel, solid lines) and differentiating cells (D2; right panel, dashed lines). The total genomic lengths of overlapping and non-overlapping regions between peak sets were identified using the intersect function of the BEDTools suite and are shown in megabases (Mb). (B) Median log2 ratio tracks (ChIP over input) of lamin A/C in proliferating (Prol) and differentiating (D2) wildtype (WT; black) and LAP2α knockout myoblasts (KO; red) were plotted on H3K4me3 ChIP-seq peaks overlapping in WT and LAP2α KO cells. Peak lengths were normalized by scaling (full length of peak = 100%). One peak-length upstream of the beginning of each peak and downstream of the end of each peak was also plotted. (C) Heat maps displaying log2 ratio signal (ChIP over input) for lamin A/C in proliferating (Prol) wildtype (left panel) and LAP2α knockout myoblasts (right panel) on H3K4me3 ChIP-seq peaks overlapping in WT and LAP2α KO cells. Graphs on top of heatmaps show mean log2 ratio tracks. (D) Median H3K4me3 ChIP log2 ratio tracks (ChIP over input) in proliferating (left panel) and differentiating (D2; right panel) wildtype (black) and LAP2α knockout (red) myoblasts on deregulated genes in LAP2α knockout (DEGs KO/WT D2; 215 genes) split into up- and downregulated genes are shown. Gene lengths were normalized by scaling (full length of gene = 100%). One gene-length upstream of the TSS (transcription start site) and downstream of the TTS (transcription termination site) was also plotted.

Similar articles

Cited by

References

    1. van Steensel B., Belmont A.S.. Lamina-associated domains: links with chromosome architecture, heterochromatin, and gene repression. Cell. 2017; 169:780–791. - PMC - PubMed
    1. Gonzalez-Sandoval A., Towbin B.D., Kalck V., Cabianca D.S., Gaidatzis D., Hauer M.H., Geng L., Wang L., Yang T., Wang X.et al. .. Perinuclear anchoring of H3K9-methylated chromatin stabilizes induced cell fate in C. elegans embryos. Cell. 2015; 163:1333–1347. - PubMed
    1. Leemans C., van der Zwalm M.C.H., Brueckner L., Comoglio F., van Schaik T., Pagie L., van Arensbergen J., van Steensel B.. Promoter-intrinsic and local chromatin features determine gene repression in LADs. Cell. 2019; 177:852–864. - PMC - PubMed
    1. Robson M.I., de Las Heras J.I., Czapiewski R., Le Thanh P., Booth D.G., Kelly D.A., Webb S., Kerr A.R.W., Schirmer E.C.. Tissue-specific gene repositioning by muscle nuclear membrane proteins enhances repression of critical developmental genes during myogenesis. Mol. Cell. 2016; 62:834–847. - PMC - PubMed
    1. Turgay Y., Eibauer M., Goldman A.E., Shimi T., Khayat M., Ben-Harush K., Dubrovsky-Gaupp A., Sapra K.T., Goldman R.D., Medalia O.. The molecular architecture of lamins in somatic cells. Nature. 2017; 543:261–264. - PMC - PubMed