[Preprint]. 2024 Aug 26:2024.08.22.24312319.
doi: 10.1101/2024.08.22.24312319.

The Genetic Determinants and Genomic Consequences of Non-Leukemogenic Somatic Point Mutations

Affiliations

The Genetic Determinants and Genomic Consequences of Non-Leukemogenic Somatic Point Mutations

Joshua S Weinstock et al. medRxiv. .

Abstract

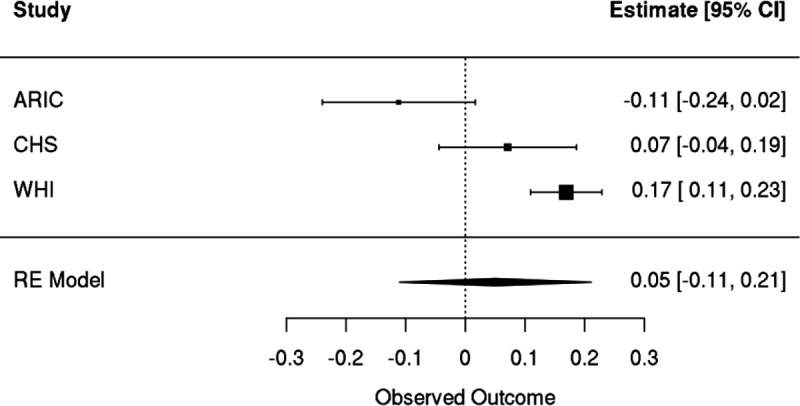
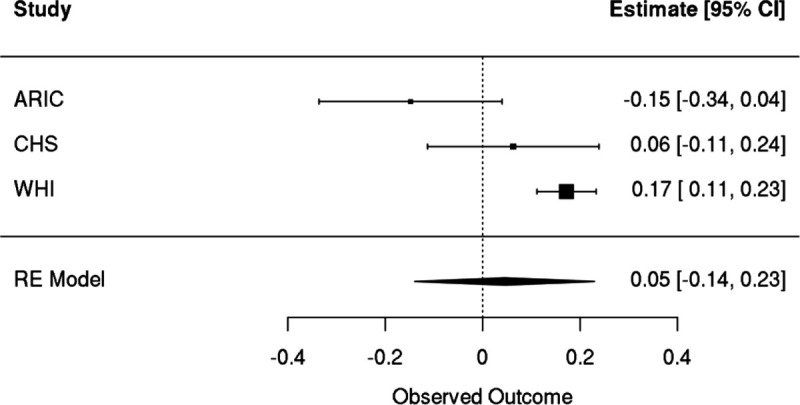
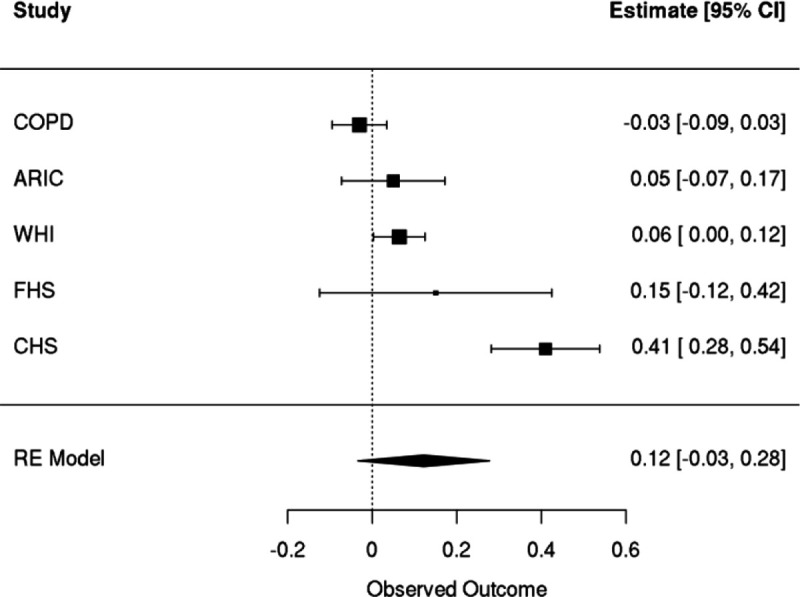
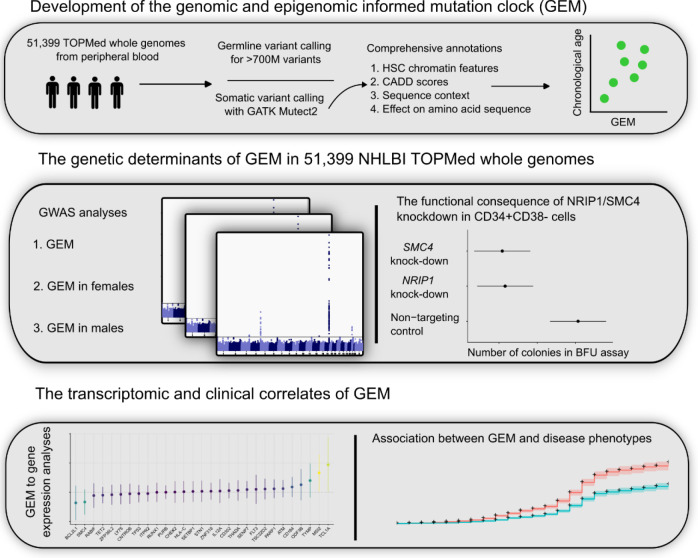
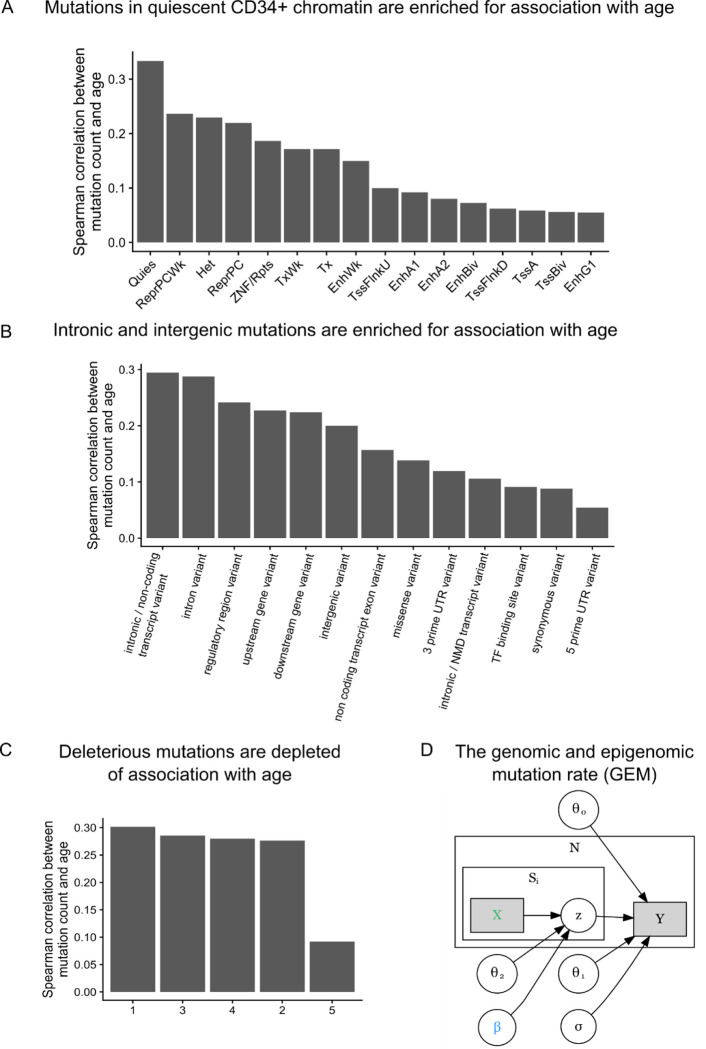
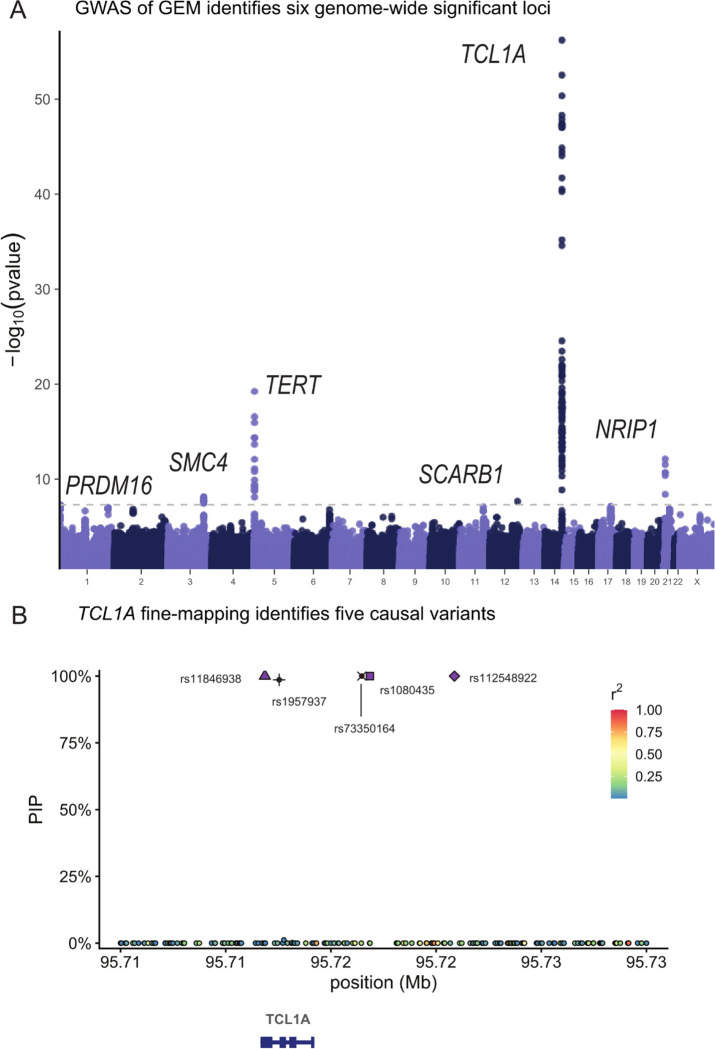
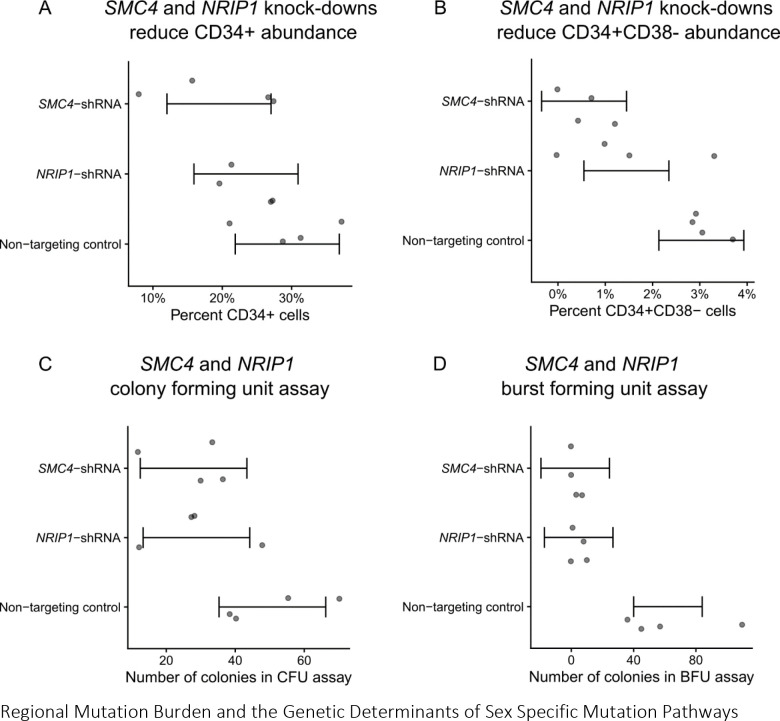
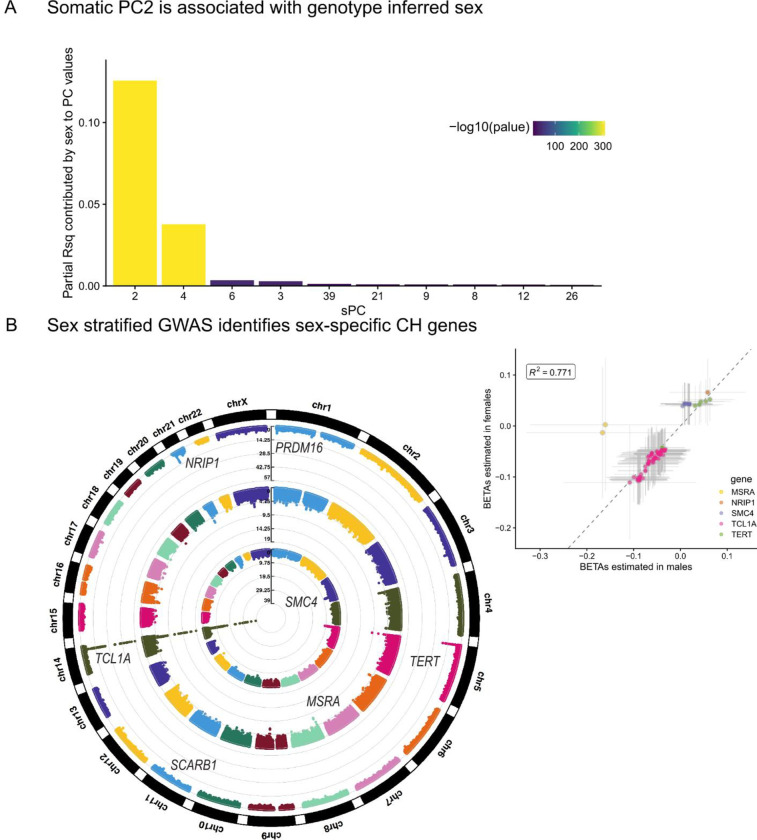
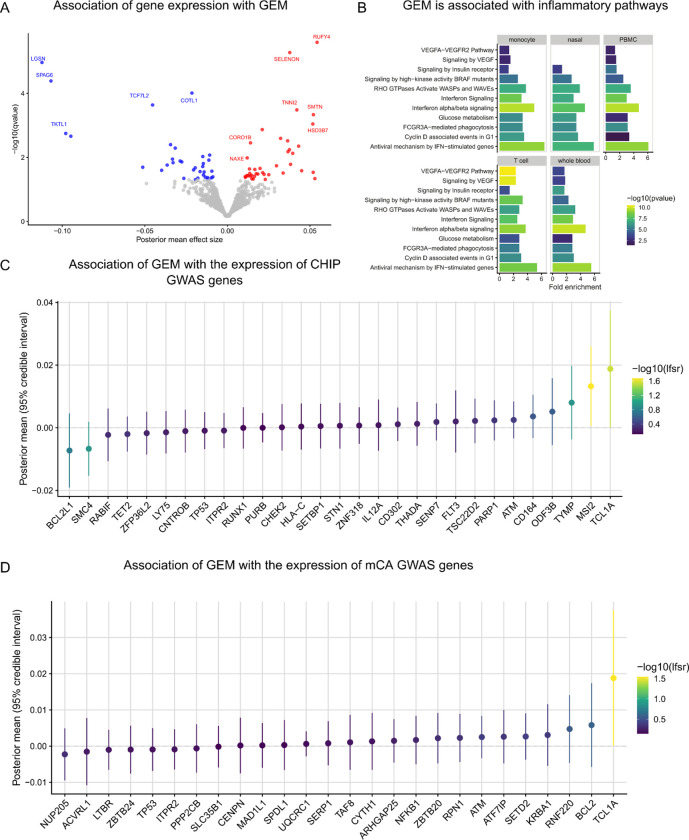
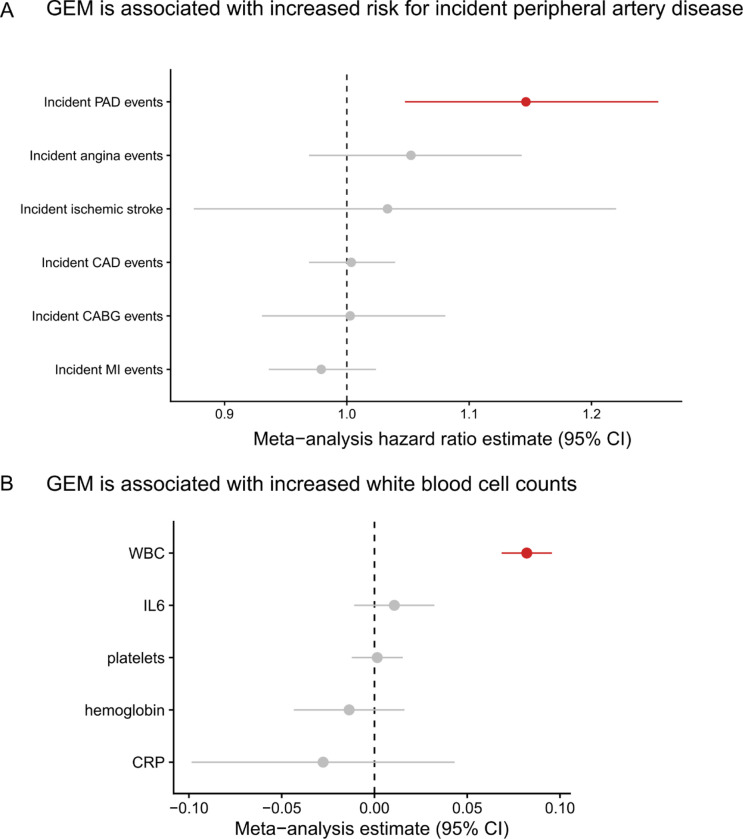
Clonal hematopoiesis (CH) is defined by the expansion of a lineage of genetically identical cells in blood. Genetic lesions that confer a fitness advantage, such as point mutations or mosaic chromosomal alterations (mCAs) in genes associated with hematologic malignancy, are frequent mediators of CH. However, recent analyses of both single cell-derived colonies of hematopoietic cells and population sequencing cohorts have revealed CH frequently occurs in the absence of known driver genetic lesions. To characterize CH without known driver genetic lesions, we used 51,399 deeply sequenced whole genomes from the NHLBI TOPMed sequencing initiative to perform simultaneous germline and somatic mutation analyses among individuals without leukemogenic point mutations (LPM), which we term CH-LPMneg. We quantified CH by estimating the total mutation burden. Because estimating somatic mutation burden without a paired-tissue sample is challenging, we developed a novel statistical method, the Genomic and Epigenomic informed Mutation (GEM) rate, that uses external genomic and epigenomic data sources to distinguish artifactual signals from true somatic mutations. We performed a genome-wide association study of GEM to discover the germline determinants of CH-LPMneg. After fine-mapping and variant-to-gene analyses, we identified seven genes associated with CH-LPMneg (TCL1A, TERT, SMC4, NRIP1, PRDM16, MSRA, SCARB1), and one locus associated with a sex-associated mutation pathway (SRGAP2C). We performed a secondary analysis excluding individuals with mCAs, finding that the genetic architecture was largely unaffected by their inclusion. Functional analyses of SMC4 and NRIP1 implicated altered HSC self-renewal and proliferation as the primary mediator of mutation burden in blood. We then performed comprehensive multi-tissue transcriptomic analyses, finding that the expression levels of 404 genes are associated with GEM. Finally, we performed phenotypic association meta-analyses across four cohorts, finding that GEM is associated with increased white blood cell count and increased risk for incident peripheral artery disease, but is not significantly associated with incident stroke or coronary disease events. Overall, we develop GEM for quantifying mutation burden from WGS without a paired-tissue sample and use GEM to discover the genetic, genomic, and phenotypic correlates of CH-LPMneg.


Conflict of interest statement

Competing Interests Declaration L.M.R. is a consultant for the TOPMed Administrative Coordinating Center (through Westat). B.M.P. serves on the Steering Committee of the Yale Open Data Access Project funded by Johnson & Johnson. J.Y. reports grant support from Bayer. M.C. reports grant support from Bayer and GSK, Consulting and speaking fees from Illumina and AstraZeneca. A.G.B., P.N, and S.J. are cofounders, equity holders, and on the scientific advisory board of TenSixteen Bio. G.R.A. is an employee of Regeneron Pharmaceuticals and receives salary, stock and stock options as compensation.

Figures

Extended Data Figure 1:
Spearman correlation between mutation burden and chronological age was calculated for each of the strata defined by chromHMM 15 state model in CD34+ cells and CADD derived quintiles. A CADD score of 5 indicates a score within the top 20% most deleterious variants.
Extended Data Figure 2:
Scatter plot comparing the −log10 pvalues from GWAS where the phenotype was either GEM (x-axis) or the burden of mutations falling in either heterochromatin or quiescent chromatin in CD34+ cells. Genes are colored by the likely causal gene, which was manually curated. Variants shown have pvalue < 5 × 10⁻⁸ in at least one of the two GWAS.
Extended Data Figure 3:
Scatter plot comparing the beta values from GWAS where the phenotype was either GEM on all individuals (x-axis, n= 51,399) or GEM on individuals that did not have an mCA (n = 38,000). Genes are colored by the likely causal gene, which was manually curated. Variants shown have pvalue < 5 × 10⁻⁸ in at least one of the two GWAS.
Extended Data Figure 4:
HSC stochastic process simulation, showing that the number of active HSCs has a large effect on the number of high-VAF mutations at the end of the simulation
Extended Data Figure 5:
HSC stochastic process simulation, showing that the number of active HSCs has a large effect on likelihood of obtaining at clone with high fitness
Extended Data Figure 6:
Linear regressions were performed between the inverse normal transformed mutation burden in each genomic bin with chronological age on the y-axis. Each regression include a study indicator as a covariate.
Extended Data Figure 8:
The association between GEM and gene expression in either monocytes or T cells. Effect sizes are estimated after application of mashr shrinkage, and the intervals denote 95% credible intervals.
Extended Data Figure 8:
The association between GEM and gene expression in whole blood among CHIP genes. Effect sizes are estimated after application of mashr shrinkage, and the intervals denote 95% credible intervals.
Extended Data Figure 9:
Meta-analyses of Cox proportional hazards regression with time to ischemic stroke as the outcome. A spline of age, sex, smoking status, and germline PCs were included as covariates. Individuals with prevalent disease were excluded.
Extended Data Figure 10:
Female only meta-analyses of Cox proportional hazards regression with time to ischemic stroke as the outcome. A spline of age, sex, smoking status, and germline PCs were included as covariates. Individuals with prevalent disease were excluded.
Extended Data Figure 11:
Meta-analyses of linear regressions with inverse normal transformed GEM as the outcome and an indicator for prevalent coronary artery disease events that occurred prior to the blood draw that GEM uses as the covariate of interest. A spline of age, sex, smoking status, and germline PCs were included as covariates.
Figure 1:
Figure 1:
Study design schematic, describing the development of GEM, the use of GEM to discover the genetic determinants of mutation burden in blood, and the use of GEM to identify the transcriptomic and clinical correlates of mutation burden in blood.
Figure 2:
Figure 2:
Development of GEM | A, The Spearman correlation between mutation burden and chronological age stratified by chromHMM annotations in CD34+ cells. B, The Spearman correlation between mutation burden and chronological age stratified by functional consequence as annotated by the variant effect predictor (VEP). C, The Spearman correlation between mutation burden and chronological age, stratified by quintiles of CADD scores. D, Plate annotation for the GEM statistical model. θ0 and are intercepts; θ1 reflects the association between log2 transformed value of zij and chronological age Yi; zij denotes the probability that the jth mutation in the ith individual is a true somatic mutation. X is a matrix of annotations.
Figure 3:
Figure 3:
The genetic determinants of GEM. A, The GWAS of GEM. Summary statistics were estimated with SAIGE. B, Fine-mapping of the TCL1A locus. Note rs11846938 is 10bp from rs2887399. Fine-mapping was performed with SuSIE.
Figure 4:
Figure 4:
The functional consequence of SMC4 and NRIP1 on HSCs. A, SMC4 and NRIP1 were knocked-down with shRNA and the proportion of CD34+ cells was quantified with FACs. Quantities were compared referent to a non-targeting control. B, proportion of CD34+CD38− was quantified with FACS. C, Number of colonies formed in a colony-forming unit (CFU) assay. D, Number of colonies in a burst-forming unit assay.
Figure 5:
Figure 5:
The sex specific genetic determinants of mutation burden. A, Regressions were performed for each quantile-transformed somatic principal component (sPC) on study and sex as covariates. The partial variance explained by sex is displayed on the y-axis. B, Circular Manhattan plot. The outer-most ring is the GWAS of GEM on all individuals, the middle ring is the GWAS of GEM on males, and the inner-most ring is the GWAS of GEM in females. Inset, a scatter plot of the two sex-specific GWAS plotting all SNPs with pvalues < 1 × 10⁻⁸ in either GWAS. Asymptotic confidence intervals are plotted with a width corresponding to genome-wide significance.
Figure 6:
Figure 6:
The transcriptomic correlates of GEM. A, Association analyses were performed between GEM and gene expression in whole blood, including age, sex, genotype PCs 1–5, and expression PCs 1–20 as covariates. B, Enrichment analyses were performed using pathfindR and KEGG pathways as reference. C, Association statistics among CHIP GWAS genes. D, Association statistics among mCA GWAS genes.
Figure 7:
Figure 7:
The phenotype correlates of GEM. A, Cox proportional-hazard regressions were performed, regressing incident events on a spline of age, sex, smoking status, and germline PCs. Individuals with prevalent disease were excluded. CAD = coronary artery disease, PAD = peripheral artery disease, CABG = coronary artery bypass graft, MI = myocardial infarction. CAD events were defined as at least one of an MI, CABG, angina, or angioplasty during the follow-up period. A random effects meta-analysis was performed. GEM was inverse normal transformed. Sex was excluded from the WHI regression, and smoking was excluded from the COPD regression. B, A linear regression of the inverse normal transformed biomarker, including a spline of age, sex, smoking status, and germline PCs as covariates. GEM was inverse normal transformed. Sex was excluded from the WHI regression, and smoking was excluding from the COPD regression.

References

    1. Jaiswal S. et al. Age-Related Clonal Hematopoiesis Associated with Adverse Outcomes A BS TR AC T. NEJM.org. N Engl J Med 26, 2488–98 (2014). - PMC - PubMed
    1. Genovese G. et al. Clonal Hematopoiesis and Blood-Cancer Risk Inferred from Blood DNA Sequence. New England Journal of Medicine 371, 2477–2487 (2014). - PMC - PubMed
    1. Xie M. et al. Age-related mutations associated with clonal hematopoietic expansion and malignancies. Nature Medicine 20, 1472–1478 (2014). - PMC - PubMed
    1. Jaiswal S. et al. Clonal Hematopoiesis and Risk of Atherosclerotic Cardiovascular Disease. New England Journal of Medicine (2017) doi:10.1056/NEJMoa1701719. - DOI - PMC - PubMed
    1. Desai P. et al. Somatic mutations precede acute myeloid leukemia years before diagnosis. Nature Medicine 24, 1015–1023 (2018). - PMC - PubMed

Publication types