[Preprint]. 2024 Aug 20:2024.08.19.24312100.
doi: 10.1101/2024.08.19.24312100.

Large-scale CSF proteome profiling identifies biomarkers for accurate diagnosis of Frontotemporal Dementia

Affiliations

Large-scale CSF proteome profiling identifies biomarkers for accurate diagnosis of Frontotemporal Dementia

Yanaika S Hok-A-Hin et al. medRxiv. .

Update in

Abstract

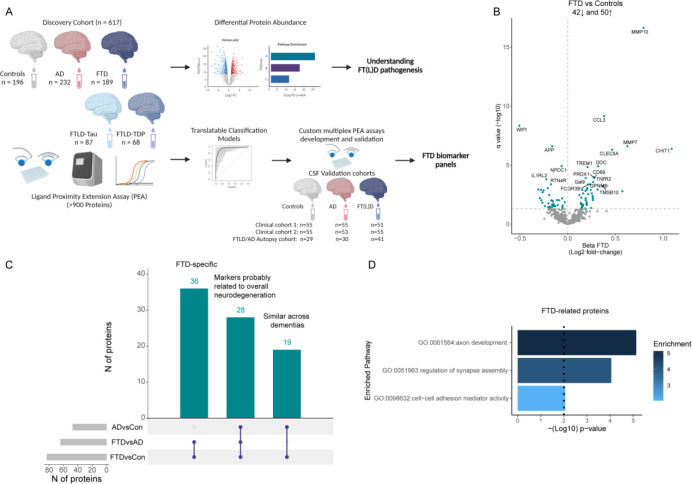
Diagnosis of Frontotemporal dementia (FTD) and the specific underlying neuropathologies (frontotemporal lobar degeneration; FTLD- Tau and FTLD-TDP) is challenging, and thus fluid biomarkers are needed to improve diagnostic accuracy. We used proximity extension assays to analyze 665 proteins in cerebrospinal fluid (CSF) samples from a multicenter cohort including patients with FTD (n = 189), Alzheimer's Disease dementia (AD; n = 232), and cognitively unimpaired individuals (n = 196). In a subset, FTLD neuropathology was determined based on phenotype or genotype (FTLD-Tau = 87 and FTLD-TDP = 68). Forty three proteins were differentially regulated in FTD compared to controls and AD, reflecting axon development, regulation of synapse assembly, and cell-cell adhesion mediator activity pathways. Classification analysis identified a 14- and 13-CSF protein panel that discriminated FTD from controls (AUC: 0.96) or AD (AUC: 0.91). Custom multiplex panels confirmed the highly accurate discrimination between FTD and controls (AUCs > 0.96) or AD (AUCs > 0.88) in three validation cohorts, including one with autopsy confirmation (AUCs > 0.90). Six proteins were differentially regulated between FTLD-TDP and FTLD-Tau, but no reproducible classification model could be generated (AUC: 0.80). Overall, this study introduces novel FTD-specific biomarker panels with potential use in diagnostic setting.

Keywords: Biomarkers; CSF; FTD; FTLD; Proteomics; TDP43; Tau.


Figures

Figure 1.
Figure 1.
Overview study design and differential abundance of CSF proteins in FTD. A) More than 900 proteins were measured using the antibody-based PEA technology in CSF from 196 cognitively unimpaired controls (white), 189 FTD (blue), and 232 AD (red) patients. Differential protein abundance was investigated and classification models were constructed. Custom PEA assays using the proteins identified in the classification models were developed and validated in three independent cohorts, including an FTLD/AD autopsy cohort. B) Volcano plots show that 93 CSF proteins were differentially regulated between FTD and controls. Each dot represents a protein. The beta coefficients (log2 fold-change) are plotted versus q values (−log10-transformed). Proteins significantly dysregulated after adjusting for false discovery rate (FDR, q < 0.05) are depicted in blue. The total number of proteins that are down-regulated (n = 42, left) or up-regulated (n = 51, right) are depicted. Horizontal dotted line indicate the significance threshold. C) UpSet plot shows proteins dysregulated between FTD and controls and also dysregulated between FTD and AD or AD and controls. D) Bar graphs depicting the biological pathways enriched in protein specifically dysregulated in FTD. Dotted line represents the significant threshold (p < 0.01). The corresponding GO number and biological process is depicted on the left side. Stronger colors represent higher significant enrichment.
Figure 2.
Figure 2.
Differential abundance of CSF proteins in FTLD subtypes. Volcano plots show CSF proteins differentially regulated between patients with FTLD-Tau (n = 87; A) or FTLD-TDP (n = 68; B) and controls (n = 196) and between these neuropathological subtypes (C). Each dot represents a protein. The beta coefficients (log2 fold-change) are plotted versus q values (−log10-transformed). Proteins significantly dysregulated after adjusting for false discovery rate (FDR, q < 0.05) are depicted in blue. The total number of proteins that are down-regulated (left) or up-regulated (right) is indicated. D) UpSet plot depicts proteins dysregulated between FTLD-Tau, FTLD-TDP, and controls groups. E) Violins represent the abundance (log2 NPX) of the CSF proteins that were uniquely dysregulated in FTLD-Tau and FTLD-TDP or between the subtypes. Boxplot within the violin indicates the median and interquartile range of the protein abundance. # p < 0.05, *q < 0.05, **q < 0.01, ***q < 0.001. Abbreviations: CON, cognitively unimpaired controls; TDP, Transactive response DNA binding protein of 43.
Figure 3.
Figure 3.
CSF biomarker panels for specific diagnosis of FTD. A) Receiver operating characteristic (ROC) curves depict the performance of 14 CSF biomarker panel discriminating FTD from controls. Black line is the mean area under the curve (AUC) overall re-samplings (1000 repeats of 5-fold cross-validation, grey lines). B) Forest plot shows the different AUC and 95% confidence interval for the 14 and 13 CSF biomarker panels, and NFL to discriminate between FTD and controls (blue) or AD (red). C) Correlation matrix heatmap representing the Spearman’s correlation coefficient in-between the proteins selected in each panel, MMSE score, and FTLD-CDR scores in the total cohorts, and in a subset of the FTD group (n = 62). ROC curves depict the performance of 13 CSF biomarker panel discriminating FTD from AD (D) and FTLD-Tau from FTLD-TDP (E). Forest plot shows the different AUC and 95% confidence interval for the 10 CSF biomarker panels, and pTau/tTau ratio to discriminate between neuropathological subtypes (purple), subtypes that are genetic and/or autopsy confirmed (brown), subtypes which are genetic confirmed (coral), and subtypes which are autopsy confirmed (beige).
Figure 4.
Figure 4.
Development and validation of custom CSF biomarker panels for FTD diagnosis in independent cohorts. A) Lollipopplots depict the beta-coefficients obtained in the discovery phase in parallel to the beta-coefficients of the custom assays in clinical validation cohorts 1 and 2 and the autopsy cohort. Grey dots shows proteins that did not remain significant after correction for multiple testing. B) Receiver operating characteristic (ROC) curves showing the performance of the CSF biomarker panel discriminating FTD from controls or AD using the custom assays across the two clinical and one autopsy validation cohort. Inserts outline corresponding AUC and 95% CI. C) Forest plots depict the different AUC and 95% CI obtained with the CSF FTD biomarker panels or CSF NfL in the comparison between FTD and controls (blue) or AD (red).

References

    1. Gorno-Tempini M.L., et al. , Classification of primary progressive aphasia and its variants. American Academy of Neurology, 2011. 76. - PMC - PubMed
    1. Rascovsky K., et al. , Sensitivity of revised diagnostic criteria for the behavioural variant of frontotemporal dementia. Brain, 2011. 134(Pt 9): p. 2456–77. - PMC - PubMed
    1. Armstrong M.J., et al. , Criteria for the diagnosis of corticobasal degeneration. American Academy of Neurology, 2013. 80. - PMC - PubMed
    1. Hoglinger G.U., et al. , Clinical diagnosis of progressive supranuclear palsy: The movement disorder society criteria. Mov Disord, 2017. 32(6): p. 853–864. - PMC - PubMed
    1. Irwin D.J., et al. , Frontotemporal lobar degeneration: defining phenotypic diversity through personalized medicine. Acta Neuropathol, 2015. 129(4): p. 469–91. - PMC - PubMed

Publication types

LinkOut - more resources