[Preprint]. 2024 Sep 20:2024.08.14.607690.
doi: 10.1101/2024.08.14.607690.

An instantaneous voice synthesis neuroprosthesis

Affiliations

An instantaneous voice synthesis neuroprosthesis

Maitreyee Wairagkar et al. bioRxiv. .

Update in

  • An instantaneous voice-synthesis neuroprosthesis.
    Wairagkar M, Card NS, Singer-Clark T, Hou X, Iacobacci C, Miller LM, Hochberg LR, Brandman DM, Stavisky SD. Wairagkar M, et al. Nature. 2025 Aug;644(8075):145-152. doi: 10.1038/s41586-025-09127-3. Epub 2025 Jun 12. Nature. 2025. PMID: 40506548

Abstract

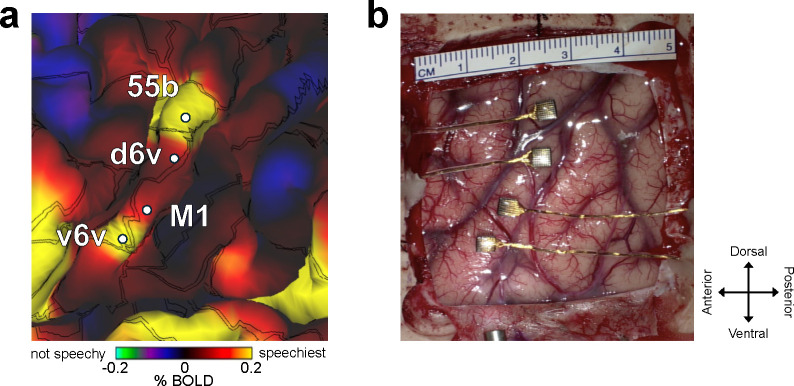
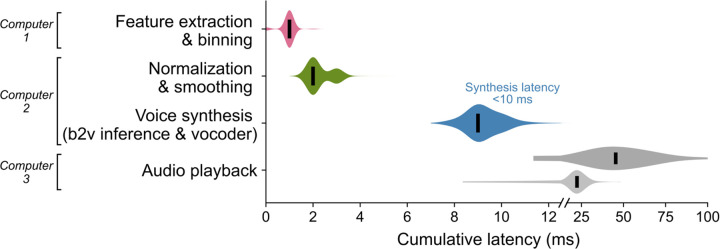
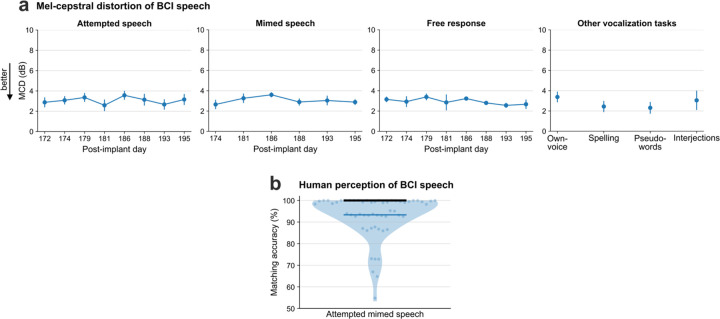
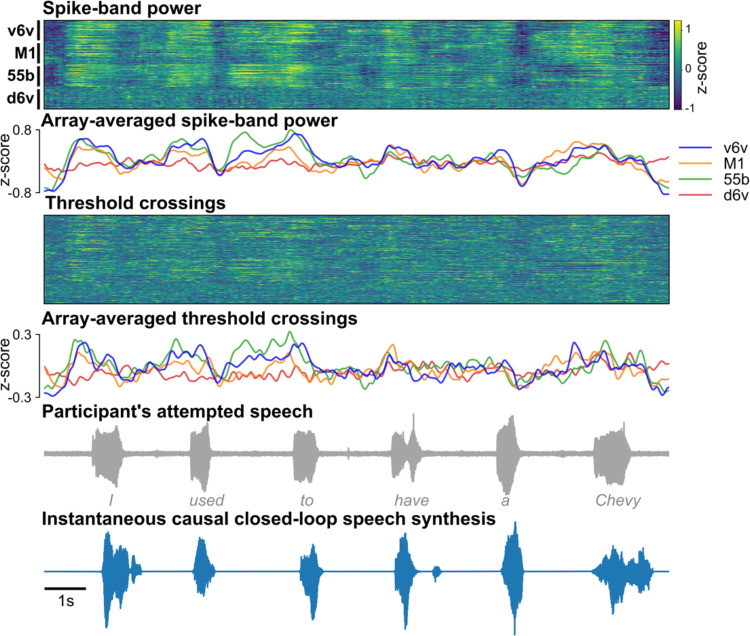
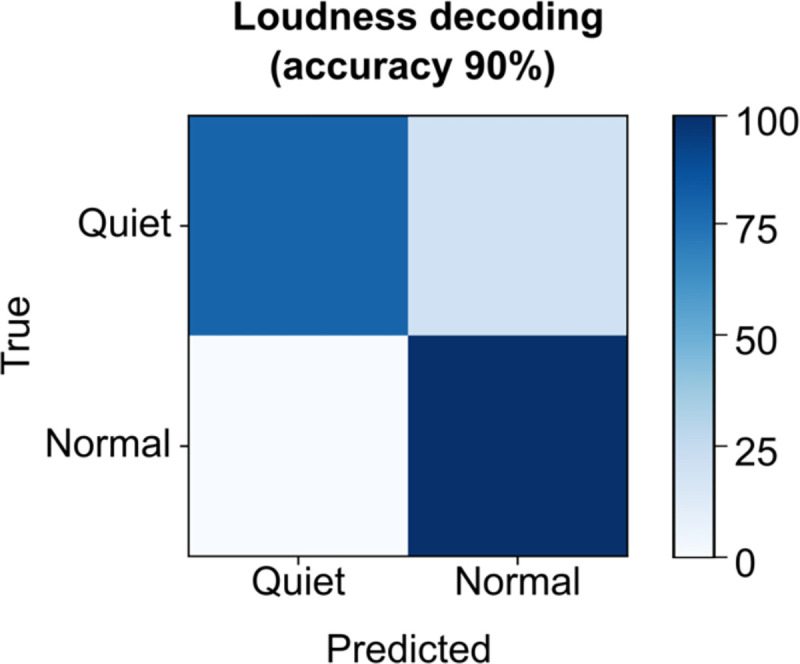
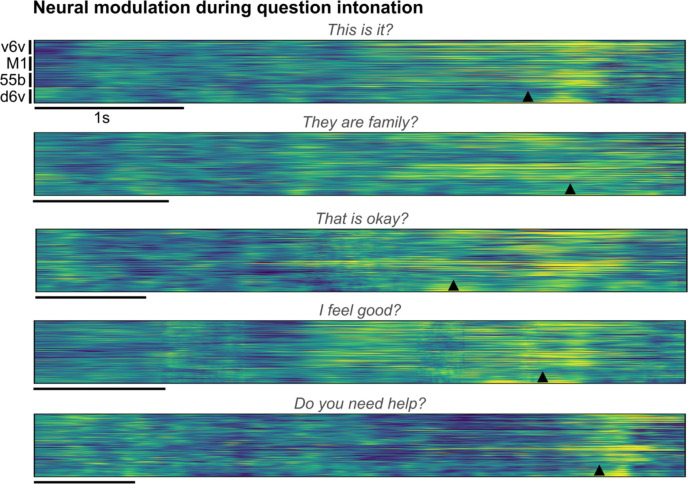
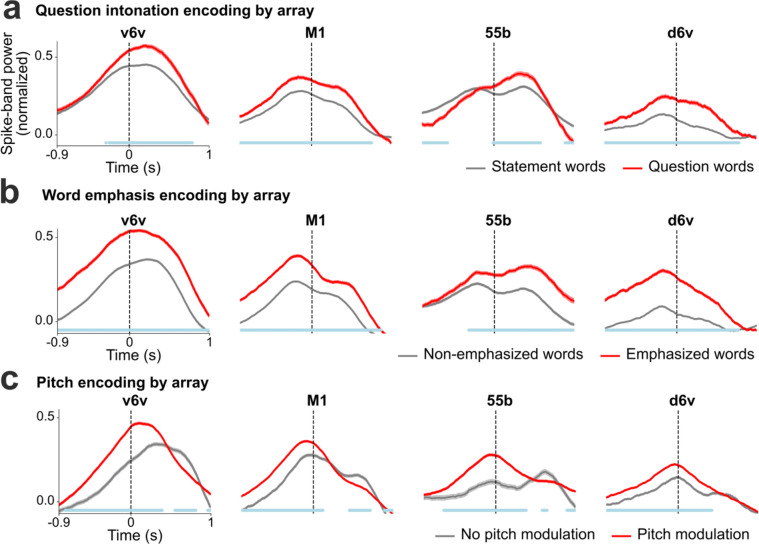
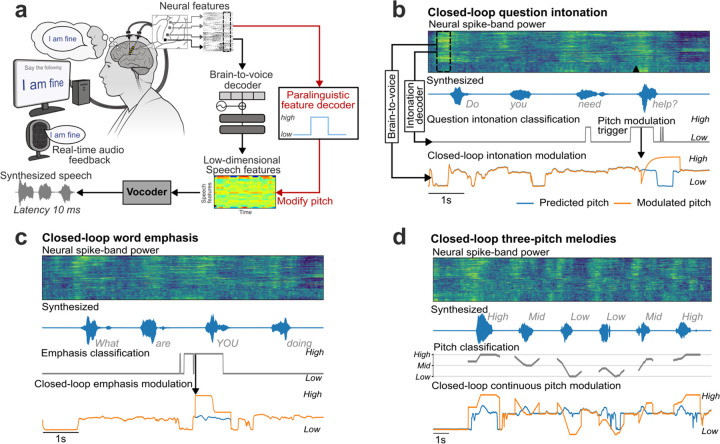
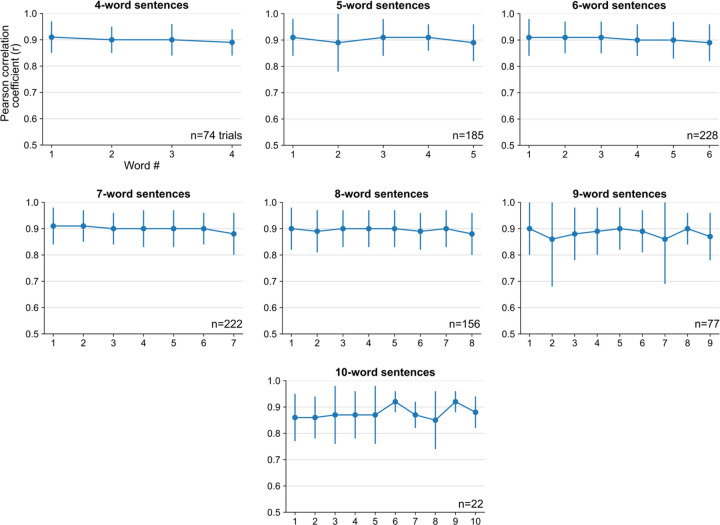
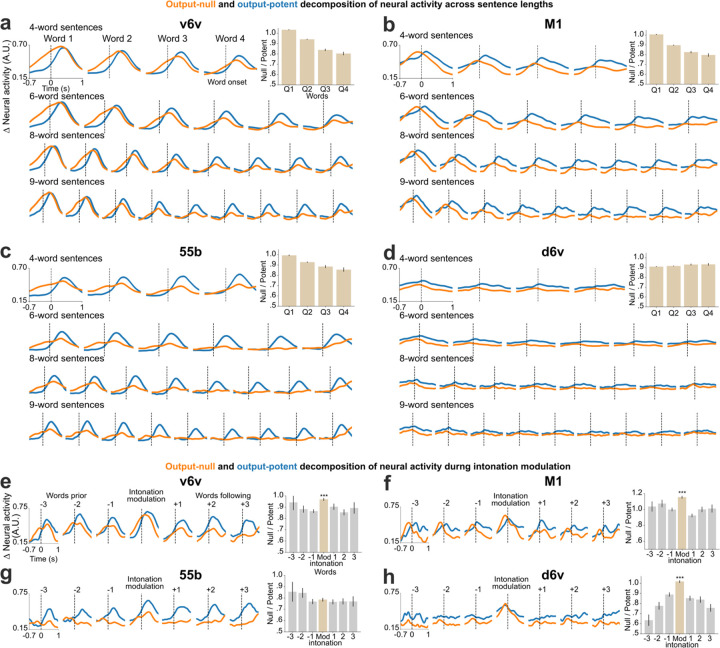
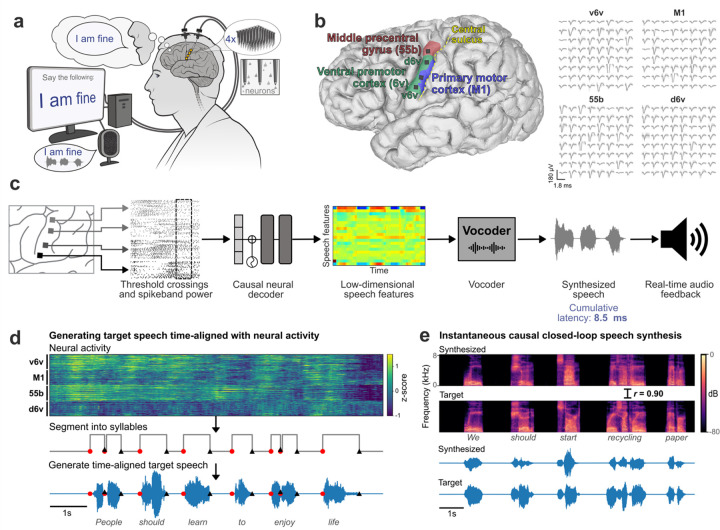
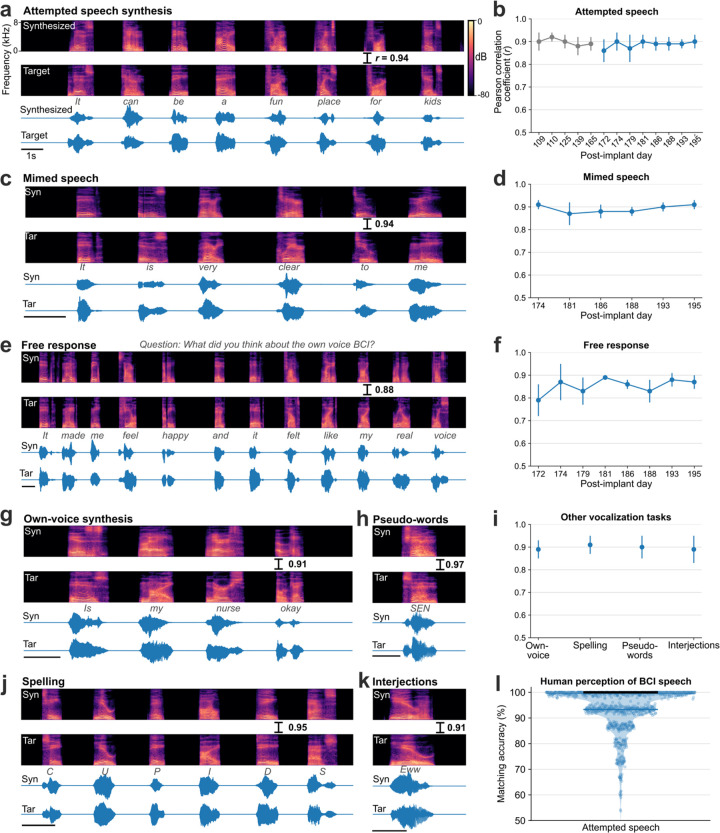
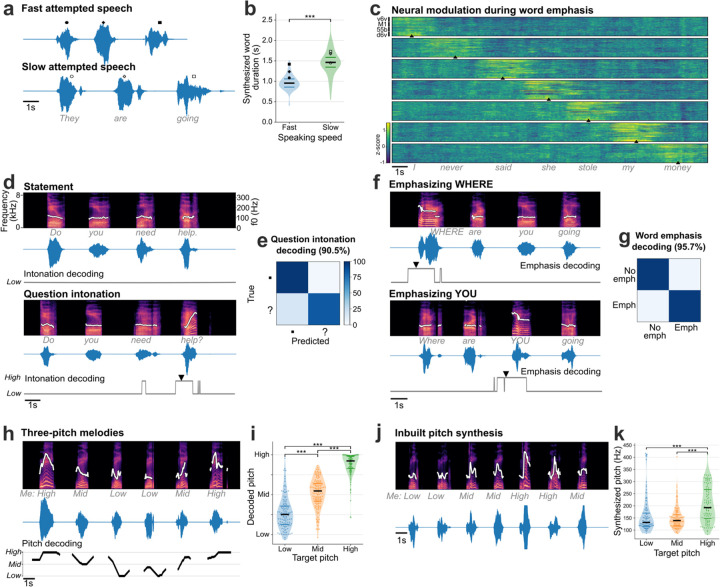
Brain computer interfaces (BCIs) have the potential to restore communication to people who have lost the ability to speak due to neurological disease or injury. BCIs have been used to translate the neural correlates of attempted speech into text1-3. However, text communication fails to capture the nuances of human speech such as prosody, intonation and immediately hearing one's own voice. Here, we demonstrate a "brain-to-voice" neuroprosthesis that instantaneously synthesizes voice with closed-loop audio feedback by decoding neural activity from 256 microelectrodes implanted into the ventral precentral gyrus of a man with amyotrophic lateral sclerosis and severe dysarthria. We overcame the challenge of lacking ground-truth speech for training the neural decoder and were able to accurately synthesize his voice. Along with phonemic content, we were also able to decode paralinguistic features from intracortical activity, enabling the participant to modulate his BCI-synthesized voice in real-time to change intonation, emphasize words, and sing short melodies. These results demonstrate the feasibility of enabling people with paralysis to speak intelligibly and expressively through a BCI.


Conflict of interest statement

Competing Interests: Stavisky is an inventor on intellectual property owned by Stanford University that has been licensed to Blackrock Neurotech and Neuralink Corp. Wairagkar, Stavisky, and Brandman have patent applications related to speech BCI owned by the Regents of the University of California. Brandman is a surgical consultant to Paradromics Inc. Stavisky is a scientific advisor to Sonera and ALVI Labs. The MGH Translational Research Center has a clinical research support agreement with Neuralink, Synchron, Axoft, Precision Neuro, and Reach Neuro, for which Hochberg provides consultative input. Mass General Brigham (MGB) is convening the Implantable Brain-Computer Interface Collaborative Community (iBCI-CC); charitable gift agreements to MGB, including those received to date from Paradromics, Synchron, Precision Neuro, Neuralink, and Blackrock Neurotech, support the iBCI-CC, for which Hochberg provides effort.

Figures

Extended Data Fig. 1:
Extended Data Fig. 1:. Microelectrode array placement.
a. The estimated resting state language network from Human Connectome Project data overlaid on T15’s brain anatomy. b. Intraoperative photograph showing the four microelectrode arrays placed on the of T15’s precentral gyrus.
Extended Data Fig. 2:
Extended Data Fig. 2:. Latencies of closed-loop brain-to-voice synthesis.
Cumulative latencies across different stages in the voice synthesis and audio playback pipeline are shown. Voice samples were synthesized from raw neural activity measurements within 10 ms and the resulting audio was played out loud continuously to provide closed-loop feedback. Note the linear horizontal axis is split to expand the visual dynamic range. We focused our engineering primarily on reducing the brain-to-voice inference latency, which fundamentally bounds the speech synthesis latency. As a result, the largest remaining contribution to the latency occurred after voice synthesis decoding during the (comparably more mundane) step of audio playback through a sound driver. The cumulative latencies with the audio driver settings used for T15 closed-loop synthesis are shown in dark gray. Audio playback latencies were subsequently substantially lowered through software optimizations (light gray) and we predict that further reductions will be possible with additional computer engineering.
Extended Data Fig. 3:
Extended Data Fig. 3:. Additional BCI speech synthesis performance metrics.
a. Mel-cepstral distortion (MCD) is computed across 25 Mel-frequency bands between the closed-loop synthesized speech and the target speech. The four subpanels show MCDs (mean ± s.d) between the synthesized and target speech for different speech tasks in evaluation research sessions. b. Human perception accuracy of BCI synthesized voice during mimed speech trials. 15 naïve listeners selected the transcript matching the synthesized speech from 6 possible sentences of the same length for each of the 58 evaluation sentences. Individual points on the violin plot show the average matching accuracy of each evaluation sentence (random small vertical jitter is added for visual clarity). The bold black line shows median accuracy (which was 100%) and the thin blue line shows the (bottom) 25th percentile.
Extended Data Fig. 4:
Extended Data Fig. 4:. Example closed-loop speech synthesis trial.
Spike-band power and threshold crossing spikes from each electrode are shown for one example sentence. These neural features are binned and causally normalized and smoothed on a rolling basis before being decoded to synthesize speech. The mean spike-band power and threshold crossing activity for each individual array are also shown. Speech-related modulation was observed on all arrays, with the highest modulation recorded in v6v and 55b. The synthesized speech is shown in the bottom-most row. The gray trace above it shows the participant’s attempted (unintelligible) speech as recorded with a microphone.
Extended Data Fig. 5:
Extended Data Fig. 5:. Loudness decoding from neural activity.
Confusion matrix showing offline accuracies for classifying the loudness of attempted speech from neural activity using a binary decoder while the participant was instructed to speak either quietly or in his normal volume.
Extended Data Fig. 6:
Extended Data Fig. 6:. Neural modulation during question intonation.
Trial-averaged normalized spike-band power (each row in a group is one electrode) during trials where the participant modulated his intonation to say the cued sentence as a question. Trials with the same cue sentence (n=16) were aligned using dynamic time warping and the mean activity across trials spoken as statements was subtracted to better show the increased neural activity around the intonation-modulation at the end of the sentence. The onset of the word that was pitch-modulated in closed-loop is indicated by the arrowhead at the bottom of each example.
Extended Data Fig. 7:
Extended Data Fig. 7:. Paralinguistic features encoding recorded from individual arrays.
a. Trial-averaged spike-band power (mean ± s.e.), averaged across all electrodes within each array, for words spoken as statements and as questions. At every time point, the spike-band power for statement words and question words were compared using the Wilcoxon rank-sum test. The blue line at the bottom indicates the time points where the spike-band power in statement words and question words were significantly different (p<0.001, n1=970, n2=184). b. Trial averaged spike-band power across each array for non-emphasized and emphasized words. The spike-band power was significantly different between non-emphasized words and emphasized words at time points shown in blue (p<0.001, n1=1269, n2=333). c. Trial-averaged spike-band power across each array for words without pitch modulation and words with pitch modulation (from the three-pitch melodies singing task). Words with low and high pitch targets are grouped together as the ‘pitch modulation’ category (we excluded medium pitch target words where the participant used his normal pitch). The spike-band power was significantly different between no pitch modulation and pitch modulation at time points shown in blue (p<0.001, n1=486, n2=916).
Extended Data Fig. 8:
Extended Data Fig. 8:. Closed-loop paralinguistic features modulation.
a. An overview of the paralinguistic feature decoder and pitch modulation pipeline. An independent paralinguistic feature decoder ran in parallel to the regular brain-to-voice decoder. Its output causally modulated the pitch feature predicted by brain-to-voice, resulting in a pitch-modulated voice. b. An example trial of closed-loop intonation modulation for speaking a sentence as a question. A separate binary decoder identified the change in intonation and sent a trigger (downward arrow) to modulate the pitch feature output of the regular brain-to-voice decoder according to a predefined pitch profile for asking a question (low pitch to high pitch). Neural activity of an example trial with its synthesized voice output is shown along with the intonation decoder output, time of modulation trigger (downward arrow), originally predicted pitch feature and the modulated pitch feature used for voice synthesis. c. An example trial of closed-loop word emphasis where the word “YOU” from “What are YOU doing” was emphasized. To emphasize a word, we applied a predefined pitch profile (high pitch to low pitch) along with a 20% increase in the loudness of the predicted speech samples. d. An example trial of closed-loop pitch modulation for singing a melody with three pitch levels. The three-pitch classifier output was used to continuously modulate the predicted pitch feature output from the brain-to-voice decoder.
Extended Data Fig. 9:
Extended Data Fig. 9:. Pearson correlation coefficients over the course of a sentence.
Pearson correlation coefficient (r) of individual words in sentences of different lengths (mean ± s.d.). The correlation between target and synthesized speech remained consistent throughout the length of sentence, indicating that the quality of synthesized voice was consistent throughout the sentence. Note that there were fewer longer evaluation sentences.
Extended Data Fig. 10:
Extended Data Fig. 10:. Output-null and output-potent neural dynamics during speech production in individual arrays.
a-d. Average approximated output-null (orange) and output-potent (blue) components of neural activity during attempted speech of cued sentences of different lengths. Here the neural components are computed for each array independently by training separate linear decoders (i.e., repeating the analyses of Fig. 4 for individual arrays independently). A subset of sentence lengths are shown in the interest of space. Note that the d6v array had much less speech-related modulation. Bar plots within each panel show a summary of all the data (including the not-shown sentence lengths) by taking the average null/potent activity ratios for words in the first-quarter, second-quarter, third-quarter, and fourth-quarter of each sentence (mean ± s.e.). e-h. Average output-null and output-potent activity during intonation modulation (question-asking or word emphasis) computed separately for each array. Output-null activity shows an increase during intonation modulated word in all arrays. Null/potent activity ratios are summarized in bar plots of intonation-modulated word (red) and the words preceding or following it (gray) (mean ± s.e.). The null/potent ratios of modulated words were significantly different from that of non-modulated words for the v6v, M1 and d6v arrays (Wilcoxon rank-sum, v6v: p= 10−11, M1: p= 10−16, 55b: p= 0.3, d6v: p= 10−26, n1=460, n2=922).
Fig. 1.
Fig. 1.. Closed-loop voice synthesis from intracortical neural activity in a participant with ALS.
a. Schematic of the brain-to-voice neuroprosthesis. Neural features extracted from four chronically implanted microelectrode arrays were decoded in real-time and used to directly synthesize voice. b. Array locations on the participant’s left hemisphere and typical neuronal action potentials from each microelectrode. Color overlays are estimated from a Human Connectome Project cortical parcellation. c. Closed-loop causal voice synthesis pipeline: voltages were sampled at 30 kHz; threshold-crossings and spike-band power features were extracted from 1 ms segments; these features were binned into 10 ms non-overlapping bins, normalized and smoothed. The Transformer-based decoder mapped these neural features to a low-dimensional representation of speech involving Bark-frequency cepstral coefficients, pitch, and voicing, which were used as input to a vocoder. The vocoder then generated speech samples which were continuously played through a speaker. d. Lacking T15’s ground truth speech, we first generated synthetic speech from the known text cue in the training data using a text-to-speech algorithm, and then used the neural activity itself to time-align the synthetic speech on a syllable-level with the neural data time-series to obtain a target speech waveform for training the decoder. e. A representative example of causally synthesized speech from neural data, which matches the target speech with high fidelity.
Fig. 2.
Fig. 2.. Voice neuroprosthesis allows a wide range of vocalizations.
a. Spectrogram and waveform of an example trial showing closed-loop synthesis during attempted speech of a cued sentence (top) and the target speech (bottom). The Pearson correlation coefficient (r) is computed across 40 Mel-frequency bands between the synthesized and target speech. b. Pearson correlation coefficients (mean ± s.d) for attempted speech of cued sentences across research sessions. Sessions in blue were predetermined as evaluation sessions and all performance summaries are reported over these sessions. c. An example mimed speech trial where the participant attempted to speak without vocalizing and d. mimed speech Pearson correlations across sessions. e. An example trial of self-guided attempted speech in response to an open-ended question and f. self-guided speech Pearson correlations across sessions. g. An example personalized own-voice synthesis trial. h, j, k. Example trials where the participant said pseudo-words, spelled out words letter by letter, and said interjections, respectively. The decoder was not trained on these words or tasks. i. Pearson correlation coefficients of own-voice synthesis, spelling, pseudo-words and interjections synthesis. l. Human perception accuracy of synthesized speech where 15 naive listeners for each of the 956 evaluation sentences selected the correct transcript from 6 possible sentences of the same length. Individual points on the violin plot show the average matching accuracy of each evaluation sentence (random vertical jitter is added for visual clarity). The bold black line shows median accuracy (which was 100%) and the thin blue line shows the (bottom) 25th percentile.
Fig. 3.
Fig. 3.. Modulating paralinguistic features in synthesized voice.
a. Two example synthesized trials are shown where the same sentence was spoken at faster and slower speeds. b. Violin plots showing significantly different durations of words instructed to be spoken fast and slowly (Wilcoxon rank-sum, p=10−14, n1=72, n2=57). The bold black horizontal line shows the median value of the synthesized word duration and thin colored horizontal lines show the range between 25th and 75th percentiles. c. Trial-averaged normalized spike-band power (each row in a panel is one electrode) during trials where the participant emphasized each word in the sentence “I never said she stole my money”, grouped by the emphasized word. Trials were aligned using dynamic time warping and the mean activity across all trials was subtracted to better show the increased neural activity around the emphasized word. The emphasized word’s onset is indicated by the arrowhead at the bottom of each condition. d. Spectrograms and waveforms of two synthesized voice trials where the participant says the same sentence as a statement and as a question. The intonation decoder output is shown below each trial. An arrowhead marks the onset of causal pitch modulation in the synthesized voice. The white trace overlaid on the spectrograms shows the synthesized pitch contour, which is constant for a statement and increases during the last word for a question. e. Confusion matrix showing accuracies for closed-loop intonation modulation during real-time voice synthesis. f. Spectrograms and waveforms of two synthesized voice trials where different words of the same sentence are emphasized, with pitch contours overlaid. Emphasis decoder output is shown below. Arrowheads show onset of emphasis modulation. g. Confusion matrix showing accuracies for closed-loop word emphasis during real-time voice synthesis. h. Example trial of singing a melody with three pitch targets. The pitch decoder output that was used to modulate pitch during closed-loop voice synthesis is shown below. The pitch contour of the synthesized voice shows different pitch levels synthesized accurately for the target cued melody. i. Violin plots showing significantly different decoded pitch levels for low, medium and high pitch target words (Wilcoxon rank-sum, p=10−14 with correction for multiple comparisons, n1=122, n2=132, n3=122). Each point indicates a single trial. j. Example three-pitch melody singing synthesized by a unified brain-to-voice model. The pitch contour of the synthesized voice shows that the pitch levels tracked the target melody. k. Violin plot showing peak synthesized pitch frequency achieved by the inbuilt pitch synthesis model for low, medium and high pitch targets. Synthesized high pitch was significantly different from low and medium pitch (Wilcoxon rank-sum, p=10−3, n1=106, n2=113, n3=105). Each point shows an individual trial.
Fig. 4.
Fig. 4.. Output-null and output-potent neural dynamics during speech production.
a. Average approximated output-null (orange) and output-potent (blue) components of neural activity during attempted speech of cued sentences of different lengths. Output-null activity gradually decayed over the course of the sentence, whereas the output-potent activity remained consistent irrespective of the length of the sentence. b. Average output-null and output-potent activity during intonation modulation (question-asking or word emphasis); data are trial-averaged aligned to the emphasized word (center) and the words preceding and/or following that word in the sentence. The output-null activity increased during pitch modulation as compared to the words preceding or following it. c. Panel a data are summarized by taking the average null/potent activity ratios for words in the first-quarter, second-quarter, third-quarter, and fourth-quarter of each sentence (mean ± s.e.). d. Panel b data are summarized by calculating average null/potent activity ratios of the intonation modulated word (beige) and the words preceding or following it (gray) (mean ± s.e.). The null/potent ratios of modulated words were significantly different from that of non-modulated words (Wilcoxon rank-sum, p= 10−21, n1=460, n2=922). Extended Data Fig. 10 shows these analyses for each array individually.

References

    1. Card N. S. et al. An Accurate and Rapidly Calibrating Speech Neuroprosthesis. N. Engl. J. Med. 391, 609–618 (2024). - PMC - PubMed
    1. Willett F. R. et al. A high-performance speech neuroprosthesis. Nature 620, 1031–1036 (2023). - PMC - PubMed
    1. Metzger S. L. et al. A high-performance neuroprosthesis for speech decoding and avatar control. Nature 620, 1037–1046 (2023). - PMC - PubMed
    1. Silva A. B., Littlejohn K. T., Liu J. R., Moses D. A. & Chang E. F. The speech neuroprosthesis. Nat. Rev. Neurosci. 25, 473–492 (2024). - PMC - PubMed
    1. Herff C. et al. Generating Natural, Intelligible Speech From Brain Activity in Motor, Premotor, and Inferior Frontal Cortices. Front. Neurosci. 13, (2019). - PMC - PubMed

Publication types

LinkOut - more resources