[Preprint]. 2024 Aug 24:2024.08.20.608660.
doi: 10.1101/2024.08.20.608660.

Lipid- and protein-directed photosensitizer proximity labeling captures the cholesterol interactome

Affiliations

Lipid- and protein-directed photosensitizer proximity labeling captures the cholesterol interactome

Andrew P Becker et al. bioRxiv. .

Abstract

The physical properties of cellular membranes, including fluidity and function, are influenced by protein and lipid interactions. In situ labeling chemistries, most notably proximity-labeling interactomics are well suited to characterize these dynamic and often fleeting interactions. Established methods require distinct chemistries for proteins and lipids, which limits the scope of such studies. Here we establish a singlet-oxygen-based photocatalytic proximity labeling platform (POCA) that reports intracellular interactomes for both proteins and lipids with tight spatiotemporal resolution using cell-penetrant photosensitizer reagents. Using both physiologically relevant lipoprotein-complexed probe delivery and genetic manipulation of cellular cholesterol handling machinery, cholesterol-directed POCA captured established and unprecedented cholesterol binding proteins, including protein complexes sensitive to intracellular cholesterol levels and proteins uniquely captured by lipoprotein uptake. Protein-directed POCA accurately mapped known intracellular membrane complexes, defined sterol-dependent changes to the non-vesicular cholesterol transport protein interactome, and captured state-dependent changes in the interactome of the cholesterol transport protein Aster-B. More broadly, we find that POCA is a versatile interactomics platform that is straightforward to implement, using the readily available HaloTag system, and fulfills unmet needs in intracellular singlet oxygen-based proximity labeling proteomics. Thus, we expect widespread utility for POCA across a range of interactome applications, spanning imaging to proteomics.


Conflict of interest statement

Ethics declarations The authors declare no known conflicts of interest.

Figures

Figure 1.
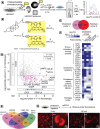
Figure 1.. Establishing the Halo-POCA system.
(A) General workflow for Halo-POCA in which cells overexpressing HaloTag fusion proteins are labeled with photosensitizer (PS)-functionalized HaloTag ligand, irradiated in the presence of amine trapping agent and subjected to click-chemistry enabled capture and proteomic analysis. Protein of interest (POI). (B) Schematic diagram of the nuclear pore complex (NPC), including the HaloTag-NUP153 bait protein used for POCA analysis. (C-E) Gel-based analysis of POCA labeling performed following the workflows Figure 1 and Figure S1A for HEK239T cells transiently expressing the indicated HaloTag fusions treated with JF570-HTL (100 nM, 10 min) followed by media washouts, addition of PA (10 mM) and irradiation (15 W yellow LED, 170,000 Lux max intensity, on ice), lysis, click conjugation to biotin-azide, SDS-PAGE, and Streptavidin blot. For ‘C’, total protein was assessed by stain-free blot. ‘C’ and ‘E’ were subjected to 5 min light (hv) irradiation, whereas in ‘D’ irradiation time was varied as indicated. For ‘E’ colored arrows indicate biotinylated proteins corresponding to the expected MW of the color-matched bait proteins. (F, G) Mass spectrometry-based POCA analysis generated following the workflows in Figure 1 and Figure S1A for HEK293T cells overexpressing either HaloTag-NUP153 or free HaloTag. POCA labeling was performed as described for the gel-based analysis with interactors trapped using 3-ethynylaniline (3EA, 10 mM) or propargylamine (PA, 10 mM) comparing relative POCA labeling with transiently overexpressed HaloTag-NUP153 versus free HaloTag in HEK293T cells. For ‘F’ volcano plot shows all identified proteins for EA labeling, with all nucleoporins circled and proteins significantly enriched (log2(fold-change)>1, p<0.05) with HaloTag-NUP153 highlighted in blue. For ‘G’ heatmap shows all identified nucleoporins colored based on LFQ-MBR log2(FC) values, p<0.05 for all proteins except those labeled gray. POM: pore membrane protein. For statistical significance in ‘F’ and ‘G’, variances were calculated for each sample-condition pairing and a corresponding two-tailed t-test was performed to generate p-values. n=3 per group for MS datasets. Pore membrane proteins (POMs). All MS data can be found in Data S1.
Figure 2:
Figure 2:. Using POCA with cholesterol identifies known cholesterol-interacting proteins.
(A) Schematic workflow for analyzing the light-dependent enrichment of different sterol-interacting proteins in cells by photoactivatable mβCD-complexed cholesterol probes. (B) Structures of the photosensitizer-containing probes 1 and 2. (C-F) Comparison of the protein targets captured by probe 1, 2, and cholesterol diazirine probes NBII-165, LMK38, and trans-sterol. Cells were treated with mβCD-complexed probes 1 or 2 (10 μM, 1 h) followed by PA (10 mM) and irradiation with visible light (15 W yellow LED, 170,000 Lux max intensity, on ice, 5 min), or mβCD-complexed NBII-165, LKM38, or trans-sterol (10 μM, 1 h) and irradiated with UV light (365 nm, 22 °C, 15 min) for diazirine probes. Following irradiation, lysed samples were subjected to click conjugation to biotin-azide, streptavidin enrichment, tryptic digest, LC-MS/MS analysis, search, and label free quantification (LFQ) using MSFragger. Enrichment criteria: log2(FC) > 1, p < 0.05. (C, D) Comparison of the unique and shared proteins enriched by mβCD-complexed 1 and 2, with ‘C’ showing overlap and ‘D’ comparing fold enrichment. (E) Overlap of proteins enriched by mβCD-complexed Cholesterol-JF570 probe 1 and established cholesterol-diazirine probes. (F) Comparison of lipid and sterol-related proteins enriched by each probe. Coloring corresponds to increased LFQ log2(FC) values, p < 0.05; grey indicates p > 0.5. (G) Confocal microscopy images of probe fluorescence in human aortic endothelial cells treated with mβCD-1 over time. Cells were treated with mβCD (2.5 mM, 15 min) to deplete cholesterol, washed, then treated with mβCD-1 (2 μM, 5 min) before images were taken. Scale bars = 50 μM. For ‘C’-‘F’, variances were calculated for each sample-condition pairing and a corresponding two-tailed t-test was performed to generate p-values. n=3 per group. LFQ-MBR: label-free quantification-match between runs; FC: fold change; ND: not detected. All MS data and lists of ‘cholesterol-binding proteins’ and ‘cholesterol-related proteins’ can be found in Data S2.
Figure 3:
Figure 3:. Competition of probe 1 by cholesterol identifies the ER-membrane complex (EMC) as a cholesterol-interacting complex.
(A) Workflow for cell-based competitive chol-POCA where cells are pre-treated with either vehicle (1 h) or mβCD-complexed cholesterol (100 μM, 30 min) followed by mβCD-1 (10 μM, 30 min) and subsequent POCA proteomic analysis. (B) Comparison of significant (p<0.05) protein LFQ log2(FC) values for light-dependent enrichment by mβCD-1 and off-competed labeling by excess cholesterol. (C, D) Lysate-based CETSA analysis of HEK293T proteome treated with (C) 25-OHC (10 μM) or (D) palmitic acid (10 μM) and heated (3 min) at the indicated temperatures, followed by centrifugation, and immunoblot analysis n=1. (E) Cell-based CETSA analysis of HEK293T cells treated with either mβCD-complexed cholesterol (150 μM, 30 min) or 25-OHC (10 μM, 30 min) and cells heated (3 min) at the indicated temperatures followed by lysis, centrifugation and immunoblot. Blot shown is representative of n=3 independent experiments, see Figure S28 for all replicates. (F) Acute cholesterol depletion with mβCD leads to increased amounts of soluble EMC subunits. HEK293T cells were treated with mβCD (2.5 mM) for the indicated time, harvested, and lysed in the presence of 0.4% NP-40. (G) Affinity-purification mass spectrometry analysis identifies VAPB and YME1L as cholesterol-dependent interactors of the EMC. HEK293T cells transiently expressing EMC7-FLAG had cholesterol extracted via treatment with mβCD (2.5 mM, 30 min) or cholesterol loaded by the addition of mβCD-cholesterol (150 10 μM, 30 min) before cells were lysed in the presence of 0.4% NP-40, pull-down with anti-FLAG resin, washed, and bound proteins were digested with trypsin before LC-MS/MS analysis and quantification of protein intensities. EMC subunits are blue-colored data points, and all fall in the ‘not significant’ portion of the graph. For measures of statistical significance used in parts ‘B’ and ‘G’, variances were calculated for each sample-condition pairing and a corresponding two-tailed t-test was performed to generate p-values. Competition experiments (+/- cholesterol) were performed with 4 replicates (2 biological, 2 technical); labeling experiments (+/- hv) used 6 replicates; AP-MS experiments used 6 replicates. 25-OHC: 25-hydroxycholesterol; chol: cholesterol; EMC: ER membrane complex; AP-MS: affinity purification-mass spectrometry. All MS data can be found in Data S3.
Figure 4.
Figure 4.. Proteomic profiling of cholesterol-associated proteins in hepatocytes using HDL-complexed POCA probe 1
. A) Schematic workflow for the HDL complexation of probe 1 and enrichment of different cellular proteins in hepatocyte cell lines. B) Light-dependent POCA analysis of cholesterol depleted (simvastatin and mevalonate in LPDS) primary murine hepatocytes with HDL-complexed probe 1 (100 μg/mL). C) Comparison of light-dependent HDL-enriched proteins from primary hepatocytes in ‘B’ to proteins identified for HDL-POCA labeling of HepG2 and SR-B1-overexpressing HepG2 after cholesterol depleted (Simvastatin and mevalonate in LPDS) and POCA labeling with HDL-complexed probe 1 (100 μg/mL). D) Immunoblot confirmation of SR-B1 overexpression in HepG2 cells. E) Subcellular compartments enriched for subset of proteins identified in primary hepatocytes and SR-B1-overexpressing HepG2 (75 proteins from ‘D).’ F) Assessment of how SR-B1 overexpression impacts cellular protein expression levels, as analyzed by LFQ analysis of bulk tryptic digests comparing HepG2 to SR-B1-overexpressing HepG2 cells. G) Assessing the contributions of SR-B1-induced changes to protein abundance to POCA enrichment. LFQ bulk abundance changes from ‘F’ were compared to SR-B1-induced changes to POCA enrichment from ‘D.’ Blue-decreased protein abundance, magenta-increased protein abundance. Circled points-proteins enriched by HDL-POCA in primary hepatocytes from 'B.’ Proteins labeled in parts ‘B’ and ‘G’ according to annotations with cholesterol processes. For proteins with log2(FC) >1 or <-1, only data points with p<0.05 are shown. For measures of statistical significance used in parts ‘B’, ‘C’, ‘E’, ‘F’, and ‘G’, variances were calculated for each sample-condition pairing and a corresponding two-tailed t-test was performed to generate p-values. n=3 per group for MS datasets. MS data can be found in Data S4.
Figure 5:
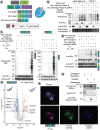
Figure 5:. Investigation of the cholesterol transport protein Aster-B using Halo-POCA.
(A) Shows scheme of murine (mAster) fusion proteins and highlights the cholesterol-binding Aster domain. (B) Cholesterol probes label full-length and ΔERD Aster constructs. HEK293T cells were transfected with the corresponding HaloTag-Aster construct, treated with mβCD-complexed probe (10 μM), labeled with the appropriate workflow, click conjugation to rhodamine-azide and visualization of the labeled proteins by fluorescent gel. (C) Gel-based analysis of photocatalytic protein alkynylation of the full-length and GRAM fusion proteins transiently overexpressed in HEK293T cells subjected to POCA labeling, click conjugation to biotin-azide and streptavidin blot. Arrows indicate labeling of the Aster construct. (D) Immunoblot detection of the indicated transiently co-expressed Aster fusion proteins after labeling with JF570-HTL and light irradiation in HEK293T cells. (E) POCA analysis of transiently overexpressed full-length HaloTag-mAster-B comparing cholesterol-depleted (1% LPDS/DMEM, overnight) versus cholesterol-loaded (addition of mβCD-cholesterol to depleted cells, 100 μM, 40 min) HEK293T cells. n=3 per group. (F) Imaging of HeLa cells stably expressing HaloTag-mAster-B, labeled with JF570-HTL, and stained for FLOT1. Additional images can be found in Figure S44. Scale bars = 10 μm. Each channel is a 1.0 μm thick slice. (G) Immunoblot assessment of protein localization to detergent resistant versus detergent soluble fractions derived from HEK293T cells overexpressing GRAM-Aster-B (for full-length protein see Figure S46), pulsed with either vehicle of mβCD-cholesterol (100 μM), stained with accessible cholesterol binder ALOD4, and fractionated using a linear iodixanol gradient. For measures of statistical significance used in part ‘E’, variances were calculated for each sample-condition pairing and a corresponding two-tailed t-test was performed to generate p-values. n=3 per group for MS datasets. MS data can be found in Data S5.

References

    1. Singer S. J. & Nicolson G. L. The fluid mosaic model of the structure of cell membranes. Science 175, 720–731 (1972). - PubMed
    1. Simons K. & van Meer G. Lipid sorting in epithelial cells. Biochemistry 27, 6197–6202 (1988). - PubMed
    1. Wang H., Chen J., Hollister K., Sowers L. C. & Forman B. M. Endogenous bile acids are ligands for the nuclear receptor FXR/BAR. Mol. Cell 3, 543–553 (1999). - PubMed
    1. Breslowa J. L., Lothrop D. A., Spaulding D. R. & Kandutsch A. A. Cholesterol, 7-ketocholesterol and 25-hydroxycholesterol uptake studies and effect on 3-hydroxy-3-methylglutaryl-coenzyme a reductase activity in human fibroblasts. Biochimica et Biophysica Acta (BBA) - Lipids and Lipid Metabolism 398, 10–17 (1975). - PubMed
    1. Ohashi R., Mu H., Wang X., Yao Q. & Chen C. Reverse cholesterol transport and cholesterol efflux in atherosclerosis. QJM 98, 845–856 (2005). - PubMed

Publication types

LinkOut - more resources