[Preprint]. 2025 Apr 25:2024.08.19.608575.
doi: 10.1101/2024.08.19.608575.

Malnutrition drives infection susceptibility and dysregulated myelopoiesis that persists after refeeding intervention

Affiliations

Malnutrition drives infection susceptibility and dysregulated myelopoiesis that persists after refeeding intervention

Alisa Sukhina et al. bioRxiv. .

Update in

Abstract

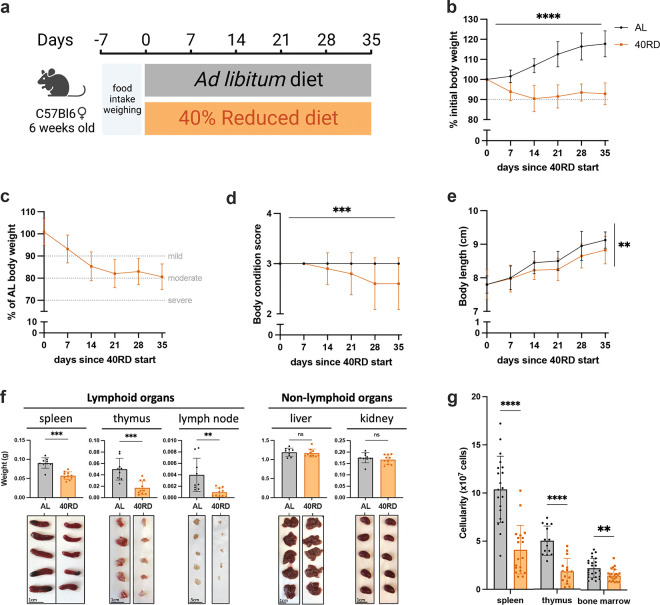
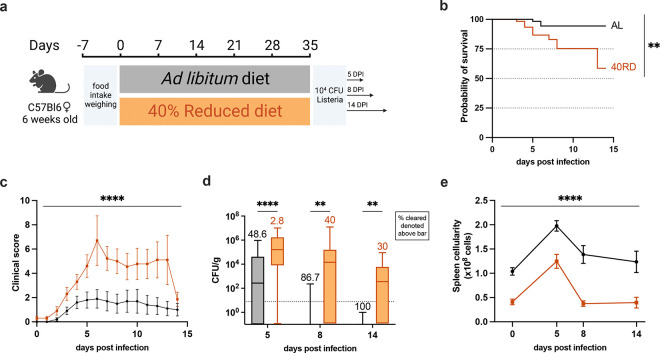
Undernutrition is one of the largest persistent global health crises, with nearly 1 billion people facing severe food insecurity. Infectious disease represents the main underlying cause of morbidity and mortality for malnourished individuals, with infection during malnutrition representing the leading cause of childhood mortality worldwide. In the face of this complex challenge, simple refeeding protocols have remained the primary treatment strategy. Although an association between undernutrition and infection susceptibility has been appreciated for over a century, the underlying mechanisms remain poorly understood and the extent to which refeeding intervention is sufficient to reverse nutritionally acquired immunodeficiency is unclear. Here we investigate how malnutrition leads to immune dysfunction and the ability of refeeding to repair it. We find that chronic malnutrition induced through prolonged dietary restriction (40% reduction in food intake) severely impairs the ability of mice to control a sub-lethal Listeria monocytogenes infection. Malnourished mice exhibit blunted immune cell expansion, impaired immune function, and accelerated contraction prior to pathogen clearance. While this defect is global, we find that myelopoiesis is uniquely impacted, resulting in reduced neutrophil and monocyte numbers prior to and post-infection. Upon refeeding, we observe that mice recover body mass, size, cellularity across all major immune organs, the capacity to undergo normal immune cell expansion in response to infection, and a restoration in T cell responses. Despite this broad improvement, refed mice remain susceptible to Listeria infection, uncoupling global lymphoid atrophy from immunodeficiency. We find peripheral neutrophil and monocyte numbers fail to fully recover and refed mice are unable to undergo normal emergency myelopoiesis. Altogether, this work identifies dysregulated myelopoiesis as a link between prior nutritional state and immunocompetency. We believe these findings raise the possibility that exposure to food scarcity should be treated as an immunologic variable, even post-recovery, with considerations for how patient medical history and public health policy.


Figures

Figure 1.
Figure 1.. Sustained dietary restriction recapitulates the hallmarks of nutritionally acquired immunodeficiency.
(a) Schematic of experimental design for 40% reduced diet (40RD, orange) in comparison to control ad libitum (AL, black) diet. (b) Body weight of AL and 40RD mice as a percentage of initial body weight over time (n=50). The dotted line represents 10% of initial body weight lost. (c) Body weight of 40RD mice as a percentage of age matched average AL body weight over time (n=50). Each dotted line represents clinical designations of undernutrition severity. (d) Body condition score of AL and 40RD mice over time (n=10). (e) Body length of AL and 40RD mice over time, measured from the nose tip to the base of the tail (n=10). (f) Comparative weights of AL and 40RD lymphoid and non-lymphoid tissues (n=10) with representative photos of the corresponding organs. Scale bars 1 cm (0.5 cm for lymph nodes). (g) Total live cell counts for whole spleen (n=15), thymus (n=15), and bone marrow (n=10). Statistics: (b-g) Plotted as mean ± SD; (b,d) simple linear regression with slope comparisons; (e) simple linear regression with elevation comparison; and (f,g) two-tailed Mann-Whitney test.
Figure 2.
Figure 2.. Chronic malnutrition results in a failure to control sub-lethal L. monocytogenes infection.
(a) Schematic of Lm infection (104 CFUs per mouse) experimental design in AL (orange) and 40RD (black) mice. Mice were maintained on the corresponding diet throughout the course of the infection. (b) Probability of survival for infected AL and 40RD mice over time. The curves represent pooled data from 3 experimental groups: 5DPI (n=25), 8DPI (n=15), and 14DPI (n=10). Statistics done via log-rank test. (c) Clinical score for infected AL and 40RD mice over time from 14DPI group. Plotted as mean ± SEM; statistics done via mixed-effect two-way ANOVA analysis. (d) Pathogen burden in liver tissue of AL and 40RD mice. Percentage of mice that cleared the pathogen on a given day is represented as numbers above corresponding bars. The dotted line represents the limit of detection. Plotted as box and min to max whiskers; statistics done via two-tailed Mann-Whitney test for each time point. (e) Total splenocyte counts for infected AL and 40RD mice over time. Uninfected spleen cell counts same as used for Figure 1g. Plotted as mean ± SEM; statistics done via mixed-effect two-way ANOVA analysis.
Figure 3.
Figure 3.. Chronic malnutrition diminishes T cell expansion and function while accelerating contraction during infection.
AL and 40RD mice were infected with Lm at 104 CFUs per mouse. Splenocytes were counted and flow cytometry was performed at days 0, 5, 8, and 14 post-infection to evaluate the total cell number of (a) antigen-experienced CD8+ T cells gated on live single CD8+ CD44hi CD62Llow and (b) short lived effector cells further gated on KLRG1hi CD127low. Plotted as mean ± SEM; statistics done via mixed-effect two-way ANOVA analysis. Splenocytes from AL (n=10) and 40RD (n=10) mice were harvest at day 8 post-infection and stimulated ex vivo with OVA peptide for 6 hours. Intracellular flow cytometry was performed to quantify (c) total cell number of and (d) mean fluorescence intensity (MFI) of antigen-experienced CD8+ T cells expressing IFNγ and TNFα. Plotted as mean ± SD; statistics done via two-tailed Mann-Whitney test for each cytokine. (e) Representative flow cytometry data of (c,d), with average frequencies shown.
Figure 4.
Figure 4.. Chronically malnourished mice display dysregulated myelopoiesis.
(a) Total bone marrow cell counts from day 5 post-infection AL (n=18) and 40RD (n=16) mice. Bone marrow cells and splenocytes were counted and flow cytometry was performed at days 0 (n=10 for both AL and 40RD) and 5 post Lm infection in AL and 40 RD mice to evaluate (b) the total cell number of neutrophils and (c) the relative frequency of neutrophils among live cells. (d) Representative flow cytometry data for the results in (b,c), with average frequencies shown. (e) A simplified schematic representation of myelopoiesis showing pre-GM and GMP as key progenitors in granulocyte/monocyte lineage. Bone marrow cells and splenocytes were counted and flow cytometry was performed at days 0 and 5 post Lm infection in AL and 40 RD mice to evaluate the total cell number of (f) pre-GM cells (Lineage Sca1 CD117+ CD150 CD16/32 CD105) and (g) GMP cells (Lineage Sca1 CD117+ CD150 CD16/32+). (h) Representative flow cytometry results for the myeloid progenitor data in (f,g), with average frequencies shown. Statistics: (a-c,f,g) Plotted as mean ± SEM; statistics done via two-tailed Mann-Whitney test for each time point.
Figure 5.
Figure 5.. Refeeding intervention reverses wasting, stunting, and global immune atrophy.
(a) Schematic of the experimental design for refeeding intervention (RF) in comparison to age-matched 40RD and control AL diet. (b) Body weight of AL (n=25), 40RD (n=10), and RF (n=25) mice as a percentage of their initial body weight over time. The dotted line represents 10% of initial body weight lost, and the shaded area represents the normal weight range for age-matched female C57Bl6 mice(C). (c) Body weight of 40RD (n=10) and RF (n=25) mice as a percentage of age matched average AL body weight over time. Each dotted line represents clinical designations of undernutrition severity. (d) Body length of AL and 40RD mice over time, measured from the nose tip to the base of the tail (n=10). (e) Total cell counts for whole spleen, thymus, and bone marrow from AL and RF mice (n=10). (f) Comparative weights of AL and RF lymphoid and non-lymphoid tissues (n=10) with representative photos of the corresponding organs. Scale bars 1 cm (0.5 cm for lymph nodes). Statistics: (b-f) Plotted as mean ± SD; (b,d) simple linear regression with slope comparisons; and (e,f) two-tailed Mann-Whitney test.
Figure 6.
Figure 6.. Refeeding intervention fails to restore immunocompetency and normal myelopoiesis.
(a) Schematic of Lm infection (104 CFUs per mouse) experimental outline in AL, 40RD, and RF mice. Mice were maintained on the corresponding diet throughout the course of the infection. (b) Probability of survival for infected AL (n=25), 40RD (n=10), and RF (n=25) mice over time. Statistics done via log-rank test. (c) Pathogen burden in liver tissue of 5 DPI AL (n=25), 40RD (n=10), and RF (n=25) mice. Percentage of mice that cleared the pathogen on a given day is represented as numbers above corresponding bars. The dotted line represents the limit of detection. Plotted as box and min to max whiskers; statistics done via Kruskal-Wallis test. (d) Total splenocyte and bone marrow cell counts for AL (n=15) and RF (n=15) mice at day 5 post-infection. (e) Total cell number of CD44+CD8+ T cells in AL and RF mice at days 0 and 5 post-infection. Splenocytes from AL and RF mice were harvest at day 5 post-infection and stimulated ex vivo with OVA peptide for 6 hours. Intracellular flow cytometry was performed to quantify (f) total cell number of and (g) mean fluorescence intensity (MFI) of antigen-experienced CD8+ T cells expressing IFNγ and TNFα. (h) Representative flow cytometry results for data in (f,g), with average frequencies shown. (i) Total splenic neutrophils abundance in AL and RF mice at days 0 and 5 post-infection. (j) Representative flow cytometry results for day 5 post-infection neutrophil data in (i), with average frequencies shown. At days 0 and 5 post-infection, spleens from AL and RF were evaluate for the total number of (k) pre-GM cells and (l) GMP cells. (m) Representative flow cytometry results plots for the myeloid progenitor data in (k,l), with average the average frequencies shown. Statistics: (d-g) Plotted as mean ± SD; statistics done via two-tailed Mann-Whitney test for each category. (i,k,l) Plotted as mean ± SEM; statistics done via two-tailed Mann-Whitney test for each time point.

References

    1. Antwi A. Assessment and management of severe malnutrition in children. 2011. West Afr J Med. 30:11–8. doi: 10.4314/wajm.v30i1.69878. - DOI - PubMed
    1. Ashworth A, Khanum S, Jackson A, Schofield EC. 2003. Guidelines for the inpatient treatment of severely malnourished children. World Health Organization.
    1. Bhattacharjee A, Burr AHP, Overacre-Delgoffe AE, Tometich JT, Yang D, Huckestein BR, Linehan JL, Spencer SP, Hall JA, Harrison OJ, Morais da Fonseca D, Norton EB, Belkaid Y, Hand TW. 2021. Environmental enteric dysfunction induces regulatory T cells that inhibit local CD4+ T cell responses and impair oral vaccine efficacy. Immunity 54:1745–1757.e7. doi: 10.1016/j.immuni.2021.07.005 - DOI - PMC - PubMed
    1. Beisel WR. 1996. Nutrition and Immune Function: Overview. J Nutr 126:2611S–2615S. doi: 10.1093/jn/126.suppl_10.2611S - DOI - PubMed
    1. Beisel WR. 1982. Single nutrients and immunity. Am J Clin Nutr 35:417–468. doi: 10.1093/ajcn/35.2.417 - DOI - PubMed

Publication types

LinkOut - more resources