[Preprint]. 2024 Dec 9:2024.08.22.609165.
doi: 10.1101/2024.08.22.609165.

Dysfunctional mechanotransduction regulates the progression of PIK3CA-driven vascular malformations

Affiliations

Dysfunctional mechanotransduction regulates the progression of PIK3CA-driven vascular malformations

Wen Yih Aw et al. bioRxiv. .

Update in

Abstract

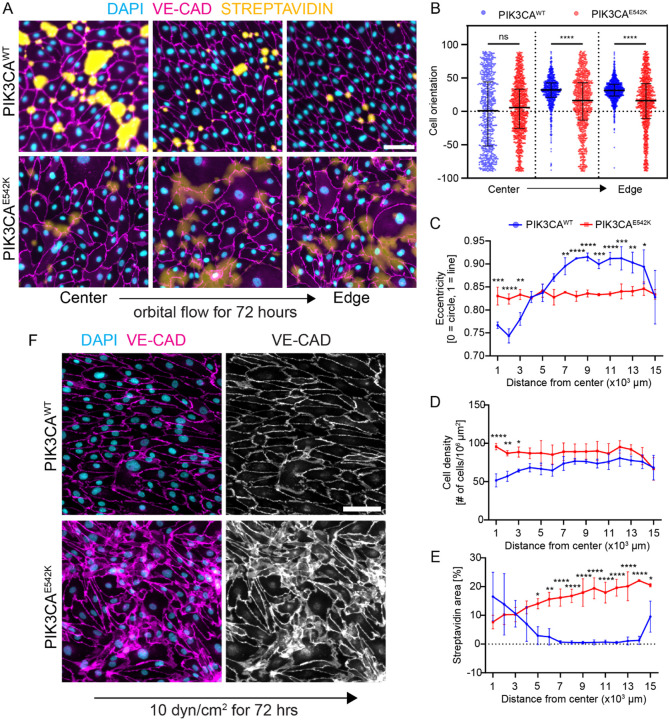
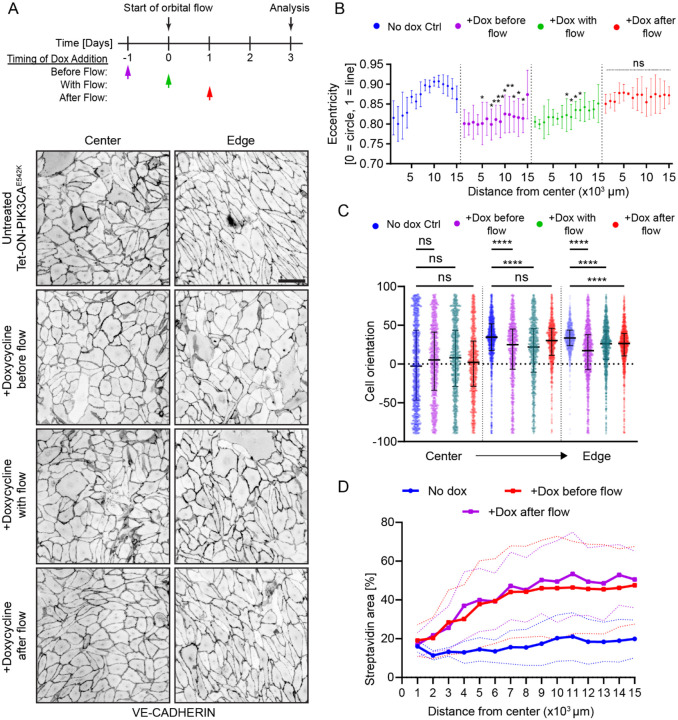
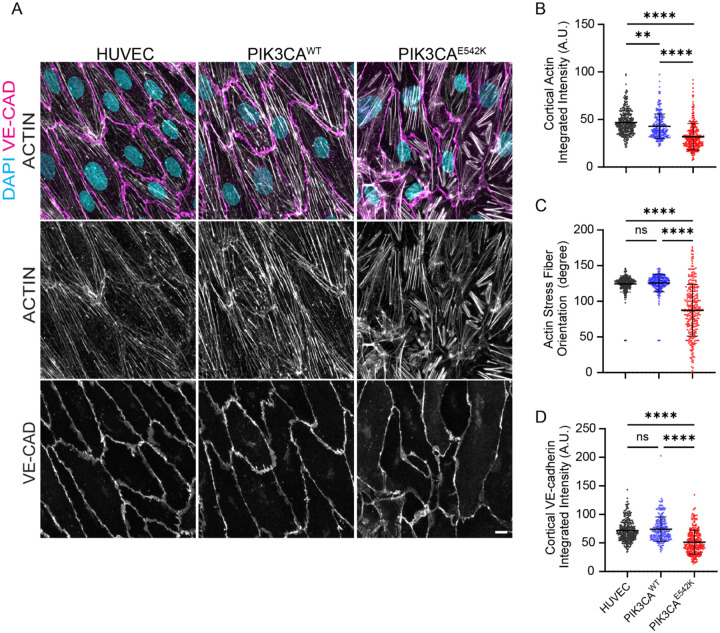
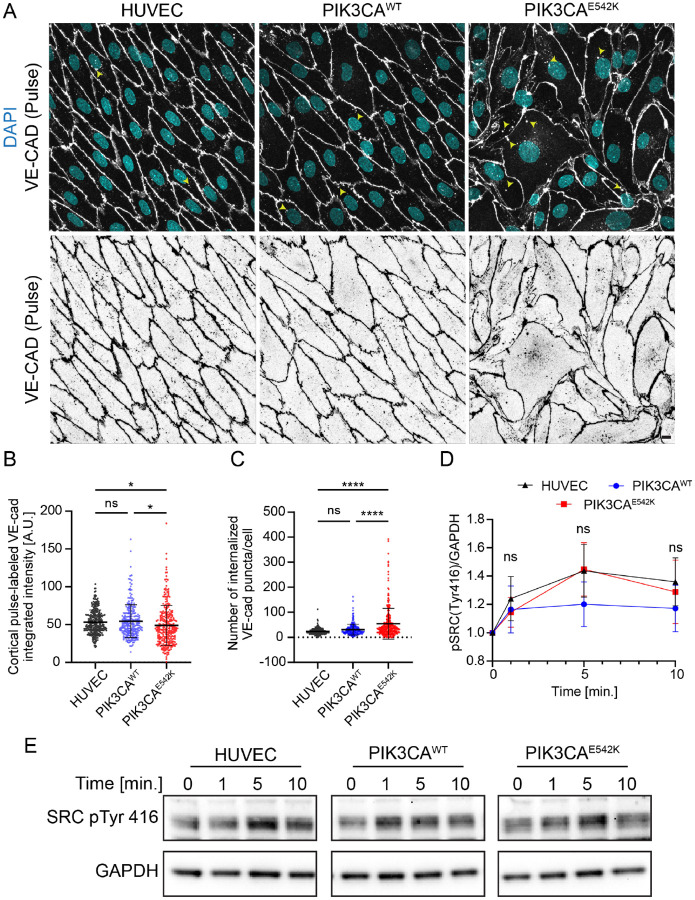
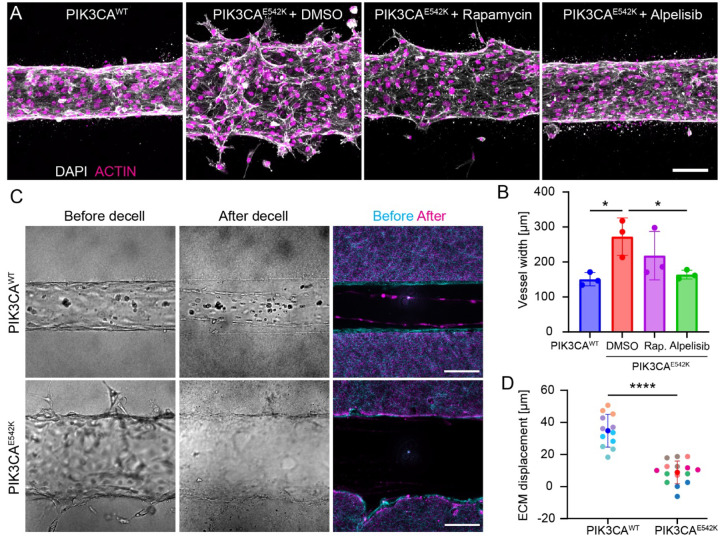
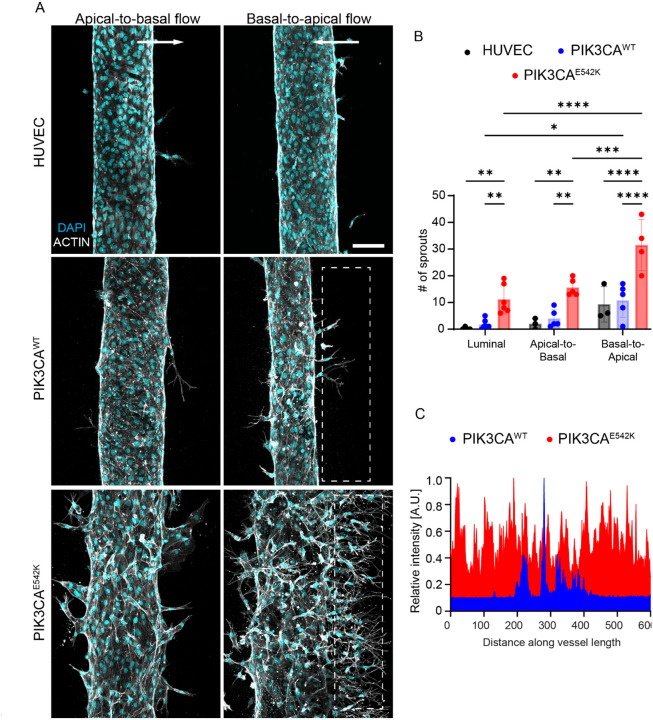
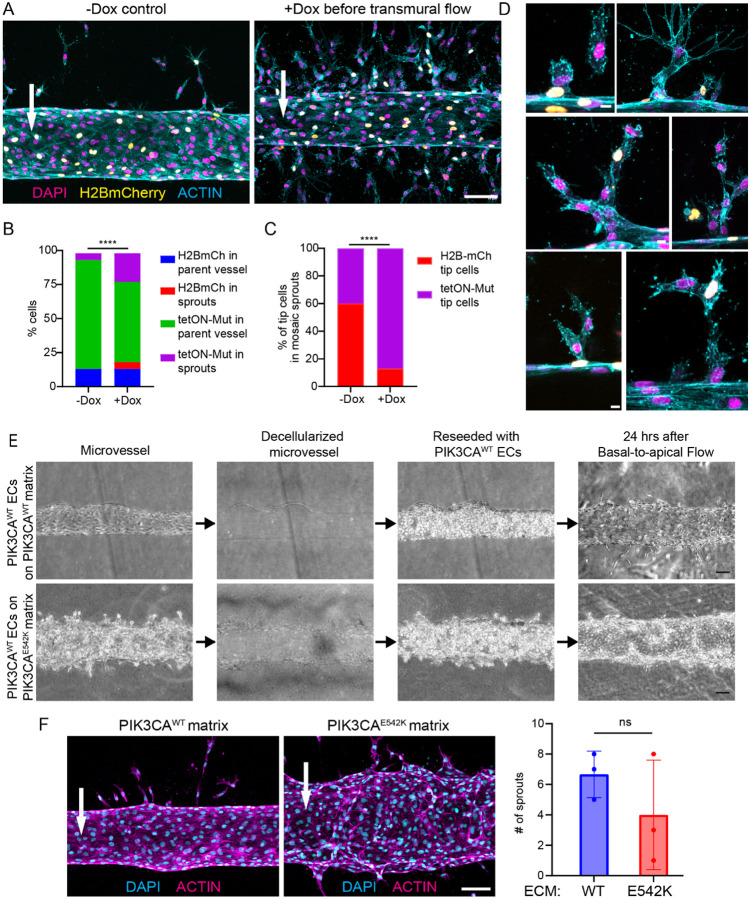
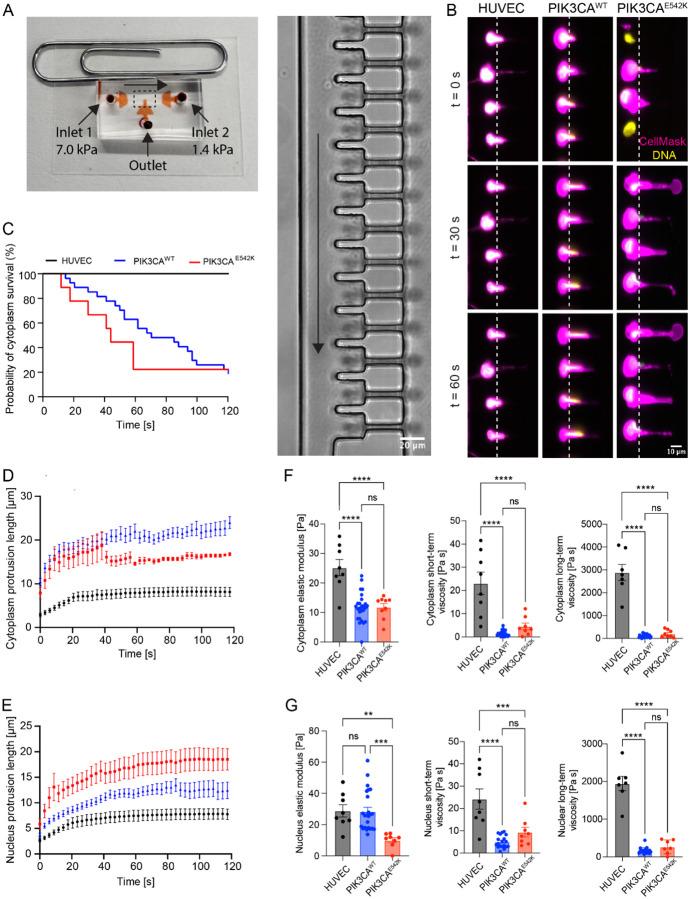
Somatic activating mutations in PIK3CA are common drivers of vascular and lymphatic malformations. Despite common biophysical signatures of tissues susceptible to lesion formation, including compliant extracellular matrix and low rates of perfusion, lesions vary in clinical presentation from localized cystic dilatation to diffuse and infiltrative vascular dysplasia. The mechanisms driving the differences in disease severity and variability in clinical presentation and the role of the biophysical microenvironment in potentiating progression are poorly understood. Here, we investigate the role of hemodynamic forces and the biophysical microenvironment in the pathophysiology of vascular malformations, and we identify hemodynamic shear stress and defective endothelial cell mechanotransduction as key regulators of lesion progression. We found that constitutive PI3K activation impaired flow-mediated endothelial cell alignment and barrier function. We show that defective shear stress sensing in PIK3CA E542K endothelial cells is associated with reduced myosin light chain phosphorylation, junctional instability, and defective recruitment of vinculin to cell-cell junctions. Using 3D microfluidic models of the vasculature, we demonstrate that PIK3CA E542K microvessels apply reduced traction forces and are unaffected by flow interruption. We further found that draining transmural flow resulted in increased sprouting and invasion responses in PIK3CA E542K microvessels. Mechanistically, constitutive PI3K activation decreased cellular and nuclear elasticity resulting in defective cellular tensional homeostasis in endothelial cells which may underlie vascular dilation, tissue hyperplasia, and hypersprouting in PIK3CA-driven venous and lymphatic malformations. Together, these results suggest that defective nuclear mechanics, impaired cellular mechanotransduction, and maladaptive hemodynamic responses contribute to the development and progression of PIK3CA-driven vascular malformations.

Keywords: PIK3CA; Vascular malformations; hemodynamics; mechanotransduction; organs-on-chip; transmural flow; vascular tissue engineering.


Conflict of interest statement

Conflict of Interest The authors have no conflicts to disclose.

Figures

Figure 1.
Figure 1.. Constitutive PI3K activation impedes shear stress-induced endothelial cell alignment and vascular barrier function
. (A) Representative images of PIK3CAWT and PIK3CAE542K HUVECs cultured on biotinylated fibronectin for 72 hr under orbital shaking conditions. Cells were labeled with DAPI (cyan) and VE-cadherin (magenta). Monolayer permeability was assessed through streptavidin labeling (yellow). Scale bar = 10 μm. (B) Quantification of cellular orientation in the central, middle, or outer edge region of the well after exposure to orbital shaking (n = 3; mean ± s.d., Kruskal-Wallis test followed by Dunn’s test). (C) Quantification of cellular eccentricity as a function of radial distance from the center of the well for PIK3CAWT and PIK3CAE542K HUVECs (n = 3; mean ± s.d., two-way analysis of variance (ANOVA) followed by Šidák’s test). (D) Quantification of cell density as a function of radial distance from the center of the well for PIK3CAWT and PIK3CAE542K HUVEC (n = 3; means ± s.d., two-way ANOVA followed by Šidák’s test). (E) Quantification of streptavidin intensity as a function of radial distance from the center of the well for PIK3CAWT and PIK3CAE542K HUVECs (n = 3; mean ± s.d., two-way ANOVA followed by Šidák’s test). (F) Representative images of PIK3CAWT and PIK3CAE542K HUVECs exposed to 10 dyn/cm2 laminar shear stress in a Hele-Shaw flow cell. Scale bar = 10 μm. *p< 0.05, **p< 0.01, ***p< 0.001, ****p< 0.0001 for all plots.
Figure 2.
Figure 2.. Preconditioning with shear stress prior to the induction of PIK3CAE542K expression restores shear stress-mediated EC alignment but not barrier function.
(A) Schematic of experimental workflow and representative images of VE-cadherin staining in control cells and cells where expression of PIK3CAE542K was induced 24 hr before flow, at the onset of flow, or 24 hr after flow. Images were captured near the center of the well or near the outer edge of the well. Scale bar = 10 μm. (B) Quantification of cellular eccentricity as a function of radial distance for control cells as well as for cells induced with doxycycline 24 hr before flow, at the onset of flow, or 24 hr after flow (n = 3; mean ± s.d., two-way ANOVA followed by Šidák’s test). (C) Quantification of cellular orientation in the central, middle, or outer region of the well for cells induced with doxycycline 24 hr before flow, at the onset of flow, or 24 hr after flow (n = 3; mean ± s.d., Kruskal-Wallis tests followed by Dunn’s test). (D) Quantification of streptavidin area as a function of radial distance from the center of the well for control cells, cells induced with doxycycline 24 hr before flow, and cells induced with doxycycline 24 hr after flow (n = 3; mean ± s.d. (dotted lines), ANOVA followed by Dunnett test). *p< 0.05, **p< 0.01, ***p< 0.001, ****p< 0.0001 for all plots.
Figure 3.
Figure 3.. Loss of stress fiber alignment, reduced cortical actin formation, and decreased VE-cadherin accumulation at cell-cell contacts in PIK3CAE542K endothelium.
(A) Representative confocal images of untransduced HUVECs, PIK3CAWT, and PIK3CAE542K HUVECs stained for DAPI (blue), actin (grey), and VE-cadherin (magenta). Cells were cultured under orbital flow for 72 hours. Scale bar = 10 μm. (B) Quantification of the integrated intensity of actin fluorescence signal at cell-cell contacts (n = 320 untransduced HUVECs, 244 PIK3AWT and 297 PIK3CAE542K cells; mean ± s.d., one-way ANOVA followed by Tukey’s test). (C) Angular distribution of stress fiber orientation in flow-conditioned untransduced HUVECs, PIK3CAWT, and PIK3CAE542K HUVECs (n = 324 untransduced HUVECs, 248 PIK3AWT and 296 PIK3CAE542K cells; mean ± s.d., one-way ANOVA followed by Kruskal-Wallis test). (D) Quantification of endogenous VE-cadherin fluorescence signal at cell-cell contacts (n = 320 untransduced HUVECs, 244 PIK3AWT and 297 PIK3CAE542K cells; mean ± s.d., one-way ANOVA followed by Tukey’s test).
Figure 4.
Figure 4.. Increased junctional VE-cadherin turnover with normal shear-stress induced SRC phosphorylation in mutant PIK3CAE542K ECs.
(A) Representative confocal images of untransduced HUVECs, PIK3CAWT, and PIK3CAE542K HUVECs, where the surface-pool of VE-cadherin (grey) was pulse-labeled with a fluorescently conjugated VE-cadherin antibody prior to fixation and permeabilization. Unbound antibodies were washed, and cells were fixed and stained with DAPI (blue) after a 2-hour chase period with media. Yellow arrowheads indicate internalized pulse-labeled VE-cadherin puncta. Scale bar = 10 μm. (B) Quantification of pulse-labeled VE-cadherin intensity at cell-cell contacts.junctions. (C) Quantification of the number of VE-cadherin-positive puncta per cell (n = 316 untransduced HUVECs, 245 PIK3AWT and 294 PIK3CAE542K cells; mean ± s.d., one-way ANOVA followed by Tukey’s test). (D) Changes in phospho-SRC(Y416) (active-Src) level in untransduced HUVECs, PIK3CAWT, and PIK3CAE542K HUVECs in response to the application orbital flow (n = 3; mean ± s.d., two-way ANOVA followed by Tukey’s test). (E) Representative western blot analysis of phospho-SRC(Y416) levels in HUVECs, PIK3CAWT, and PIK3CAE542K HUVECs subjected to laminar shear stress through orbital shaking for the indicated time points.
Figure 5.
Figure 5.. Loss of junctional vinculin recruitment in PIK3CAE542K endothelium.
(A) Representative confocal images of untransduced HUVECs, PIK3CAWT and PIK3CAE542K HUVECs stained for vinculin (grey), and DAPI (blue). Scale bar = 10 μm. (B) Quantification of percent vinculin area at cell-cell contacts (n = 119 untransduced HUVECs, 157 PIK3AWT and 156 PIK3CAE542K cells; mean ± s.d., one-way ANOVA followed by Tukey’s test). (C) Representative confocal images of vinculin localized at focal adhesions in flow-conditioned PIK3CAWT and PIK3CAE542K. Cells were partially permeabilized during fixation and stained for DAPI (blue) VE-cadherin (red) and vinculin (grey). Scale bar = 10 μm. (D) Western blots and (E) quantification for β-catenin, VE-cadherin, phospho-myosin light chain 2, and vinculin level in PIK3CAWT or PIK3CAE542K cells (n = 3; mean ± s.d., two-tailed unpaired t-test). *p< 0.05, **p< 0.01, ***p< 0.001, ****p< 0.0001 for all plots.
Figure 6.
Figure 6.. PIK3CAE542K ECs form dilated microvessels with increased sprouting and reduced traction forces.
(A) Representative confocal images (maximum intensity projections) of PIK3CAWT and PIK3CAE542K microvessels treated with DMSO, 1 μM alpelisib, or 1 μM rapamycin. Scale bar = 100 μm. (B) Quantification of vessel width in PIK3CAWT microvessels or PIK3CAE542K microvessels treated with DMSO load control, rapamycin (rap.), or alpelisib (n = 3; mean ± s.d., one-way ANOVA followed by Tukey test). (C) Representative phase contrast (grey) and confocal reflectance (cyan and magenta) images of PIK3CAWT and PIK3CAE542K microvessels before and after decellularization. (D) Quantification of subluminal ECM displacement before and after decellularization of PIK3CAWT or PIK3CAE542K microvessels (n ≥ 4 microvessels, 3 measurements per microvessel; data points from same devices are color-matched; mean ± s.d., two-tailed unpaired t-test). *p< 0.05, **p< 0.01, ***p< 0.001, ****p< 0.0001 for all plots.
Figure 7.
Figure 7.. PIK3CAE542K microvessels are unresponsive to flow interruption.
(A) Representative images of microvessels generated from PIK3CAWT and PIK3CAE542K HUVECs. Microvessels were exposed to continuous rocking 48 hr and stained for DAPI (cyan), VE-cadherin (white), and F-actin (magenta). Scale bars = 100 μm. (B) Representative images of PIK3CAWT and PIK3CAE542K microvessels exposed to 24 hr rocking followed by 24 hr static conditions and stained for DAPI (cyan), VE-cadherin (white), and F-actin (magenta). Scale bars = 100 μm. (C) Quantification of vessel width, number of cells, vessel area, and gap area for PIK3CAWT and PIK3CAE542K microvessels exposed to either continuous or interrupted flow (n ≥ 4; mean ± s.d., two-way ANOVA). *p< 0.05, **p< 0.01, ***p< 0.001, ****p< 0.0001 for all plots.
Figure 8.
Figure 8.. Basal-to-apical transmural flow exacerbates hypersprouting in PIK3CA mutant microvessels.
(A) Representative images of HUVEC, PIK3CAWT and PIK3CAE542K microvessels exposed to continuous rocking for 48 hr and subsequently subjected to apical-to-basal (source) or basal-to-apical (sink) transmural flow for 24 hr. Scale bar = 100 μm. (B) Quantification of number of spouts in microvessels exposed to either luminal, apical-to-basal, or basal-to-apical flow (n ≥ 3; mean ± s.d., two-way ANOVA followed by Tukey test). (C) Fluorescence intensity profiles of actin channel were used to quantify number of sprouts in PIK3CAWT or PIK3CAE542K microvessels. Dashed white boxes indicate where intensity profiles were extracted. *p< 0.05, **p< 0.01, ***p< 0.001, ****p< 0.0001 for all plots.
Figure 9.
Figure 9.. Mosaic co-culture of HUVECs with PIK3CAE542K ECs resulted in increased sprouting of non-mutated HUVECs.
(A) Representative images of mosaic microvessels generated using HUVECs expressing H2BmCherry and inducible tet-ON-PIK3CAE542K. Microvessels were first exposed to continuous rocking 48 hr and then were subjected to basal-to-apical transmural flow for the next 24 hrs. PIK3CAE542K expression was induced upon the application of transmural flow. Scale bar = 100 μm. (B) Quantification of the distribution of H2BmCherry and tet-ON-PIK3CAE542K cells in mosaic vessels that were subjected to basal to apical transmural flow (n ≥ 3; chi-square test). (C) Quantification of percent H2BmCherry and tet-ON-PIK3CAE542K tip cells in mosaic sprouts (n = 5 control and 15 doxycycline treated mosaic sprouts; chi-square test). (D) Images of mosaic H2BmCherry (yellow) and tet-ON-PIK3CAE542K sprouts stained for DAPI (magenta) and actin (cyan). Scale bar = 10 μm. (E) Decellularized PIK3CAWT and PIK3CAE542K microvessels were reseeded with PIK3CAWT HUVECs. Reseeded microvessels were subjected to basal-to-apical transmural flow for 24 hr. Scale bar = 100 μm. (F) Representative confocal images and number of sprout quantifications of transmural flow conditioned PIK3CAWT microvessels cultured on extracellular matrix modified by control or mutant cells. Scale bar = 10 μm. (n = 3; mean ± s.d., unpaired two-tailed t-test).
Figure 10.
Figure 10.. Altered cytoplasmic and nuclear mechanical properties of single cells expressing PIK3CAWT or PIK3CAE542K activating mutations.
(A) An image of the microfluidic micropipette aspiration device labeled with an outlet and two inlets at differential pressures causing a flow vector between the two inlets. A magnified image depicts the dashed area, showing the array of pockets and constriction channels which trap and deform flowing cells under a constant applied pressure gradient. (B) Time-lapse images of nucleus (Hoechst) and cytoplasm (CellMask) deformation of untransduced HUVECs and endothelial cells expressing PIK3CAWT or PIK3CAE542K activating mutations. (C) Percentage of HUVECs that withstood deformation, as measured by the number of endothelial cells with intact cytoplasm after passage through the constriction channel relative to the total number of cells that entered the channels. (D) Protrusion length over time of endothelial cell cytoplasm into the constriction channels (mean ± s.e.m.). (E) Quantification of nuclear deformation over time of endothelial cells into constriction channels (mean ± s.e.m.). (F) Quantification of viscoelastic properties of the cytoplasm of endothelial cells (mean ± s.e.m., one-way ANOVA). (G) Elastic modulus, short-term viscosity, and long-term viscosity of the nuclei of HUVECs and endothelial cells expressing PIK3CAWT or PIK3CAE542K activating mutations (mean ± s.e.m., one-way ANOVA).

References

    1. Zenner K., Cheng C.V., Jensen D.M., Timms A.E., Shivaram G., Bly R., Ganti S., Whitlock K.B., Dobyns W.B., Perkins J., Bennett J.T., Genotype correlates with clinical severity in PIK3CA-associated lymphatic malformations, JCI Insight 4(21) (2019). - PMC - PubMed
    1. Kurek K.C., Luks V.L., Ayturk U.M., Alomari A.I., Fishman S.J., Spencer S.A., Mulliken J.B., Bowen M.E., Yamamoto G.L., Kozakewich H.P., Warman M.L., Somatic mosaic activating mutations in PIK3CA cause CLOVES syndrome, Am J Hum Genet 90(6) (2012) 1108–15. - PMC - PubMed
    1. Sadick M., Muller-Wille R., Wildgruber M., Wohlgemuth W.A., Vascular Anomalies (Part I): Classification and Diagnostics of Vascular Anomalies, Rofo 190(9) (2018) 825–835. - PubMed
    1. Queisser A., Seront E., Boon L.M., Vikkula M., Genetic Basis and Therapies for Vascular Anomalies, Circ Res 129(1) (2021) 155–173. - PubMed
    1. Cox J.A., Bartlett E., Lee E.I., Vascular malformations: a review, Semin Plast Surg 28(2) (2014) 58–63. - PMC - PubMed

Publication types

LinkOut - more resources