[Preprint]. 2024 Aug 22:2024.05.17.594714.
doi: 10.1101/2024.05.17.594714.

The CALERIE Genomic Data Resource

Affiliations

The CALERIE Genomic Data Resource

C P Ryan et al. bioRxiv. .

Update in

  • The CALERIE Genomic Data Resource.
    Ryan CP, Corcoran DL, Banskota N, Eckstein Indik C, Floratos A, Friedman R, Kobor MS, Kraus VB, Kraus WE, MacIsaac JL, Orenduff MC, Pieper CF, White JP, Ferrucci L, Horvath S, Huffman KM, Belsky DW. Ryan CP, et al. Nat Aging. 2025 Feb;5(2):320-331. doi: 10.1038/s43587-024-00775-0. Epub 2024 Dec 13. Nat Aging. 2025. PMID: 39672986 Clinical Trial.

Abstract

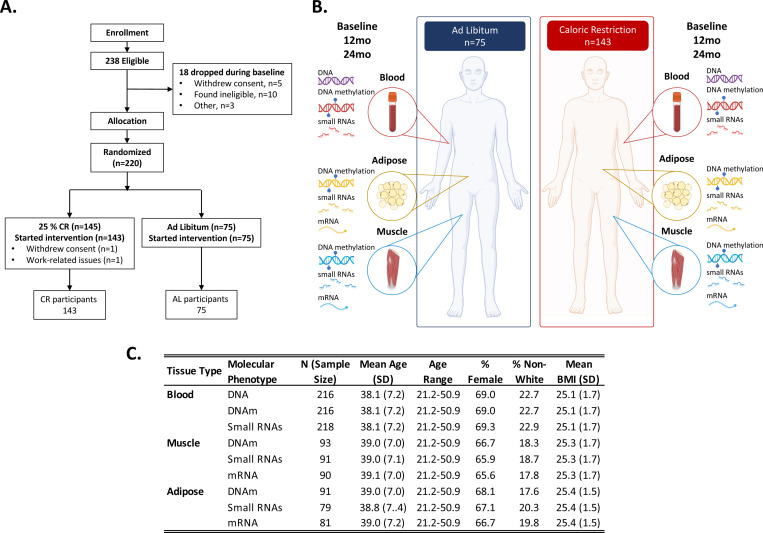
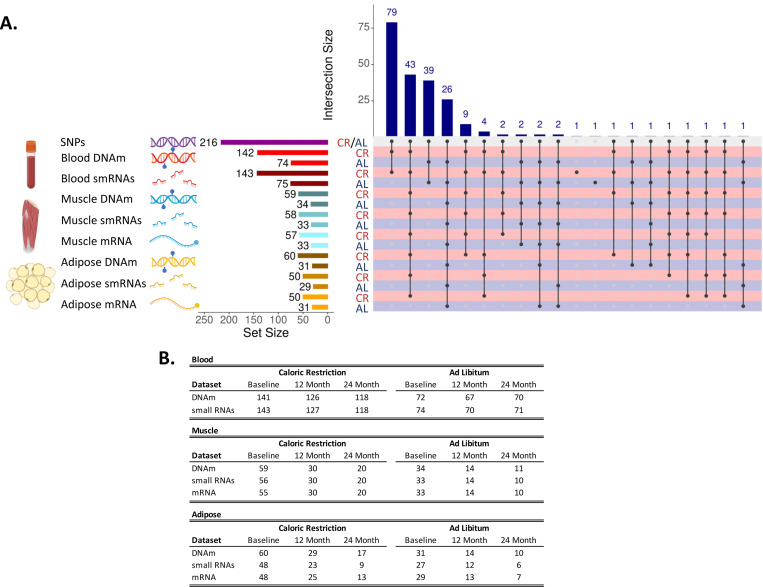
Caloric restriction (CR) slows biological aging and prolongs healthy lifespan in model organisms. Findings from CALERIE-2 - the first ever randomized, controlled trial of long-term CR in healthy, non-obese humans - broadly supports a similar pattern of effects in humans. To expand our understanding of the molecular pathways and biological processes underpinning CR effects in humans, we generated a series of genomic datasets from stored biospecimens collected from n=218 participants during the trial. These data constitute the first publicly-accessible genomic data resource for a randomized controlled trial of an intervention targeting the biology of aging. Datasets include whole-genome SNP genotypes, and three-timepoint-longitudinal DNA methylation, mRNA, and small RNA datasets generated from blood, skeletal muscle, and adipose tissue samples (total sample n=2327). The CALERIE Genomic Data Resource described in this article is available from the Aging Research Biobank. This mult-itissue, multi-omic, longitudinal data resource has great potential to advance translational geroscience.


Conflict of interest statement

Conflict of Interest. DWB and DLC are listed as inventors of the Duke University and University of Otago invention DunedinPACE, which is licensed to TruDiagnostic. DWB is consulting CSO and SAB chair of BellSant and serves on the SAB of the Hooke Clinic.

Figures

Figure 1.
Figure 1.. Study design, participant information, and overview of molecular datasets generated for the CALERIE caloric restriction trial.
Panel A shows the Consort diagram showing enrollment, eligibility, and final sample sizes by treatment group. Panel B shows a schematic of molecular data types and tissue sources. Genetic material (DNA) was derived from blood samples for both ad libitum (AL) and caloric restriction (CR) groups at baseline. DNA methylation was derived from blood, muscle, and adipose samples for both AL and CR at baseline, 12-months, and 24-months. Small RNAs were derived from blood, muscle, and adipose samples for both AL and CR at baseline, 12-months, and 24-months. mRNA was derived from muscle and adipose samples for both AL and CR at baseline, 12-months, and 24-months. Panel C shows a table of demographic information for participants that contributed data to individual tissue level molecular datasets. Total sample size, mean and standard deviation in age, age range, percent female, percent who self-reported as other than white, and mean and standard deviation of BMI. Figure created using images from Biorender.com
Figure 2.
Figure 2.
Panel A shows an upset plot showing overlap of available datasets across treatment group, tissues, molecular data type. The left-hand side shows tissue type (blood, muscle, or adipose), type of molecular data type (SNPs, DNAm, smRNAs, or mRNA), set size for each tissue and data type combination in number of unique individuals, and group (CR or AL). The bottom right-hand side shows points and connecting lines indicating overlapping intersections across tissues and data types color coded by treatment group (CR = red, AL = navy). The top right hand side shows a barchart indicating sample sizes for the overlapping intersections of tissue and datatypes. Each tissue and molecular data type combination is linked to a corresponding color scheme as follows: genomic variation (purple DNA), blood DNA methylation (red DNA with lollipops), blood small RNAs (smRNAs; dark red RNA fragments), muscle DNA methylation (blue DNA with lollipops), muscle smRNAs (blue RNA fragments), muscle mRNA (blue single RNA strand), adipose DNA methylation (yellow DNA with lollipops), adipose smRNAs (yellow RNA fragments), adipose mRNA (yellow single RNA strand). Panel B shows Individual sample numbers by molecular data type, treatment group (Caloric Restriction or Ad Libitum) and follow-up visit (Baseline, 12 Month, or 24 Month) across different tissue types. For some individuals, samples were available at follow-up but not baseline (or vice versa), so baseline numbers for a tissue and treatment group combination will not always match sample sizes in Figure 2 Panel A. Figure created using images from Biorender.com.
Figure 3.
Figure 3.. SNP-based principal components scores for CALERIE participants.
The figure shows the top two SNP-based principal components (PCs) for CALERIE participants (n=217), colored by self-reported race/ethnicity. Dashed lines indicate three standard deviations from the mean for participants who self-reported race/ethnicity as White. The top-5 SNP-based principal-components explained 11.9% (PC1) 4.8% (PC2), 1.5% (PC3), 1.4% (PC4), and 1.3% (PC5) of the genetic variation among CALERIE participants.
Figure 4.
Figure 4.
Associations of DNA methylation measures of aging with chronological age and age-residualized DNA methylation measures of aging with each other. Panel A shows DNA methylation measures of aging (Y-axis) against chronological age (X-axis) for n=212 men and women at pre-intervention baseline. The dashed colored line on each facet is the line of identity (intercept=0, slope=1), indicating where predicted epigenetic age or pace of aging would equal chronological age. Correlations with chronological age are as follows: PC Horvath Clock r=0.84, PC Hannum Clock r=0.88, PC PhenoAge Clock r=0.85, PC GrimAge Clock r=0.92, DunedinPACE r=0.15. Panel B shows correlations between age-residualized DNA methylation measures of aging for n=212 men and women at pre-intervention baseline with each other. The dashed red line on each facet is the fitted regression slopes. Pearson correlations between DNA methylation measures of aging are shown on the upper diagonal facets, with the shade of the facet indicating the strength of the correlation.
Figure 5.
Figure 5.. Relative proportions of 12 white blood cell types estimated for all participants at baseline.
The figure shows the estimated relative proportions of 12 white blood cell types for all participants at baseline, prior to treatment (Bas=basophils, Bmem=memory B cells, Bnv=naïve B cells, CD4mem=memory CD4T cells, CD4nv=naïve CD4T cells, CD8mem=memory CD8T cells, CD8nv=naïve CD8T cells, Eos=Eosinophils, Mono=Monocytes, NK=Natural Killer cells, Treg=T regulatory cells, Neutrophils=Neutrophil cells). Individual points represent individual observations. Box and whisker plots showing median (horizontal line), 25th quartile (bottom of the box), 75th quartile (top of the box), and minimum and maximum values within 1.5 × IQR (interquartile range; top and bottom segments, respectively). Neutrophils are plotted on a separate scale.
Figure 6.
Figure 6.
Differences in adipose mRNA expression (A and C) and enriched biological processes (B and D) between CR and AL groups at the 12-month and 24-month timepoints. For Panels A and C, x-axis shows log2 fold-change differences between groups. The y-axis shows -log10 p-value. Blue points show genes with false-discovery rate q-values less than 0.05 were downregulated in CR participants. Red points show genes with false-discovery rate q-values less than 0.05 were upregulated in CR participants. Gray points show genes with q-values equal or greater than 0.05. Using a false-discovery cutoff of q=0.05, a total of 605 genes (from 19471 genes total) were differentially-expressed between CR and AL treatment groups at the 12-month timepoint (n=34, Panel A) and 734 genes were differentially-expressed between CR and AL treatment groups at the 24-month timepoint (n=18, Panel C). A dispersed but otherwise arbitrary selection of 31 differentially-expressed genes labeled by gene symbol are shown for the 12-month treatment effect. A dispersed but otherwise arbitrary selection of 23 differentially-expressed genes labeled by gene symbol are shown for the 24-month treatment effect. Panels B and D show the top-10 upregulated (red) and down-regulated (blue) biological pathways from Gene Ontology based on overlapping results from both fast GSEA and GAGE gene set enrichment. The full set of enriched pathways for 12-month and 24-month follow-ups are in Tables S1 and S2, respectively.

References

    1. Bales C. W. & Kraus W. E. Caloric Restriction: IMPLICATIONS FOR HUMAN CARDIOMETABOLIC HEALTH. Journal of Cardiopulmonary Rehabilitation and Prevention 33, 201 (2013). - PMC - PubMed
    1. Speakman J. R. & Mitchell S. E. Caloric restriction. Molecular Aspects of Medicine 32, 159–221 (2011). - PubMed
    1. Fontana L., Meyer T. E., Klein S. & Holloszy J. O. Long-term calorie restriction is highly effective in reducing the risk for atherosclerosis in humans. Proceedings of the National Academy of Sciences 101, 6659–6663 (2004). - PMC - PubMed
    1. Meyer T. E. et al. Long-Term Caloric Restriction Ameliorates the Decline in Diastolic Function in Humans. Journal of the American College of Cardiology 47, 398–402 (2006). - PubMed
    1. Heilbronn L. K. et al. Effect of 6-Month Calorie Restriction on Biomarkers of Longevity, Metabolic Adaptation, and Oxidative Stress in Overweight IndividualsA Randomized Controlled Trial. JAMA 295, 1539–1548 (2006). - PMC - PubMed

Publication types

LinkOut - more resources