[Preprint]. 2024 Aug 22:2024.08.22.609230.
doi: 10.1101/2024.08.22.609230.

Variant-to-function mapping of late-onset Alzheimer's disease GWAS signals in human microglial cell models implicates RTFDC1 at the CASS4 locus

Affiliations

Variant-to-function mapping of late-onset Alzheimer's disease GWAS signals in human microglial cell models implicates RTFDC1 at the CASS4 locus

Elizabeth A Burton et al. bioRxiv. .

Abstract

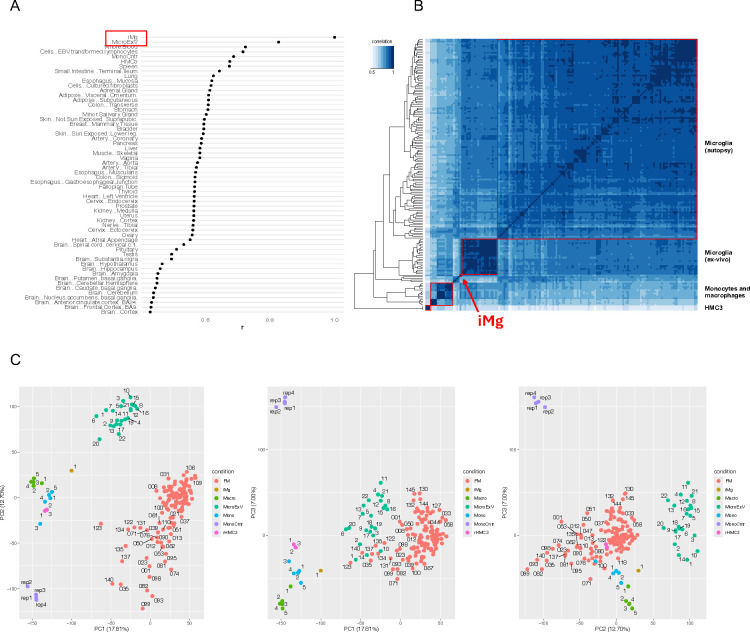
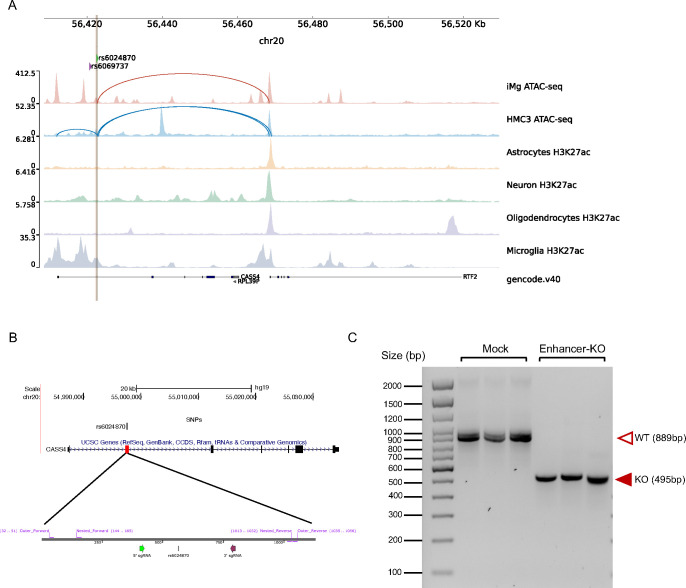
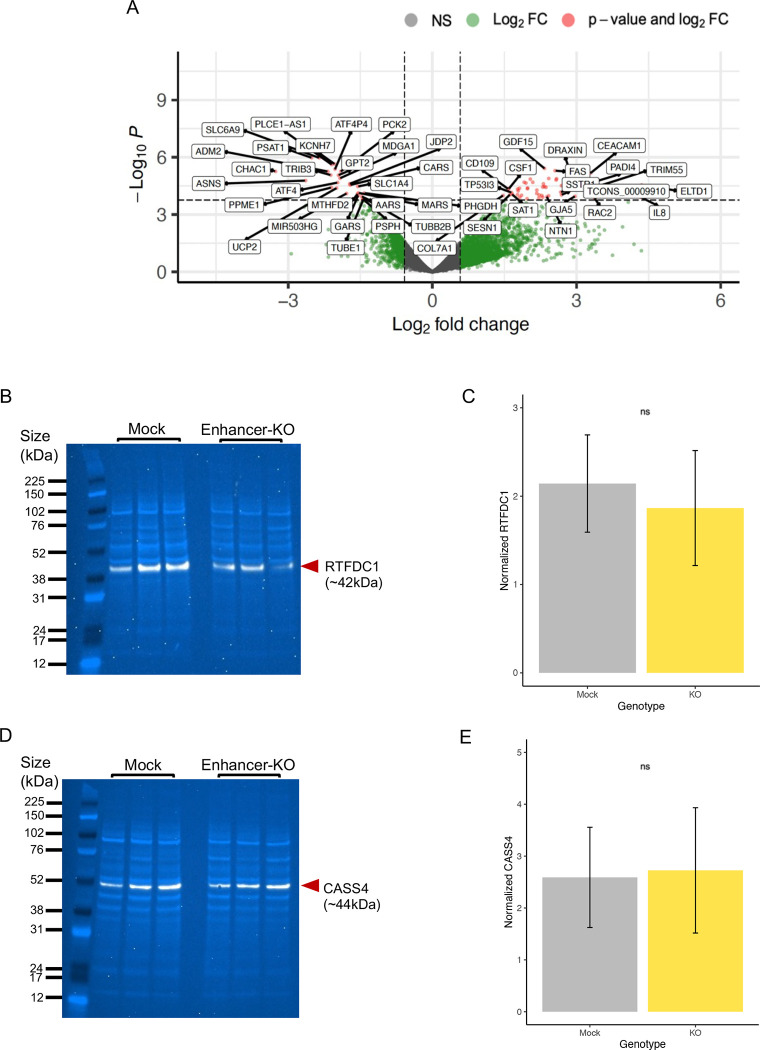
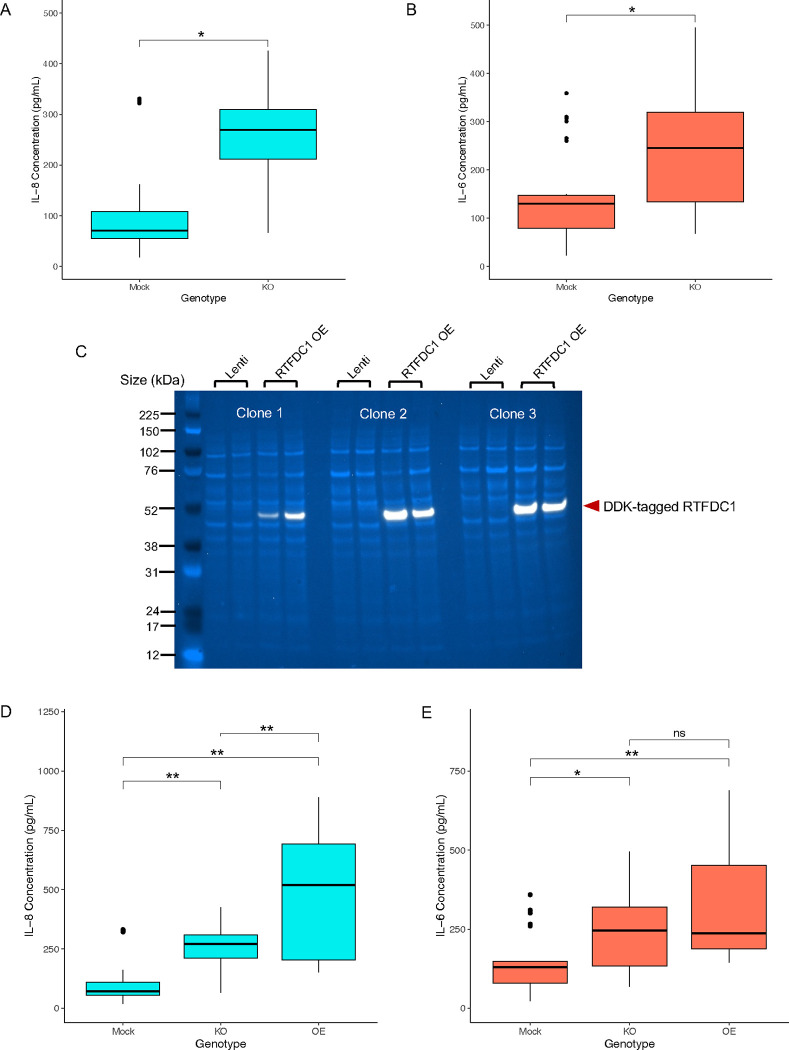
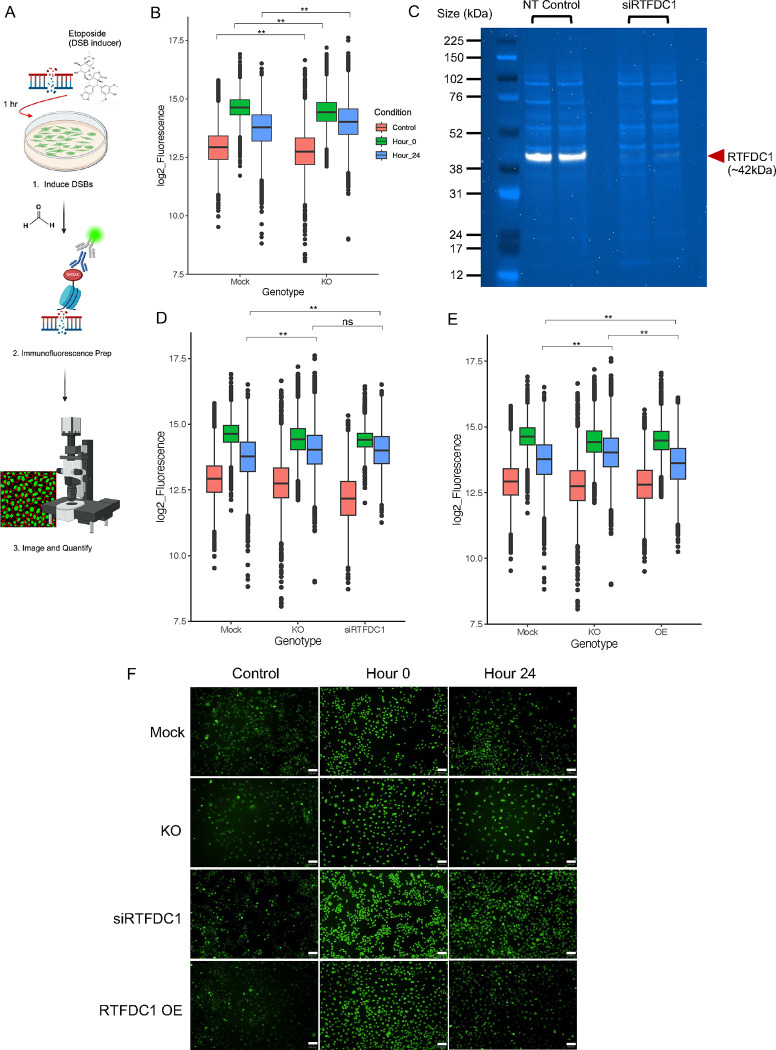
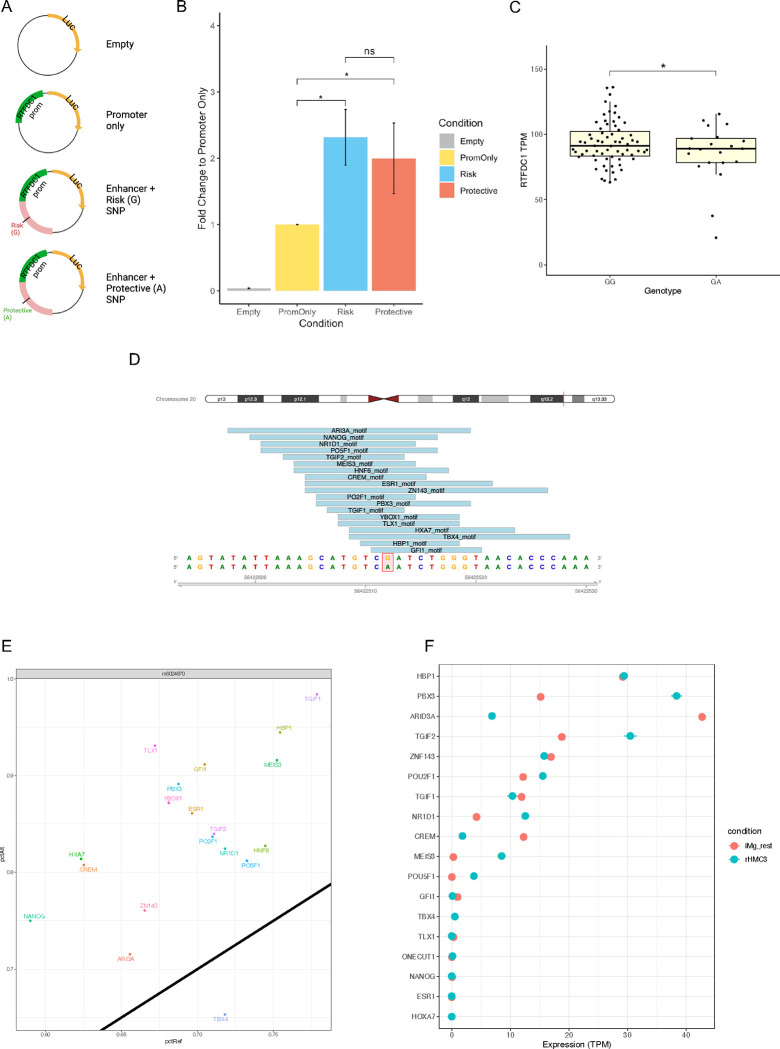
Late-onset Alzheimer's disease (LOAD) research has principally focused on neurons over the years due to their known role in the production of amyloid beta plaques and neurofibrillary tangles. In contrast, recent genomic studies of LOAD have implicated microglia as culprits of the prolonged inflammation exacerbating the neurodegeneration observed in patient brains. Indeed, recent LOAD genome-wide association studies (GWAS) have reported multiple loci near genes related to microglial function, including TREM2, ABI3, and CR1. However, GWAS alone cannot pinpoint underlying causal variants or effector genes at such loci, as most signals reside in non-coding regions of the genome and could presumably confer their influence frequently via long-range regulatory interactions. We elected to carry out a combination of ATAC-seq and high-resolution promoter-focused Capture-C in two human microglial cell models (iPSC-derived microglia and HMC3) in order to physically map interactions between LOAD GWAS-implicated candidate causal variants and their corresponding putative effector genes. Notably, we observed consistent evidence that rs6024870 at the GWAS CASS4 locus contacted the promoter of nearby gene, RTFDC1. We subsequently observed a directionallly consistent decrease in RTFDC1 expression with the the protective minor A allele of rs6024870 via both luciferase assays in HMC3 cells and expression studies in primary human microglia. Through CRISPR-Cas9-mediated deletion of the putative regulatory region harboring rs6024870 in HMC3 cells, we observed increased pro-inflammatory cytokine secretion and decreased DNA double strand break repair related, at least in part, to RTFDC1 expression levels. Our variant-to-function approach therefore reveals that the rs6024870-harboring regulatory element at the LOAD 'CASS4' GWAS locus influences both microglial inflammatory capacity and DNA damage resolution, along with cumulative evidence implicating RTFDC1 as a novel candidate effector gene.


Conflict of interest statement

DECLARATION OF INTERESTS The authors declare no competing interests.

Figures

Figure 1:
Figure 1:. iPSC-derived microglia (iMg) and HMC3 transcriptomes from this study show high correlation with established in vivo human microglia datasets.
(A) Comparison of iMg expression profile to tissues in the GTEx database. R scores are the Spearman correlation coefficient of 16,651 genes expressed in both datasets. Median expression values were downloaded from GTEx (v7); MicroExV from Nott et al.; Mono Cntr from Pahl et al.; iMg and HMC3 are from this study. (B) Heatmap of the correlation of gene expression between microglia-related cell types clustered by distance. Samples shown are: microglia from autopsies of 127 individuals from the FreshMicro study, ex-vivo microglia from biopsies of 22 individuals, monocytes and macrophages,, monocytes, and iMg and HMC3 from this study. (C) Principal component analysis of the same datasets as in B.
Figure 2:
Figure 2:. CRISPR-Cas9-mediated deletion of rs6024870-harboring regulatory element in HMC3 Cells.
(A) Chromatin accessibility peaks from ATAC-seq analysis human microglial cells models iMg cells (red) and HMC3 (blue) at the LOAD CASS4 GWAS locus. Loops represent physical contacts between regions of DNA as assayed by promoter-focused Capture-C in the respective cell types. Below ATAC-seq peaks, H3K27ac ChIP-seq peaks from Nott et al. for astrocytes (yellow), neurons (green), oligodendrocytes (purple), and microglia (gray). Green arrow and brown line represent the position of rs6024870, while the purple arrow represents the position of the sentinel variant rs6069737. (B) Schematic of the CRISPR-Cas9 rs6024870-enhancer harboring regulatory element (enhancer-KO) deletion. Top: UCSC genome browser view of CASS4 with the deletion region highlighted by the red box. Bottom: SnapGene schematic of sgRNAs (5’ sgRNA: purple arrow; 3’ sgRNA: green arrow) and genotyping PCR primers utilized to confirm successful deletion. (C) DNA gel confirming the genotype of 3 mock clones and 3 enhancer-KO clones. Each lane represents a PCR amplification of the deletion region from genomic DNA from an individual clone.
Figure 3:
Figure 3:. Molecular characterization of rs6024870-enhancer KO HMC3 clones.
(A) Volcano plot showing differentially expressed genes between 3 homozygous KO and 2 control mock clones. (B) Immunoblot for RTFDC1 in mock and enhancer-KO clones. White band: RTFDC1. Light blue bands: whole protein stain. (C) Quantification of RTFDC1 immunoblots in mock and enhancer-KO clones. For each genotype, N=6 (3 clones, 2 protein samples per clone). Bars represent sample mean, error bars represet +/−1 standard deviation of the mean. P=0.44 by Student’s 2-sample T-test. (D) Same as B, but for CASS4. (E) Same as C, but for CASS4. P=0.83 by Student’s 2-sample T-test.
Figure 4:
Figure 4:. rs6024870-enhancer-KO primes microglia to a pro-inflammatory state.
(A) Quantification of secreted IL-8 in mock and enhancer-KO cell media. N=27 for each genotype (9 biological replicates per clone, 3 clones per genotype). Boxes represent interquartile range (IQR) with the central bar representing the median (50th percentile), whiskers represent data 1.5 IQR above the 75th percentile or below the 25th percentile, dots represent outliers. * P<0.01. (B) Same as A, but for secreted IL-6. (C) Immunoblot for DDK-tagged lentivirally overexpressed RTFDC1 in all 3 enhancer-KO clones. Lenti: mock transduced. RTFDC1 OE: transduced with DDK-tagged RTFDC1 ORF. White band: DDK-tagged RTFDC1. Light blue bands: whole protein stain. (D) Quantification of secreted IL-8 in mock, enhancer-KO, and RTFDC1 overexpression enhancer-KO clones. N=18 for RTFDC1 overexpression genotype (6 biological replicates per clone, 3 clones per genotype). ** P<0.001. (E) Same as D, but for secreted IL-6. * P<0.01, ** P<0.001.
Figure 5:
Figure 5:. Reduction of RTFDC1 expression dysregulates the DNA damage repair response.
(A) Visual schematic of γH2AX staining experimental design. (B) Quantification of γH2AX fluorescence in mock and enhancer-KO cells across 3 time periods: no etoposide control (red), 0 hours after etoposide removal (green), and 24 hours after etoposide removal (blue). Boxes represent interquartile range (IQR) with the central bar representing the median (50th percentile), whiskers represent data 1.5 IQR above the 75th percentile or below the 25th percentile, dots represent outliers. For each genotype, N=12 wells (4 wells per clone, 3 clones per genotype). ** P<2.2×10⁻¹⁶ by two-way ANOVA (genotype by condition) with Tukey’s HSD. (C) Immunoblot for RTFDC1 in WT HMC3 cells transduced with either non-targeting control siRNA (NT Control) or RTFDC1 siRNA pool (siRTFDC1). Each lane represents an individual transfection. White band: RTFDC1. Light blue bands: whole protein stain. (D) Quantification of γH2AX fluorescence in mock, enhancer-KO, and siRNA RTFDC1-depleted cells (siRTFDC1) across same time periods as B. For siRNA RTFDC1-depleted cells, N=4 wells (2 wells per siRNA transfection, 2 transfections total). ** P<2.2×10⁻¹⁶ by two-way ANOVA (genotype by condition) with Tukey’s HSD. (E) Quantification of γH2AX fluorescence in mock, enhancer-KO, and RTFDC1-overexpression cells (OE) across same time periods as B. For overexpression cells, N=12 wells (4 wells per clone, 3 clones per genotype). ** P<2.2×10⁻¹⁶ by two-way ANOVA with Tukey’s HSD. (F) Representative images of γH2AX fluorescence (green) across all conditions and timepoints. All images 10X magnification. White bars represents 100μm.
Figure 6:
Figure 6:. rs6024870 influences RTFDC1 expression in microglial cells.
(A) Schematic of plasmid design used for luciferase experiments. (B) Luciferase assay luminescence fold change of rs6024870-harboring regulatory element in HMC3 cells. N=7 biological replicates per condition. (C) Expression analysis of RTFDC1 TPMs from freshly harvested microglial cells from the FreshMicro study. * P=0.0385 by Student’s 1-tailed T-test. (D) Transcription factor motifs overlapping rs6024870. (E) Transcription factor motif affinity analysis for rs6024870 genotype with MotifBreakR. Black diagonal line represents no change in predicted binding affinity in the presence of the protective (A) allele. Any motifs above the diagonal are predicted to have increased binding affinity in the presence of the protective allele, while motifs below the diagonal are predicted to have weakened binding affinity in the presence of the protective allele. (F) Expression of transcription factors in iMg (red) and HMC3 (blue).

References

    1. Alzheimer’s Disease Facts and Figures. (2023).
    1. Reitz C., Brayne C. & Mayeux R. Epidemiology of Alzheimer disease. Nat Rev Neurol 7, 137–152 (2011). 10.1038/nrneurol.2011.2 - DOI - PMC - PubMed
    1. Gatz M. et al. Role of genes and environments for explaining Alzheimer disease. Arch Gen Psychiatry 63, 168–174 (2006). 10.1001/archpsyc.63.2.168 - DOI - PubMed
    1. Bellenguez C. et al. New insights into the genetic etiology of Alzheimer’s disease and related dementias. Nat Genet 54, 412–436 (2022). 10.1038/s41588-022-01024-z - DOI - PMC - PubMed
    1. Jansen I. E. et al. Genome-wide meta-analysis identifies new loci and functional pathways influencing Alzheimer’s disease risk. Nat Genet 51, 404–413 (2019). 10.1038/s41588-018-0311-9 - DOI - PMC - PubMed

Publication types

LinkOut - more resources