[Preprint]. 2024 Aug 22:2024.08.22.609117.
doi: 10.1101/2024.08.22.609117.

Dlk1 is a novel adrenocortical stem/progenitor cell marker that predicts malignancy in adrenocortical carcinoma

Affiliations

Dlk1 is a novel adrenocortical stem/progenitor cell marker that predicts malignancy in adrenocortical carcinoma

Katia Mariniello et al. bioRxiv. .

Update in

  • Dlk1 is a novel adrenocortical stem/progenitor cell marker that predicts malignancy in adrenocortical carcinoma.
    Mariniello K, Pittaway JFH, Altieri B, Borges KS, Hadjidemetriou I, Ribeiro C, Ruiz-Babot G, Tourigny DS, Lim JA, Foster J, Cleaver J, Sosabowski J, Rahman N, Doroszko M, Hantel C, Sigala S, Abate A, Tamburello M, Kiseljak-Vassiliades K, Wierman M, Hall C, Parvanta L, Abdel-Aziz TE, Chung TT, Marco AD, Palazzo F, Gomez-Sanchez CE, Taylor DR, Rayner O, Ronchi CL, Gaston-Massuet C, Sbiera S, Drake WM, Rognoni E, Kroiss M, Breault DT, Fassnacht M, Guasti L. Mariniello K, et al. Cancer Commun (Lond). 2025 Jun;45(6):663-668. doi: 10.1002/cac2.70012. Epub 2025 Mar 4. Cancer Commun (Lond). 2025. PMID: 40035383 Free PMC article. No abstract available.

Abstract

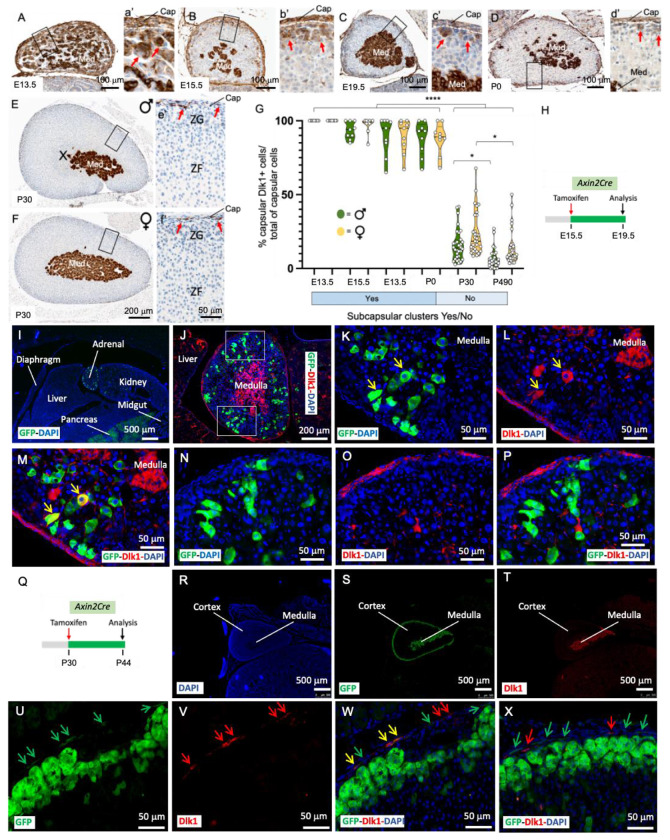
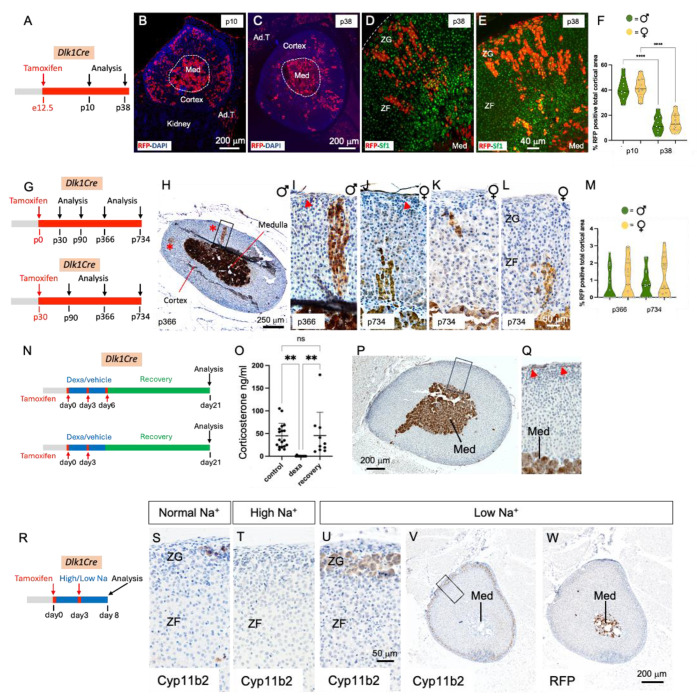
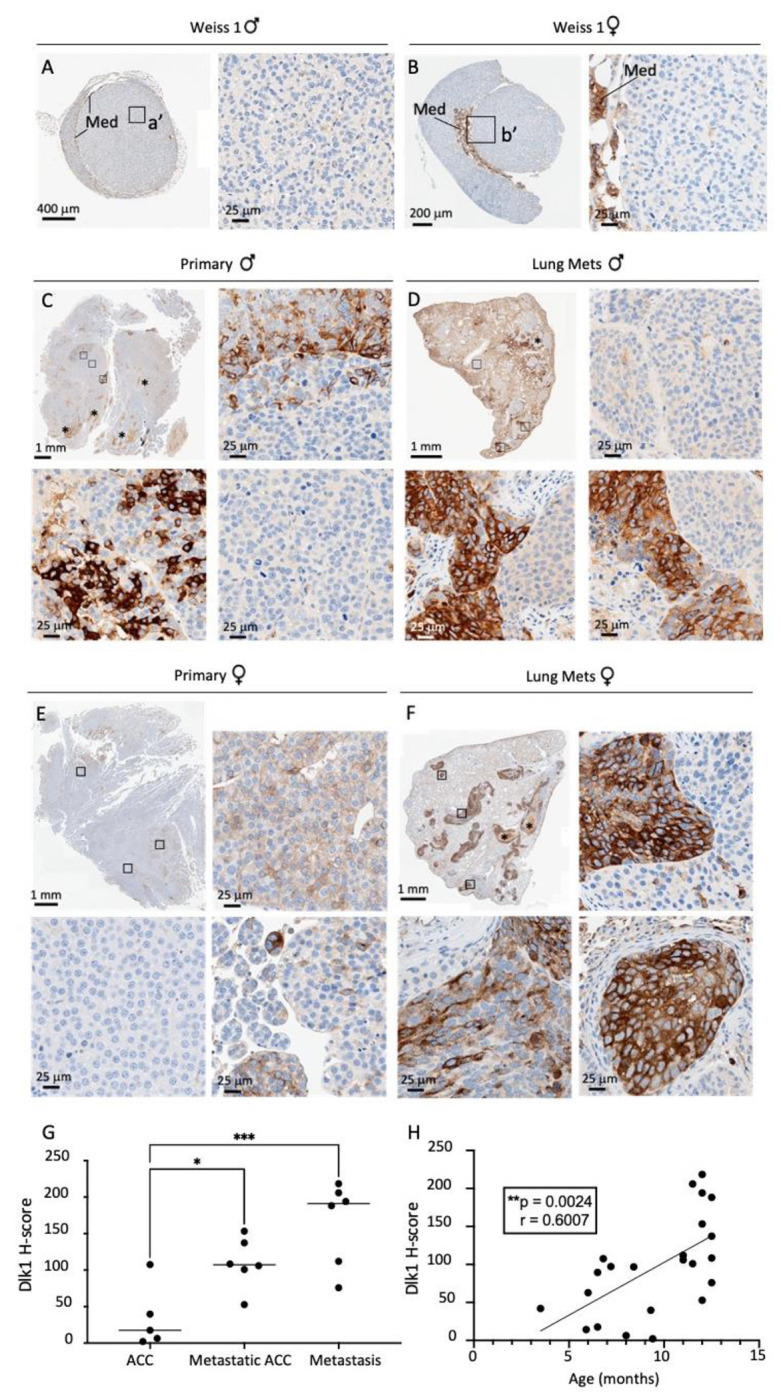
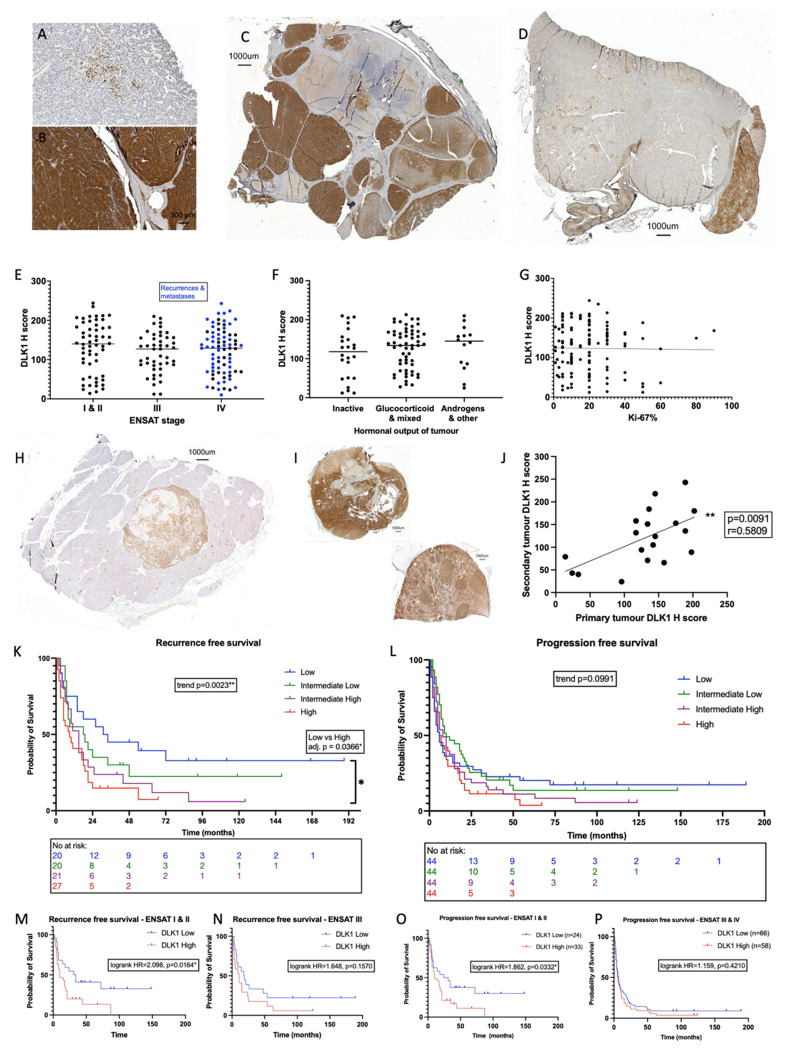
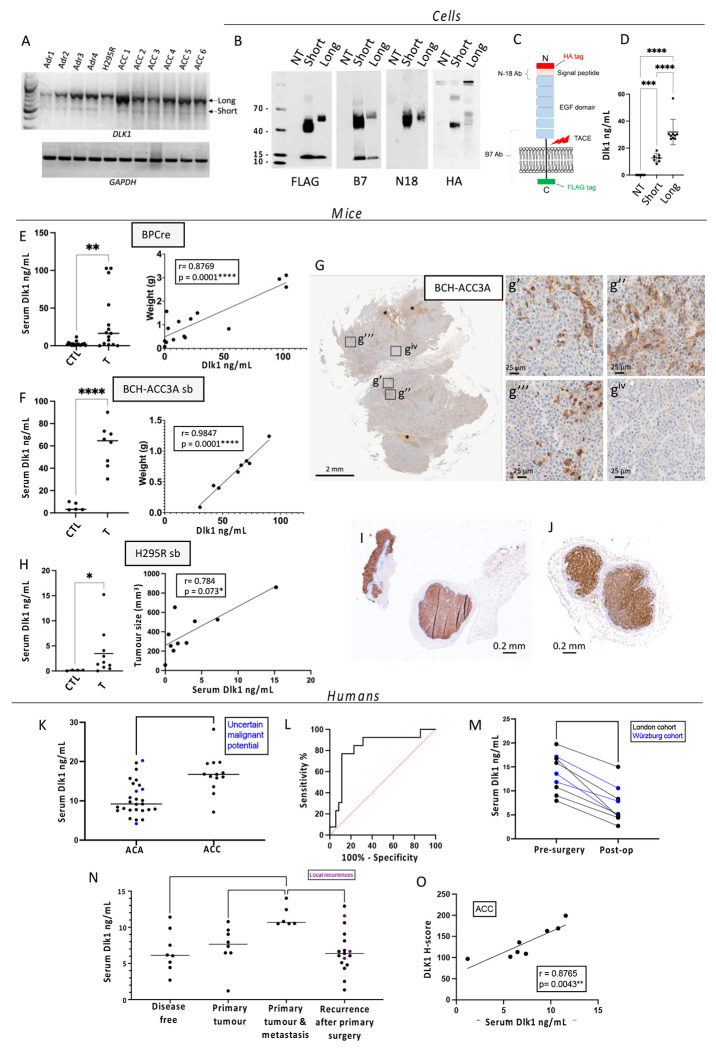
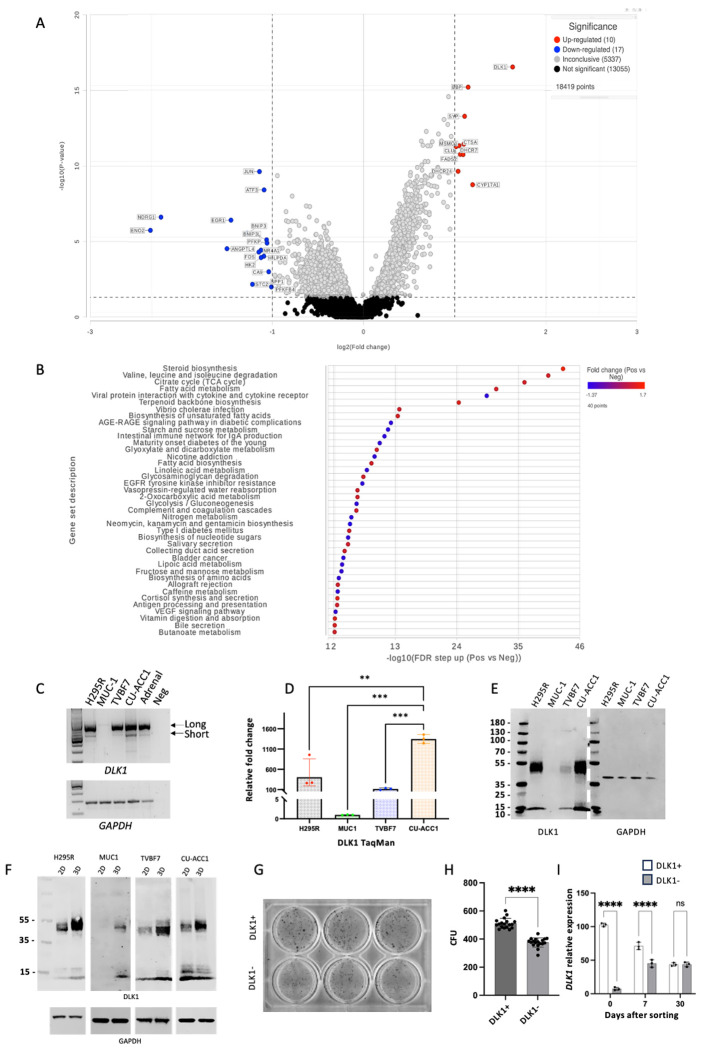
Disruption of processes involved in tissue development and homeostatic self-renewal is increasingly implicated in cancer initiation, progression, and recurrence. The adrenal cortex is a dynamic tissue that undergoes life-long turnover. Here, using genetic fate mapping and murine adrenocortical carcinoma (ACC) models, we have identified a population of adrenocortical stem cells that express delta-like non-canonical Notch ligand 1 (DLK1). These cells are active during development, near dormant postnatally but are re-expressed in ACC. In a study of over 200 human ACC samples, we have shown DLK1 expression is ubiquitous and is an independent prognostic marker of recurrence-free survival. Paradoxically, despite its progenitor role, spatial transcriptomic analysis has identified DLK1 expressing cell populations to have increased steroidogenic potential in human ACC, a finding also observed in four human and one murine ACC cell lines. Finally, the cleavable DLK1 ectodomain is measurable in patients' serum and can discriminate between ACC and other adrenal pathologies with high sensitivity and specificity to aid in diagnosis and follow-up of ACC patients. These data demonstrate a prognostic role for DLK1 in ACC, detail its hierarchical expression in homeostasis and oncogenic transformation and propose a role for its use as a biomarker in this malignancy.


Conflict of interest statement

Declaration of interests All authors declare no conflicts of interest.

Figures

Figure 1.
Figure 1.. Embryonic and postnatal expression of Dlk1 in the mouse adrenal.
A-d’) Immunohistochemical detection of Dlk1 in E13.5 (A and a’), E15.5 (B and b’), E19.5 (C and c’) adrenals showing expression in the capsule, cortex, and medulla. Subcapsular clusters of Dlk1+ cells (red arrows) decreased during development and were sparse at P0 (D and d’). E-f’) Immunohistochemical detection of Dlk1 in 4-weeks old female (E and e’) and male (F and f’) adrenals. G) Percentage of Dlk1+ cells in the capsule showed a dramatic reduction after birth, with a small non-significant trend of higher number of Dlk1+ cells in female mice. Cap, capsule; ZG, Zona Glomerulosa; ZF, Zona Fasciculata; Med, medulla; X-zone H) Schematic of tamoxifen treatment in Axin-2Cre mice during development. I-P) Localization of Axin-2+ cells and Axin-2 early progeny (4 days chase, green) relative to Dlk1 expression (red). Nuclei (DAPI) are in blue. Note the presence of occasional cortical GFP+/Dlk1+ cells (yellow arrows in K-M) and absence of GFP staining in the capsule, that instead is strongly Dlk1+. GFP+/Dlk1+ cells were TH and Sf1+ (not shown). Q) Schematic of tamoxifen treatment in postnatal Axin-2Cre mice. R-X) Localization of Axin2+ cells and Axin2 early progeny (14 days chase, green) relative to Dlk1 expression (red). Green arrows indicate capsular GFP+/Dlk1 cells, yellow arrows indicate GFP+/Dlk1+ cells and red arrows Dlk1+/GFP cells. *p<0.05, ****p<0.0001.
Figure 2.
Figure 2.. Dlk1 cells are adrenocortical progenitors during development, near-dormant postnatally and inactive upon adrenocortical remodeling.
A) Schematic of tamoxifen induction of Dlk1Cre dams. B and C) Immunofluorescence detection of RFP+ cells at P10 (B) and P38 (C). Dlk1 progeny are positive for Sf1 expression in both males (D) and females (E). F) Time-course percentage of RFP+ cells in the cortex. G) Schematics of tamoxifen induction of Dlk1Cre in P0 and P30 mice. H-M) Examples of immunohistochemical detection of RFP+ cells after a year chase in male (H-J) and after a two-years chase in female (K and L) mice. Red asterisks in the panoramic panel H point to the occasional clusters and columns of RFP+ cells. These were TH. Red arrows indicate capsular RFP+ cells. M) Time-course percentage of RFP+ cells in the cortex. N) Schematics of tamoxifen induction and dexamethasone treatment in P30 mice. O) Corticosterone levels measured before dexamethasone treatment, after dexamethasone treatment, and after ZF regeneration. P and Q) Immunohistochemical detection of RFP+ cells after ZF regeneration in Dlk1Cre. R) Schematic of tamoxifen induction of Dlk1Cre mice. S-V) Immunohistochemical detection of Cyp11B2 expression in mice fed with a normal (S), high sodium (Na+) (T), and low sodium (U, V) diet. W) Immunohistochemical detection of RFP+ cells after low sodium diet. The strong RFP staining in the medulla in B, C, H-L, P, Q, W suggests efficient recombination. Ad. T, adipose tissue; Med, medulla; ZG, Zona Glomerulosa; ZF, Zona Fasciculata. *p<0.05, **p<0.01, ***p<0.001, ****p<0.0001.
Figure 3.
Figure 3.. Dlk1 is re-expressed in a murine model of ACC and exhibits intratumoral heterogeneity.
A-F) Immunohistochemical detection of Dlk1 expression in ACC from BPCre male (A) and female (B) mice with low Weiss Score, in metastatic ACC (C, primary male; E, primary female) and in lungs metastasis (Mets, D, males; F, females). Note the higher expression of Dlk1 in metastatic ACC and lungs metastasis. Dlk1 expression is mostly clonal with different foci that express varying levels of Dlk1 or be negative for Dlk1 expression. G) Dlk1 expression increases in a stepwise manner from non-metastatic primary ACC to metastatic primary ACC and metastatic lesions. Horizontal lines represent group means. H) Dlk1 expression positively correlates with age, which in turn increases with disease malignancy. Each dot represents an individual tumor. *p<0.05, **p<0.01, ***p<0.001.
Figure 4.
Figure 4.. DLK1 expression is ubiquitous in human ACC, consistent in metastatic disease and increases risk of disease recurrence and progression.
A-G) The range of expression across the cohort can be seen with few positive cells in the tumor parenchyma (A) dense, intense staining throughout (B). C and D: panoramic sections illustrating heterogenous DLK1 expression in individual tumor samples. DLK1 expression is unrelated to ENSAT stage (E), hormonal output (F) or Ki-67% (G). H-J) DLK1 expression shown in a liver metastasis (H). DLK1 expression is positively correlated in primary and secondary disease in the same patients (I and J). Each dot represents a secondary tumor. K-L): Kaplan-Meier curves showing increased disease recurrence (K) and a trend towards increased disease progression (L) with higher DLK1 expression levels. This effect is more pronounced in ENSAT stage I & II disease (M, O) than in ENSAT stage III & IV disease (N, P). *p<0.05, **p<0.01.
Figure 5.
Figure 5.. Serum DLK1 is novel biomarker in ACC that predicts malignancy.
A) RT-PCR analysis for the expression of the full-length (Long) DLK1, short DLK1 and GAPDH in normal human adrenals (Adr), H295R cells and six human ACCs. B) Western Blotting analysis of the two DLK1 isoforms (HA and FLAG tagged) transfected into HEK293 cells, using anti-FLAG (tag at the C-terminus), anti B7 (targeting aa 266-383), anti N18 (targeting the N-terminus region) and HA (tag at the N-terminus) antibodies. NT, non-transfected HEK293 cells. The lower band with an apparent molecular weight of 12 kDa, recognized only by the anti-FLAG and anti B7 antibodies, represents the membrane tethered DLK1 post cleavage mediated by Tumor necrosis Alpha Converting Enzyme (TACE). C) Schematic of DLK1 structure indicating regions targeted by antibodies. D) Levels of human DLK1 ectodomain in the medium. E) Levels of mouse Dlk1 ectodomain in the serum of age-matched controls (CTL) and BPCre mice (T) (left panel), and correlation with tumor weight (right panel). F) Levels of mouse Dlk1 ectodomain in the serum of aged-matched (CTL) and mice injected subcutaneously with BCH-ACC3A cells (T) (left panel), and correlation with tumor weight (right panel). G) Immunohistochemical detection of Dlk1 in tumors of mice injected subcutaneously with BCH-ACC3A cells, showing different levels of Dlk1 expression. H) Human DLK1 is not detected in serum samples from non-injected Nu-Nu mice using human-specific DLK1 ELISA (CTL), while a significant signal is obtained from sera from mice injected with H295R cells (T) (left panel). The correlation with tumor size is reported on the right panel. I-J) Examples of Dlk1 expression in tumors retrieved from Nu-Nu mice injected with H295R. K-L) London cohort. Pre-operative serum DLK1 levels are higher in those with ACC than ACA (K) and can predict malignancy as seen on ROC curve (L). M) In all patients studied, a significant fall in serum DLK1 levels was detected after resection of the primary ACC. N-O) Würzburg cohort. N) Serum DLK1 levels are higher in those presenting with ENSAT stage IV disease than other groups. Each dot is a blood sample relating to an individual patient. Purple dots represent local recurrences and horizontal lines represent group mean values. O) Serum DLK1 levels positively correlate with tissue expression (H-score) in the same patients with ACC. *p<0.05, **p<0.01, ***p<0.001, ****p<0.0001.
Figure 6.
Figure 6.. DLK1+ cells are endowed with both enhanced steroidogenesis and clonogenicity.
A) Volcano plot detailing the genes with altered expression between DLK1+ and DLK1 areas of ACC tumors (adj. p <0.01, fold change >/< 2). B) Geneset ANOVA showing the most differentially regulated pathways in DLK1+ and DLK1 tumor areas. The most upregulated pathway was of steroid C) PCR analysis of DLK1 isoforms’ expression in H295R, MUC-1, TVBF7, CU-ACC1 and human adrenal. D) TaqMan analysis of DLK1 mRNA expression in the indicated ACC lines. E) Western blotting analysis of DLK1 protein expression in the indicated ACC lines. F) Western blotting analysis of DLK1 protein expression in the indicated ACC lines grown in 2D and 3D (spheroids). G-I) Example of colony forming units (CFU) in DLK1+ and DLK1 FAC-sorted H295R cells (G) and analysis of CFU (H). I) TaqMan analysis of DLK1 mRNA expression in DLK1+ and DLK1 FAC-sorted H295R cells after sorting, and after 7 and 30 days. **p<0.01, ***p<0.001, ****p<0.0001.

References

References for main text

    1. Kerkhofs TM, Verhoeven RH, Van der Zwan JM, Dieleman J, Kerstens MN, Links TP, et al. Adrenocortical carcinoma: a population-based study on incidence and survival in the Netherlands since 1993. Eur J Cancer. 2013;49(11):2579–86. - PubMed
    1. Kebebew E, Reiff E, Duh QY, Clark OH, McMillan A. Extent of disease at presentation and outcome for adrenocortical carcinoma: have we made progress? World J Surg. 2006;30(5):872–8. - PubMed
    1. Fassnacht M, Johanssen S, Quinkler M, Bucsky P, Willenberg HS, Beuschlein F, et al. Limited prognostic value of the 2004 International Union Against Cancer staging classification for adrenocortical carcinoma: proposal for a Revised TNM Classification. Cancer. 2009;115(2):243–50. - PubMed
    1. Else T, Kim AC, Sabolch A, Raymond VM, Kandathil A, Caoili EM, et al. Adrenocortical carcinoma. Endocr Rev. 2014;35(2):282–326. - PMC - PubMed
    1. Fassnacht M, Dekkers OM, Else T, Baudin E, Berruti A, de Krijger R, et al. European Society of Endocrinology Clinical Practice Guidelines on the management of adrenocortical carcinoma in adults, in collaboration with the European Network for the Study of Adrenal Tumors. Eur J Endocrinol. 2018;179(4):G1–G46. - PubMed

References for Methods

    1. Borges KS, Pignatti E, Leng S, Kariyawasam D, Ruiz-Babot G, Ramalho FS, et al. Wnt/beta-catenin activation cooperates with loss of p53 to cause adrenocortical carcinoma in mice. Oncogene. 2020;39(30):5282–91. - PMC - PubMed
    1. Mohan DR, Borges KS, Finco I, LaPensee CR, Rege J, Solon AL, et al. beta-Catenin-Driven Differentiation Is a Tissue-Specific Epigenetic Vulnerability in Adrenal Cancer. Cancer Res. 2023;83(13):2123–41. - PMC - PubMed
    1. Bielinska M, Parviainen H, Porter-Tinge SB, Kiiveri S, Genova E, Rahman N, et al. Mouse strain susceptibility to gonadectomy-induced adrenocortical tumor formation correlates with the expression of GATA-4 and luteinizing hormone receptor. Endocrinology. 2003; 144(9):4123–33. - PubMed
    1. Kananen K, Markkula M, Mikola M, Rainio EM, McNeilly A, Huhtaniemi I. Gonadectomy permits adrenocortical tumorigenesis in mice transgenic for the mouse inhibin alpha-subunit promoter/simian virus 40 T-antigen fusion gene: evidence for negative autoregulation of the inhibin alpha-subunit gene. Mol Endocrinol. 1996;10(12):1667–77. - PubMed
    1. Bankhead P, Loughrey MB, Fernandez JA, Dombrowski Y, McArt DG, Dunne PD, et al. QuPath: Open source software for digital pathology image analysis. Sci Rep. 2017;7(1):16878. - PMC - PubMed

Publication types

LinkOut - more resources