[Preprint]. 2025 Mar 3:2024.08.17.608386.
doi: 10.1101/2024.08.17.608386.

Cell states and neighborhoods in distinct clinical stages of primary and metastatic esophageal adenocarcinoma

Affiliations

Cell states and neighborhoods in distinct clinical stages of primary and metastatic esophageal adenocarcinoma

Josephine Yates et al. bioRxiv. .

Update in

Abstract

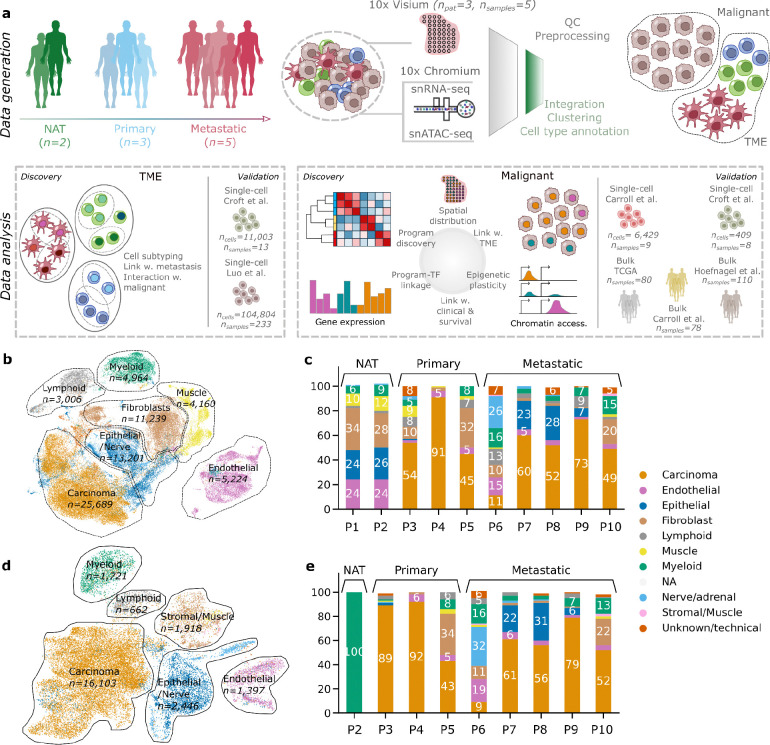
Esophageal adenocarcinoma (EAC) is a highly lethal cancer of the upper gastrointestinal tract with rising incidence in western populations. To decipher EAC disease progression and therapeutic response, we performed multiomic analyses of a cohort of primary and metastatic EAC tumors, incorporating single-nuclei transcriptomic and chromatin accessibility sequencing, along with spatial profiling. We identified tumor microenvironmental features previously described to associate with therapy response. We identified five malignant cell programs, including undifferentiated, intermediate, differentiated, epithelial-to-mesenchymal transition, and cycling programs, which were associated with differential epigenetic plasticity and clinical outcomes, and for which we inferred candidate transcription factor regulons. Furthermore, we revealed diverse spatial localizations of malignant cells expressing their associated transcriptional programs and predicted their significant interactions with microenvironmental cell types. We validated our findings in three external single-cell RNA-seq and three bulk RNA-seq studies. Altogether, our findings advance the understanding of EAC heterogeneity, disease progression, and therapeutic response.


Conflict of interest statement

Declarations of interest E.M.V.: Advisory/Consulting: Enara Bio, Manifold Bio, Monte Rosa, Novartis Institute for Biomedical Research, Serinus Bio, TracerDx Research support: Novartis, BMS, Sanofi, NextPoint Equity: Tango Therapeutics, Genome Medical, Genomic Life, Enara Bio, Manifold Bio, Microsoft, Monte Rosa, Riva Therapeutics, Serinus Bio, Syapse, TracerDx Travel reimbursement: None Patents: Institutional patents filed on chromatin mutations and immunotherapy response, and methods for clinical interpretation; intermittent legal consulting on patents for Foaley & Hoag Editorial Boards: Science Advances A.J.A. has consulted for Anji Pharmaceuticals, Affini-T Therapeutics, Arrakis Therapeutics, AstraZeneca, Boehringer Ingelheim, Kestrel Therapeutics, Merck & Co., Inc., Mirati Therapeutics, Nimbus Therapeutics, Oncorus, Inc., Plexium, Quanta Therapeutics, Revolution Medicines, Reactive Biosciences, Riva Therapeutics, Servier Pharmaceuticals, Syros Pharmaceuticals, T-knife Therapeutics, Third Rock Ventures, and Ventus Therapeutics. A.J.A. holds equity in Riva Therapeutics and Kestrel Therapeutics. A.J.A. has research funding from Amgen, AstraZeneca, Boehringer Ingelheim, Bristol Myers Squibb, Deerfield, Inc., Eli Lilly, Mirati Therapeutics, Nimbus Therapeutics, Novartis, Novo Ventures, Revolution Medicines, and Syros Pharmaceuticals.

Figures

Fig 1:
Fig 1:. EAC primary and metastatic samples show a diverse landscape of TME and malignant cells in transcriptomic and epigenetic data.
a, Schematic representation of the study workflow. Biopsies from 10 patients in our discovery cohort, including normal adjacent tissue (NAT), primary tissue, and metastatic samples, were subjected to single-nuclei RNA and ATAC sequencing using 10X Chromium technology. For a subset of these patients, matched primary and metastatic samples were sequenced with 10X Visium spatial transcriptomics (ST) technology. For single-nuclei data, cells were annotated by cell type and categorized into malignant and TME components. TME subtypes were linked to metastasis, with validation against an external pan-cancer fibroblast atlas. The malignant cell components underwent analysis using consensus non-negative matrix factorization (cNMF) to uncover malignant programs, which were further characterized for transcriptional and epigenetic heterogeneity at a single-cell and spatial level and candidate master transcription factors. External validation was performed in two single-cell validation cohorts,, and associations with clinical and molecular characteristics, as well as survival, were assessed in three bulk validation cohorts,,. b, Uniform Manifold Approximation and Projection (UMAP) representation of the full cohort in Harmony-corrected integrated transcriptomic data, with major cell type compartments labeled and cell counts indicated. c, Proportion of major cell types in each sample based on transcriptomic data, with percentages for compartments representing over 5% of the total sample composition. d, UMAP representation of the full cohort in Harmony-corrected integrated ATAC data, with cell type annotations transferred from the RNA annotations. “NA” denotes cells without paired associated RNA information. e, Proportion of major cell types in each sample based on ATAC data, with percentages for compartments representing over 5% of the total sample composition.
Fig 2:
Fig 2:. The EAC TME contains several pro- and anti-inflammatory populations of macrophages and RUNX1/RUNX2/PRRX1/BNC2-regulated inflammatory cancer-associated fibroblasts enriched in metastatic samples.
a, Uniform Manifold Approximation and Projection (UMAP) representation of the myeloid compartment in Harmony-corrected integrated transcriptomic data, with annotated subtypes indicated. b, Proportion of myeloid subtypes per patient. c, Distribution of Milo fold-change scores between normal-adjacent and tumor samples for myeloid cells; Milo scores measure differential abundances of specific cell subtypes by assigning cells to overlapping neighborhoods in a k-nearest neighbor graph. d, Marker genes of annotated myeloid subtypes, with cells grouped by subtype and expression information provided. e, UMAP representation of the fibroblast compartment in Harmony-corrected integrated transcriptomic data, with annotated subtypes indicated. f, Proportion of fibroblast subtypes per patient. g, Distribution of Milo fold-change scores between metastatic and primary tumor samples for fibroblast subtypes, with labeling and exclusion criteria similar to (c). h, Marker genes of annotated fibroblast subtypes, with cells grouped by subtype and expression information provided. i, Distribution of the inflammatory cancer-associated fibroblast (CAF) score in the stromal compartment of the Carroll et al. cohort, stratified by response to immune checkpoint inhibitor (ICI) therapy: clinical benefit (CB) and no clinical benefit (NCB). The inflammatory CAF program is scored on the entire cohort. Paired measurements of patients were made before treatment (PreTx) and after a 4-week ICI treatment window (ICI-4W). The distribution of the inflammatory CAF score is compared among the CB and NCB groups across PreTx and ICI-4W time points. Significance testing is conducted using a Mann-Whitney test to assess differences between the CB and NCB groups. j-l, Results for SCENIC+-derived transcription factor (TF) candidates for inflammatory fibroblasts, with cells grouped by subtype and Z-scores of TF expression (j), eRegulon gene-based expression (k), and eRegulon region-based expression (l) shown. m, TF gene expression correlation with inflammatory CAF score in the external pan-cancer fibroblast validation cohort of Luo et al. , with candidate TFs identified with the SCENIC+ analysis highlighted. n, Correlation of all available TFs’ gene expression and SCENIC-estimated gene-based eRegulon score with the inflammatory CAF score in the pan-cancer fibroblast atlas . Only PRRX1’s eRegulon activity, but not BNC2 and RUNX1/2, was estimated using SCENIC.
Fig 3:
Fig 3:. Five recurrent transcriptomic programs characterize EAC malignant cells with distinct RNA profiles.
a, Illustration of the methodology employed for identifying transcriptomic programs. For each patient, consensus non-negative matrix factorization (cNMF) is performed on the malignant cell compartment, followed by manual filtration to retain high-quality programs characterized by gene weightings. Pairwise cosine similarity between programs across all patients is computed to cluster programs using hierarchical clustering with average linkage. b, Cosine similarity matrix representing the similarity between cNMF-derived programs across all samples, clustered using hierarchical clustering with average linkage. The five identified programs (cNMF1 through cNMF5) are delineated. c, UMAP representation of the malignant cell compartment using unintegrated transcriptomic data, colored according to their program score (cNMF1 through cNMF5) and sample ID. d, GSEA enrichment of the five programs in the 50 hallmarks of cancer, based on genes ranked according to their weight contribution to cNMF programs. Hallmarks are grouped according to category. Enrichments that did not reach significance (FDR=0.05) are blanked out. e, GSEA enrichment plots for selected programs described by Nowicki et al. in Barrett’s esophagus. f, GSEA enrichment plots for hallmarks G2M checkpoint in cNMF2 and Epithelial-to-Mesenchymal transition in cNMF3. g, Distribution of the five program scores in metastatic and primary samples. Significance is computed using the Mann-Whitney U test. The difference in median score is indicated as Δ. h-i, Cosine similarity between programs derived with cNMF in external datasets and cNMF1 through cNMF5 programs, derived in the Carroll et al. dataset (h) and in the Croft et al. dataset (i). The cosine similarity is computed between the cNMF-derived gene weights of programs for all patients in the external datasets and the median gene weight associated with each cNMF program derived in the discovery set.
Fig 4:
Fig 4:. EAC malignant cell programs display unique ATAC profiles and epigenetic plasticity.
a, UMAP representation of the malignant cell compartment using unintegrated snATAC-seq data, color-coded according to their cNMF gene signature score (cNMF1 through cNMF5) and sample ID. The program score is transferred from the RNA annotation. b, Number of open chromatin regions significantly correlated with each program (FDR<0.05, Pearson’s R>0.1). c, Heatmap illustrating chromatin accessibility in cNMF-associated regions for representative program cells. Cells are scored using cNMF signatures derived from RNA, with the top 5% unique cells in each score selected as representative cells. The top 200 regions with the higher correlation between chromatin accessibility and each program are represented. d, Chromatin accessibility of representative cNMF program cells for genes of interest. Genes are selected based on their association with the regions of the highest correlation between chromatin accessibility and gene signature scores of cNMF programs. Chromatin accessibility of promoters for AKT2, MKI67, SPARC, BHLHE41, and ANXA11 is depicted for representative cells of cNMF1 through cNMF5 and all remaining carcinoma cells. e, The accuracy of classification of cells into cNMF programs using their chromatin accessibility profiles. Cells are scored by the average Z-score of chromatin accessibility of the top 200 cNMF-associated regions. The maximum score is used to classify cells into a chromatin accessibility identity; the percentage of cells from a gene expression identity classified into each chromatin accessibility identity is shown. f, Distribution of the epigenetic plasticity scores across representative cells of cNMF1 to cNMF5. Average Z-scores of ATAC accessibility vectors are transformed into a probability distribution using a softmax transformation with temperature, and the plasticity score is computed as the Shannon entropy over the resulting probability distribution. g, Representation of the candidate master transcription factors (mTFs) associated with programs consistent across datasets. We jointly model chromatin accessibility and gene expression to obtain candidate master transcription factors for each cNMF program in the discovery cohort that are subsequently validated in the two external validation cohorts. The identified mTFs consistent across datasets are represented.
Fig 5:
Fig 5:. Single-nuclei derived transcriptional programs highlight different spatial regions of EAC tumors.
a-b, Spatial transcriptomics (ST) slides of a, P8 primary tumor A and b, P5 primary tumor, colored according to cNMF program score and the CNV-derived label. For each spot, we infer the CNV profile with inferCNV and assign spots to tumor, mixed, and normal status. cNMF scores are computed as the average Z-score of signature genes using the deconvolved carcinoma-specific gene expression profile of spots derived with Cell2Location. c, Average cNMF score according to the position of the spots compared to the tumor leading edge. For each tumor spot, we compute the distance to the edge as the shortest path to a normal or mixed spot. The distribution of cNMF scores with standard error is represented for normal spots, mixed spots, and spots of a certain distance to the edge.
Fig 6:
Fig 6:. Discovered malignant programs have different clinical characteristics and predicted drug sensitivity.
a-b, Link between uncovered programs and a, N stage, i.e., proxy of the number of nearby lymph nodes that have cancer, and b, T stage, i.e., size and extent of the main tumor in the TCGA bulk cohort . Patients are scored using single-sample Gene Set Enrichment Analysis (ssGSEA) with a cancer-specific gene signature. Statistical testing is performed using the Mann-Whitney U test. c-e, Hazard ratio associated with scores in bulk validation cohorts of c, TCGA, d, Hoefnagel et al. , e, and Carroll et al. . Cox proportional hazard univariate models are employed using disease-specific survival for TCGA and overall survival for Hoefnagel et al. and Carroll et al. f, Distribution of the cNMF5 score in the malignant cell compartment of the Carroll et al. cohort , stratified by response to immune checkpoint inhibitor (ICI) therapy: clinical benefit (CB) and no clinical benefit (NCB). The cNMF5 program is scored on the full cohort. Paired measurements of patients were made before treatment (PreTx) and after a 4-week ICI treatment window (ICI-4W). The distribution of the cNMF5 score is compared among the CB and NCB groups across PreTx and ICI-4W time points. Significance testing is conducted using a Mann-Whitney U test. g, Predicted drug sensitivity by program. scTherapy is used to infer to which drugs may exhibit activity in specific tumor programs. The upset plot represents the total number of drugs predicted to target a specific program on the left, as well as the size of the intersection represented on the middle panel on the top. h, Selected predicted candidate combination therapies that could target all five programs at a time are represented.
Fig 7:
Fig 7:. Uncovered malignant programs show associations with clinical and molecular characteristics, prognosis, and distinct ecotypes.
a, Ecotype analysis of the data from the TCGA, Hoefnagel et al., and Carroll et al. cohorts deconvolved by BayesPrism. Distribution of cNMF scores in the two uncovered ecotypes, for each study. Statistical testing is performed using the Mann-Whitney U test. b, Estimated strength of interaction between cell types in spatial transcriptomics (ST) data. Using the NCEM method on Cell2Location-deconvolved data, we estimate in a spatially constrained manner the strength of interaction between cells from the 6 major compartments identified in the discovery cohort, represented for samples P8_A, P8_B, P8_C, P4, and P5. c-d, Significant ligand-receptor interactions uncovered with CellPhoneDB’s Squidpy implementation, LIGREC, for c, TME to tumor interactions and d, tumor to TME interactions. CellPhoneDB is run for each sample on spots near the edge of the tumor, defined as tumor spots (resp. normal spots) with a distance to the edge of less than 2. Only significant interactions (FDR p<0.1), for which the ligand/receptor is part of the signature genes of the cNMF programs/TME subtypes are represented. The ligand/receptor is colored according to which signature it belongs to. The hue encodes the CellPhoneDB mean of the ligand receptor pair; the level of significance is annotated for each existing interaction. ns: FDR p>0.1; *: 0.1≤p<0.01; **: 0.01≤p<0.001; ***: p≤0.001. e-h, Significant ligand-receptor interactions between e, P8 sample A tumor and TME components, f, P8 sample A TME and tumor components, g, P5 tumor and TME components, and h, P5 TME and tumor components. Each panel represents the log1p expression in spots. The ligand (resp. receptor) is colored according to the program whose signature genes it belongs to. Smaller panels represent the score distribution of the corresponding cNMF or TME component scores.
Fig 8:
Fig 8:. Summary of Key Findings in the Malignant Cell Compartment of Esophageal Adenocarcinoma (EAC).
Five distinct malignant programs were identified, characterized by unique RNA and ATAC accessibility profiles. Among these, cNMF5 and cNMF4 represented two stable opposed programs: cNMF5 resembled an undifferentiated program, while cNMF4 exhibited characteristics of a differentiated program. cNMF1 displayed features of an intermediate program between cNMF5 and cNMF4. Conversely, cNMF3 manifested as a rare epithelial-to-mesenchymal transition (EMT)-like program, and cNMF2 represented a cell cycling program. ATAC accessibility profiles suggested potential transitions between these programs. Specifically, cNMF3 appeared epigenetically similar to cNMF5 and cNMF1 but distinct from cNMF4, and cNMF2 exhibited similarities with cNMF5 and cNMF1 but not cNMF4. The two hypothesized stable programs, cNMF4 and cNMF5, displayed lower epigenetic plasticity compared to the other programs. Candidate master transcription factors (mTFs) were identified for each transcriptional program. Furthermore, cNMF5 was associated with differential response to immune checkpoint inhibitor (ICI) therapy, while cNMF4 showed associations with lower T and N stages and better prognosis following surgery and/or neoadjuvant therapy treatment. In contrast, cNMF3 exhibited a slight enrichment in higher T stages. cNMF1 and cNMF2 were preferentially located at the tumor core, while cNMF4 was preferentially located at the tumor periphery. Lastly, cNMF3 and cNMF4 interacted significantly with the TME while cNMF5 was associated with immune exclusion.

References

    1. Nowicki-Osuch K., Zhuang L., Jammula S., Bleaney C.W., Mahbubani K.T., Devonshire G., Katz-Summercorn A., Eling N., Wilbrey-Clark A., Madissoon E., et al. (2021). Molecular phenotyping reveals the identity of Barrett’s esophagus and its malignant transition. Science 373, 760–767. - PubMed
    1. Que J., Garman K.S., Souza R.F., and Spechler S.J. (2019). Pathogenesis and Cells of Origin of Barrett’s Esophagus. Gastroenterology 157, 349–364.e1. - PMC - PubMed
    1. Jiang M., Li H., Zhang Y., Yang Y., Lu R., Liu K., Lin S., Lan X., Wang H., Wu H., et al. (2017). Transitional basal cells at the squamous-columnar junction generate Barrett’s oesophagus. Nature 550, 529–533. - PMC - PubMed
    1. Pennathur A., Gibson M.K., Jobe B.A., and Luketich J.D. (2013). Oesophageal carcinoma. Lancet 381, 400–412. - PubMed
    1. Derakhshan M.H., Arnold M., Brewster D.H., Going J.J., Mitchell D.R., Forman D., and McColl K.E.L. (2016). Worldwide Inverse Association between Gastric Cancer and Esophageal Adenocarcinoma Suggesting a Common Environmental Factor Exerting Opposing Effects. Am. J. Gastroenterol. 111, 228–239. - PubMed

Publication types

LinkOut - more resources