. 2024 Aug 20:15:1430419.
doi: 10.3389/fimmu.2024.1430419. eCollection 2024.

Impact of E. muris infection on B. burgdorferi- induced joint pathology in mice

Affiliations

Impact of E. muris infection on B. burgdorferi- induced joint pathology in mice

Jesse L Bonin et al. Front Immunol. .

Abstract

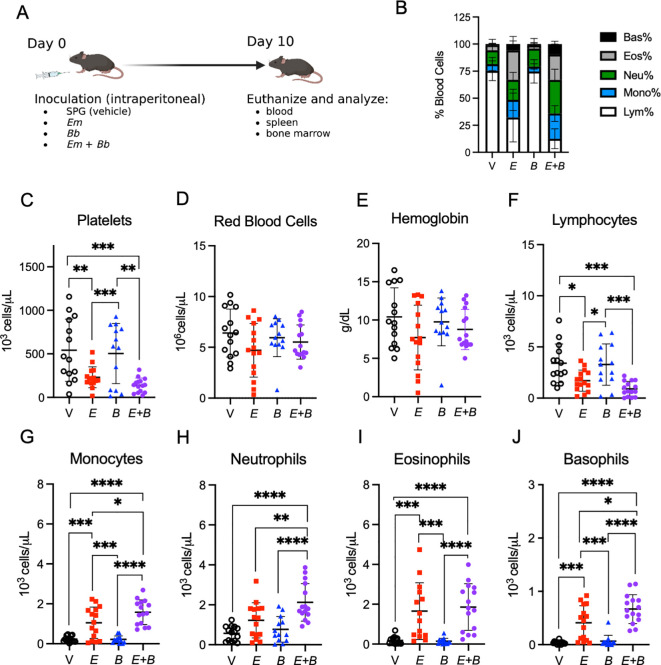
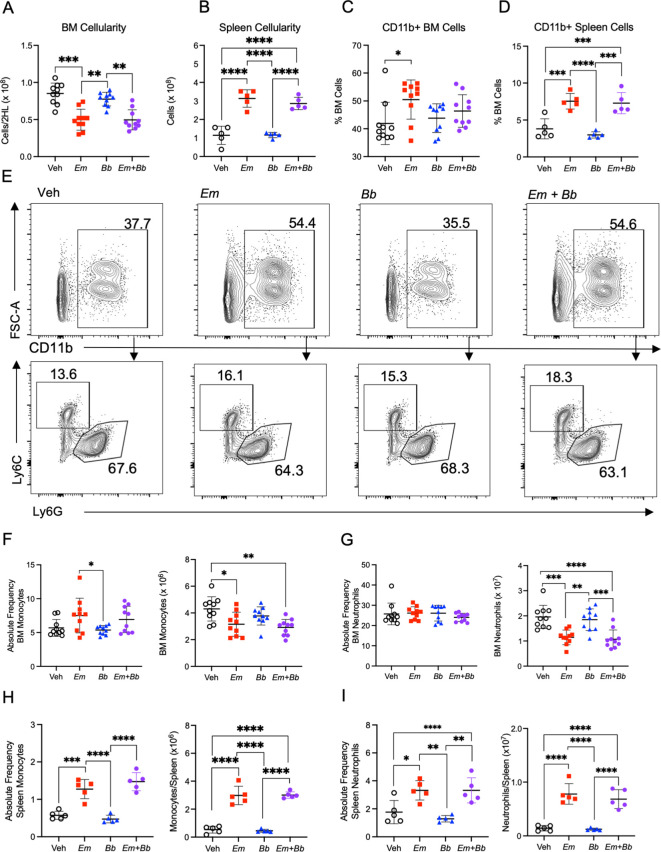
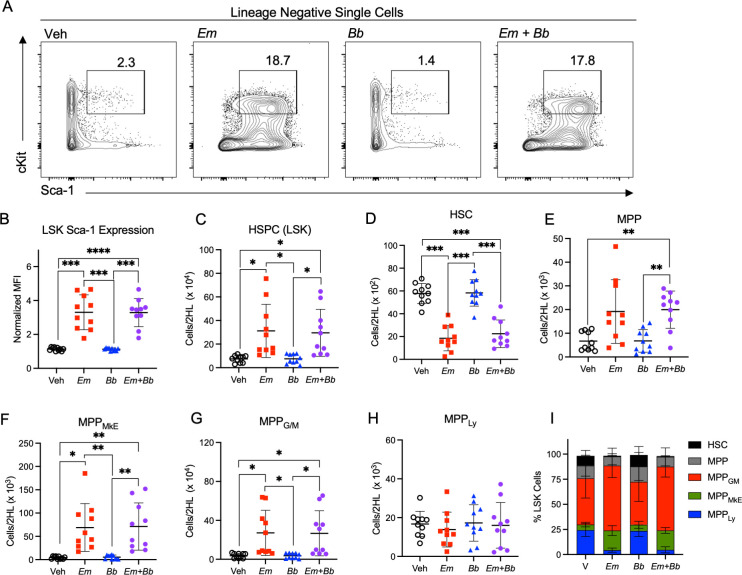
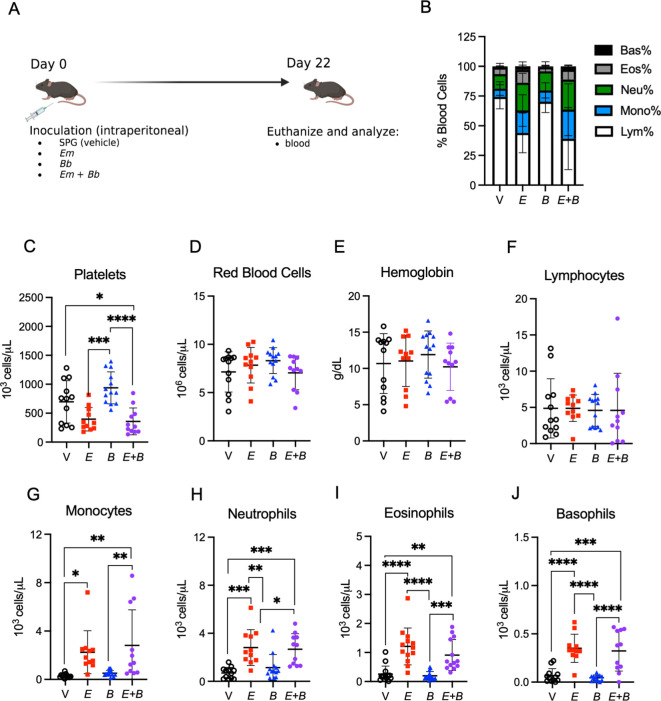
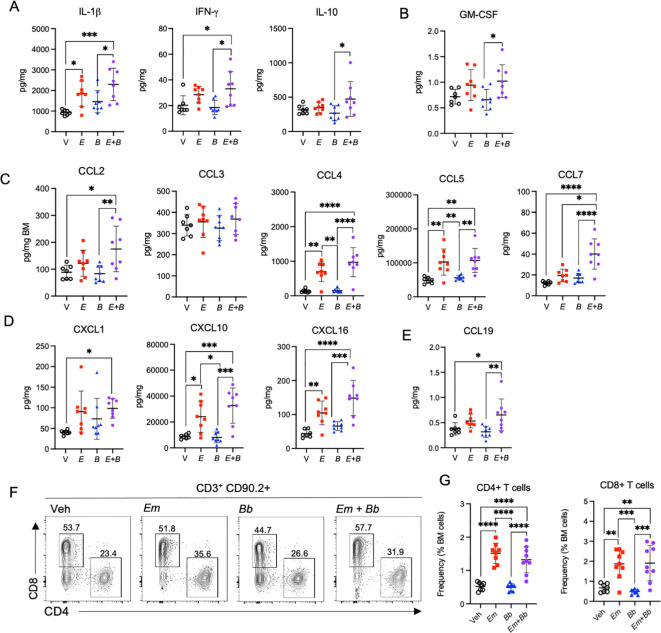
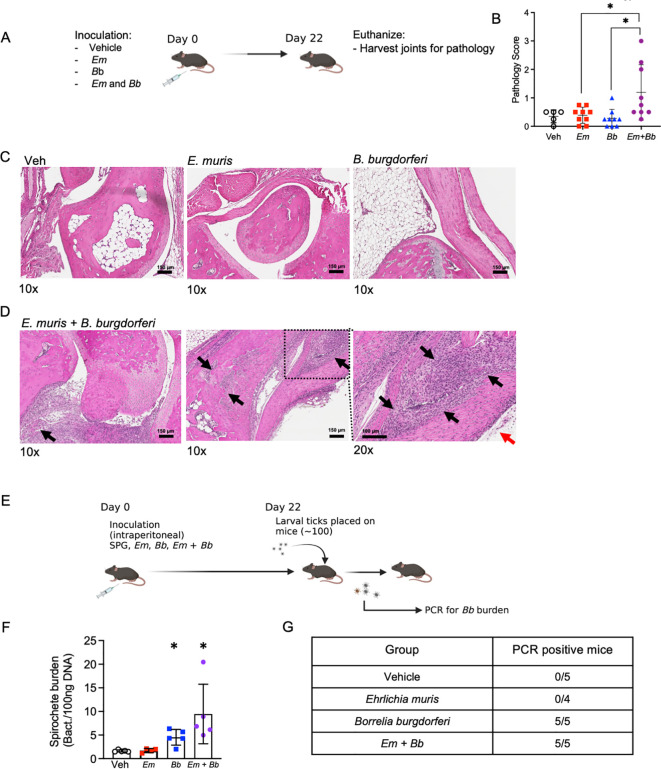
Tick-borne infections are increasing in the United States and around the world. The most common tick-borne disease in the United States is Lyme disease caused by infection with the spirochete Borrelia burgdorferi (Bb), and pathogenesis varies from subclinical to severe. Bb infection is transmitted by Ixodes ticks, which can carry multiple other microbial pathogens, including Ehrlichia species. To address how the simultaneous inoculation of a distinct pathogen impacted the course of Bb-induced disease, we used C57BL/6 (B6) mice which are susceptible to Bb infection but develop only mild joint pathology. While infection of B6 mice with Bb alone resulted in minimal inflammatory responses, mice co-infected with both Bb and the obligate intracellular pathogen Ehrlichia muris (Em) displayed hematologic changes, inflammatory cytokine production, and emergency myelopoiesis similar to what was observed in mice infected only with Em. Moreover, infection of B6 mice with Bb alone resulted in no detectable joint inflammation, whereas mice co-infected with both Em and Bb exhibited significant inflammation of the ankle joint. Our findings support the concept that co-infection with Ehrlichia can exacerbate inflammation, resulting in more severe Bb-induced disease.

Keywords: Borrelia (Borreliella) burgdorferi; Ehrlichia; hematopoiesis; infection; inflammation.


Conflict of interest statement

The authors declare that the research was conducted in the absence of any commercial or financial relationships that could be construed as a potential conflict of interest.

Figures

Figure 1
Figure 1
Co-infection of E. muris with B. burgdorferi exacerbate cytopenias. (A) B6 mice were inoculated with Vehicle (V, SPG), E. muris (Em), B. burgdorferi (Bb), or both Em and Bb. Mice were euthanized at 10-days post infection for analysis of tissues. Panel created with BioRender.com. Blood was collected and analyzed with a Heska HT5 CBC analyzer. (B) Composition of total white blood cells (WBC) is shown for V, Em, Bb, or Em and Bb co-infected mice including percent of lymphocytes, monocytes, and granulocytes (neutrophils, basophils, and eosinophils). (C) Platelets (D) red blood cells and (E) hemoglobin are shown for all groups. Total numbers of circulating (F) lymphocytes, (G) monocytes, (H) neutrophils, (I) eosinophils, and (J) basophils are shown. Data points represent individual mice; error bars represent standard deviation. Groups were compared using a one-way ANOVA with Tukey’s post-hoc comparison. *p<0.05, **P<0.01, ***p<0.001, ****p<0.0001. Data are pooled from 3 experiments, n=14-15 mice per group.
Figure 2
Figure 2
Co-infection impacts mature myeloid cells in the bone marrow and spleen at 10 dpi. B6 mice were inoculated with Vehicle (Veh), E muris (Em), B burgdorferi (Bb), or both Em and Bb. Hind limbs and spleens were harvested from single- and co-infected mice 10 days post infection. Total numbers of (A) bone marrow and (B) spleen cells were quantified. CD11b+ cells in the (C) bone marrow and (D) spleen. (E) Gating strategy to identify CD11b+ cells (top row) and Ly6C+ monocytes and Ly6G+ neutrophils cells within the CD11b+ population in the bone marrow of inoculated animals (bottom row). The numbers indicate frequencies of gated region among CD11b+ cells. (F) CD11b+ Ly6G- Ly6C+ monocytes and (G) CD11b+ Ly6G+ Ly6Clo neutrophils were quantified in the bone marrow. Splenic (H) monocytes and (I) neutrophils were quantified in the same manner. Data points represent individual mice. Cell numbers were compared using a one-way ANOVA with Tukey’s post-hoc comparison. Error bars represent standard deviation. *p<0.05, **p<0.01, ***p<0.001, ****p<0.0001. Data are pooled from 2 experiments, n=5-10 mice per group.
Figure 3
Figure 3
Co-infection drives loss of myeloid-biased progenitor cells in the bone marrow. B6 mice were inoculated with Vehicle (Veh), E. muris (Em), B. burgdorferi (Bb), or both Em and Bb. Bone marrow was isolated and stained to identify hematopoietic stem and progenitor cells at 10 days post infection. (A) Gating shows cKit and Sca-1 expression on Lineage-negative cells and the gated region reflects the percent of Sca-1+ cKit+ cells among the parent Lin- gate. (B) Sca-1 expression on LSK cells is shown. (C) Total Lin- Sca-1+ cKit+ (LSK) HSPCs are shown for Vehicle (SPG) controls and mice infected with Em, Bb or co-infected both pathogens. Hematopoietic stem cells (HSC) and multipotent progenitors (MPPs) were gated based on expression of CD135, CD150, and CD48 and the absolute numbers of (D) HSCs, (E) MPPs, (F) MPPMkE, (G) MPPG/M, and (H) MPPLy are shown. (I) The distribution of progenitor cells within the LSK population is shown. Data points represent individual mice. Groups were compared using a one-way ANOVA with Tukey’s post-hoc comparison. Error bars indicate standard deviation. *p<0.05, **p<0.01, ***p<0.001, ****p<0.0001. Data are pooled from 2 experiments n=10 mice per group.
Figure 4
Figure 4
Myeloid cells remain elevated while lymphocytes return to normal in the blood. (A) B6 mice were inoculated with Vehicle (V, SPG), E. muris (Em), B. burgdorferi (Bb), or both Em and Bb, and euthanized at 22 dpi, the peak of Bb infection. (B) Composition of total white blood cells (WBC) is shown for V, Em, Bb, or Em and Bb co-infected mice including percent of lymphocytes, monocytes, and granulocytes (neutrophils, basophils, and eosinophils). (C) Platelets, (D) red blood cells, and (E) hemoglobin is shown for all groups. Total numbers of circulating (F) lymphocytes, (G) monocytes, (H) neutrophils, (I) eosinophils, and (J) basophils. Data represent individual mice. Groups were analyzed using a one-way ANOVA with Tukey’s post-hoc comparison. Error bars represent standard deviation. *p<0.05, **p<0.01, ***p<0.001, ****p<0.0001. Data are pooled from 2 experiments, n=11-12 mice per group.
Figure 5
Figure 5
Co-infection drives persistent inflammation in the bone marrow. B6 mice were inoculated with Vehicle (V, SPG), E. muris (Em), B. burgdorferi (Bb), or both Em and Bb, and euthanized at 22 dpi. Bone marrow cells and protein were collected for flow cytometry and analysis of inflammatory cytokines and chemokines. (A) IL-1β, IFN-γ, and IL-10 are shown. (B) GM-CSF, (C) Monocyte chemoattractants CCL2, CCL3, CCL4, CCL5, CCL7 are shown. (D) CXCL1 and CXCL10, and (E) CCL19 are graphed. (F) Flow cytometric gating of CD90.2+ CD3+ lymphocytes for CD4+ or CD8+ T cells. The number above each gated region is the percent of parent gate for representative mice in each group. (G) Absolute frequencies of CD90.2+ CD3+ CD4+ T cell and CD90.2+ CD3+ CD8+ T cells among total bone marrow cells are shown. Data points represent individual mice. Groups were compared using a one-way ANOVA with Tukey’s post-hoc comparison. Error bars represent standard deviation. *p<0.05, **p<0.01, ***p<0.001, ***p<0.0001. Data are pooled from 2 experiments, n=7-8 mice per group.
Figure 6
Figure 6
Bb and Em co-infected B6 mice develop severe tibiotarsal arthritis. (A) Mice were inoculated with vehicle, Em, Bb, or Em and Bb, and tibiotarsal (ankle) joints were collected at 22 dpi to assess inflammation by histological examination of hematoxylin and eosin stained formalin-fixed and paraffin-embedded tissue sections. (B) Quantitative analysis of joint pathology, as described in the Materials and Methods. (C, D) Representative photomicrographs of tibiotarsal joint taken from B6 mice in Veh, Em, and Bb group. Images of two co-infected mice are shown [scale bar, 150 µm]. Arrows indicate histopathological findings described in the result section. Magnification (10x or 20x) is shown below each panel. (E) To confirm infection with Bb, xenodiagnosis assays were performed at 22 dpi. Briefly, larval ticks were placed on mice, allowed to feed, and then analyzed for Bb. (F) Ticks were collected after feeding and PCR was performed to test for the presence of Bb genetic material. Average spirochete burden is shown for the pooled ticks from each individual mouse in each group. (G) Summary table of data from xenodiagnosis assays. Data points indicate individual mice, error bars represent median with 95% CI. Data were analyzed using a Kruskal-Wallis with multiple comparison, *p<0.05. Joint pathology data represent data pooled from 2 experiments, n=5-9 mice per group. Xenodiagnosis data are from one experiment n=4-5 mice per group.

Similar articles

References

    1. Steere AC, Grodzicki RL, Kornblatt AN, Craft JE, Barbour AG, Burgdorfer W, et al. The spirochetal etiology of lyme disease. N Engl J Med. (1983) 308:733–40. doi: 10.1056/NEJM198303313081301 - DOI - PubMed
    1. Marques AR, Strle F, Wormser GP. Comparison of lyme disease in the United States and Europe. Emerg Infect Dis. (2021) 27:2017–24. doi: 10.3201/eid2708.204763 - DOI - PMC - PubMed
    1. McVicar M, Rivera I, Reyes JB, Gulia-Nuss M. Ecology of ixodes pacificus ticks and associated pathogens in the western United States. Pathogens. (2022) 11:89. doi: 10.3390/pathogens11010089 - DOI - PMC - PubMed
    1. Petzke M, Schwartz I. Borrelia burgdorferi pathogenesis and the immune response. Clin Lab Med. (2015) 35:745–64. doi: 10.1016/j.cll.2015.07.004 - DOI - PubMed
    1. Brown CR, Blaho VA, Loiacono CM. Susceptibility to experimental lyme arthritis correlates with KC and monocyte chemoattractant protein-1 production in joints and requires neutrophil recruitment via CXCR2. J Immunol. (2003) 171:893–901. doi: 10.4049/jimmunol.171.2.893 - DOI - PubMed

LinkOut - more resources