. 2024 Dec;29(12):858-872.
doi: 10.1111/nep.14381. Epub 2024 Sep 4.

PPAR gamma and PGC-1alpha activators protect against diabetic nephropathy by suppressing the inflammation and NF-kappaB activation

Affiliations

PPAR gamma and PGC-1alpha activators protect against diabetic nephropathy by suppressing the inflammation and NF-kappaB activation

Siyi Huang et al. Nephrology (Carlton). 2024 Dec.

Abstract

Aim: Inflammation plays a critical role in the progression of diabetic nephropathy. Peroxisome proliferator-activated receptor gamma (PPARγ) and its coactivator PPARγ coactivator-1 alpha (PGC-1α) enhance mitochondrial biogenesis and cellular energy metabolism but inhibit inflammation. However, the molecular mechanism through which these two proteins cooperate in the kidney remains unclear. The aim of the present study was to investigate this mechanism.

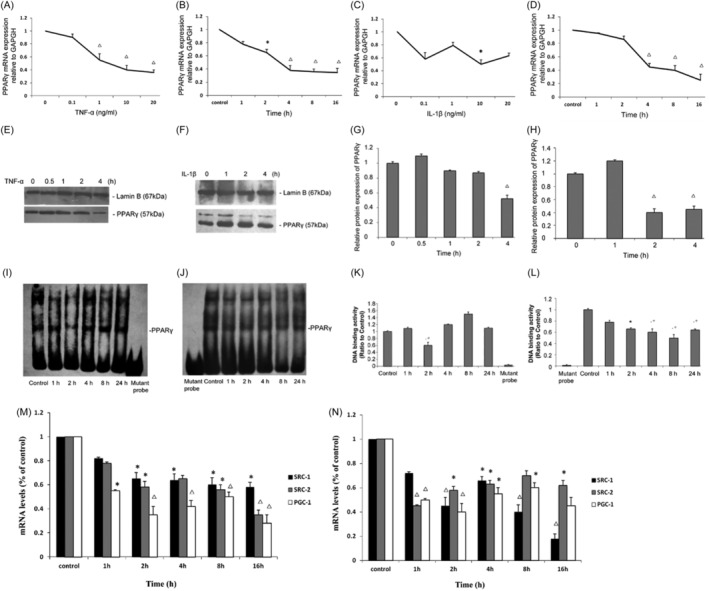
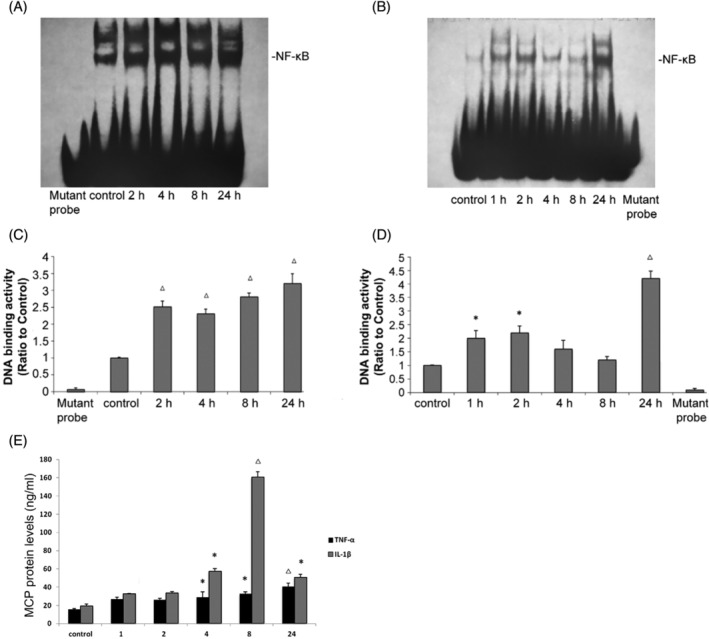
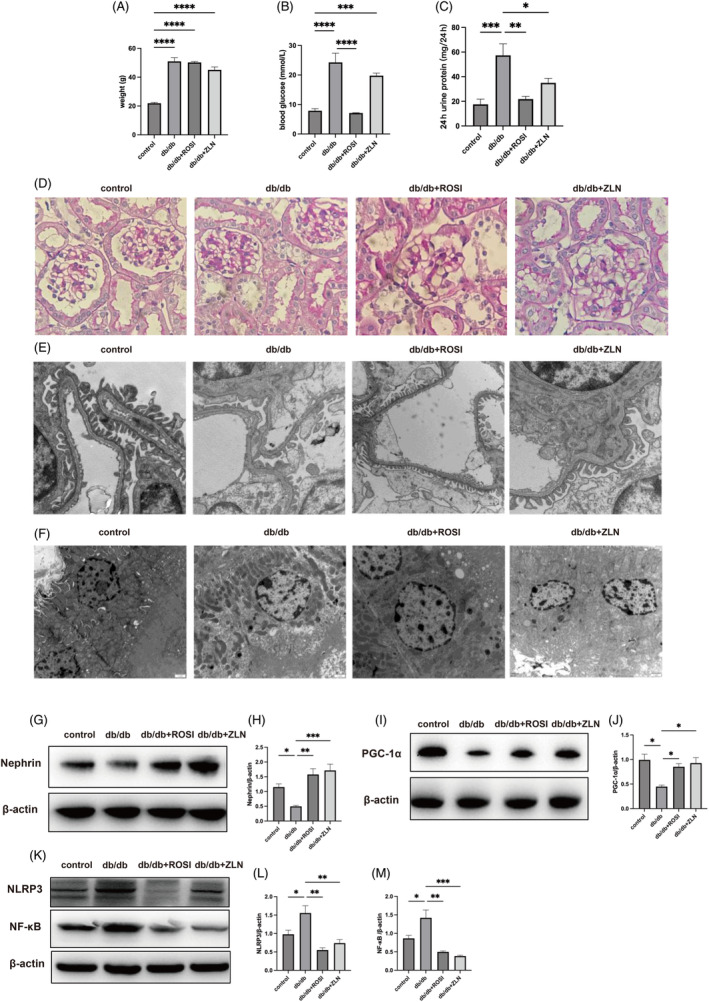
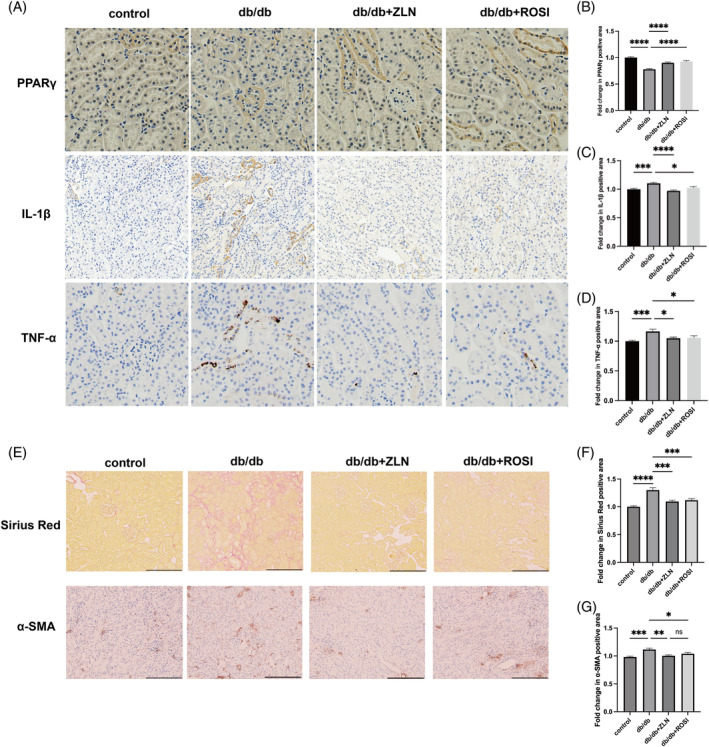
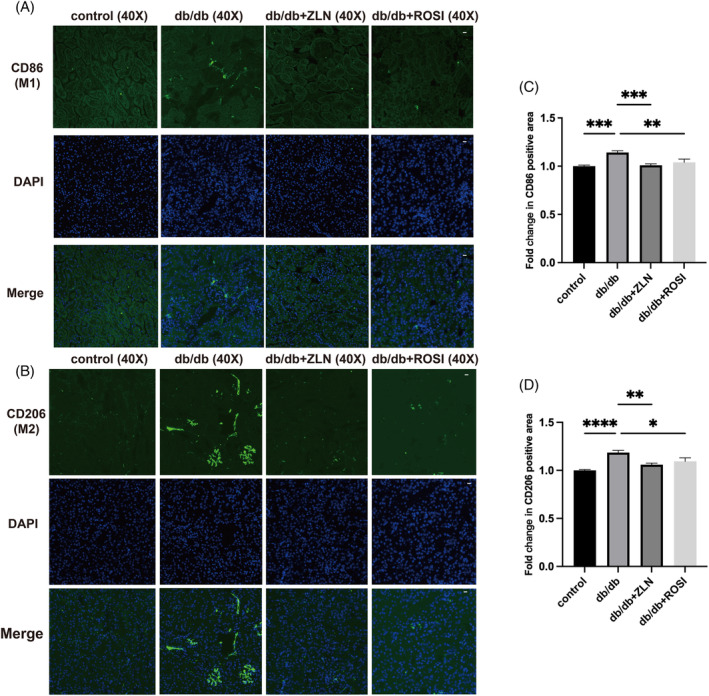
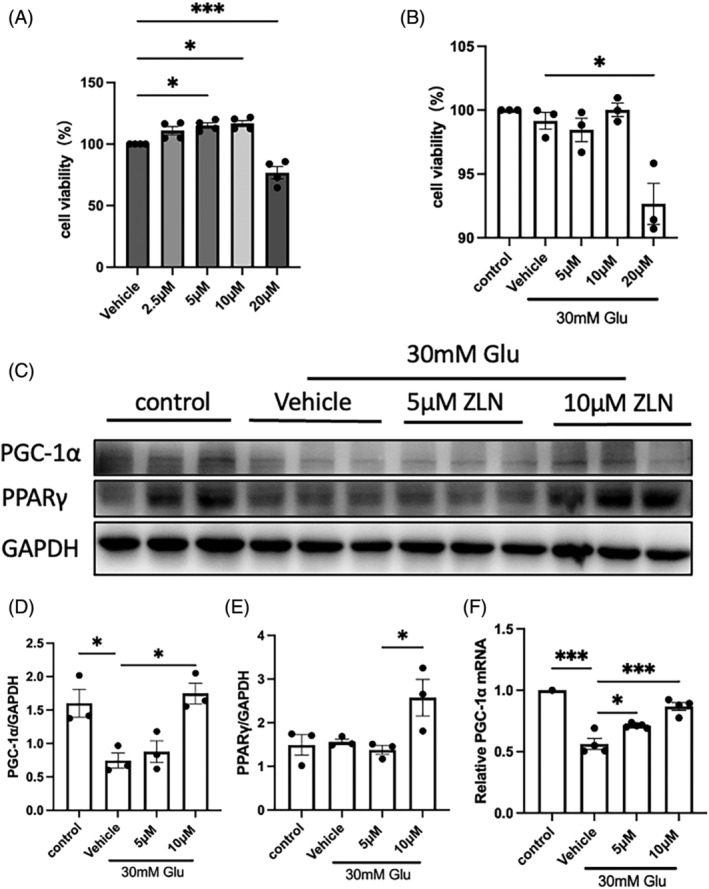
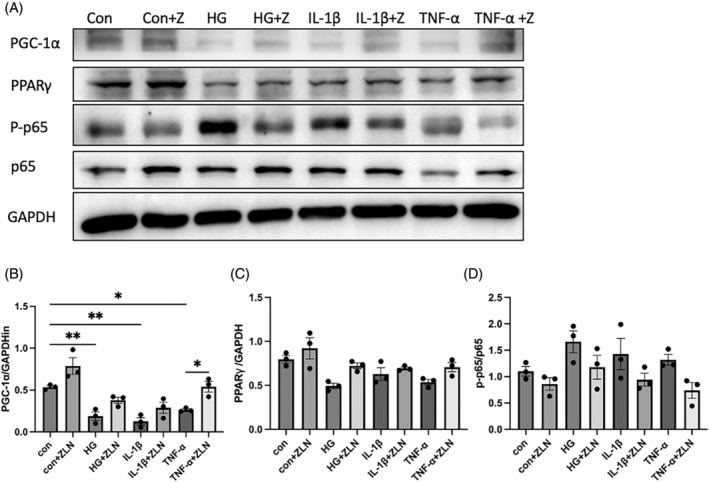
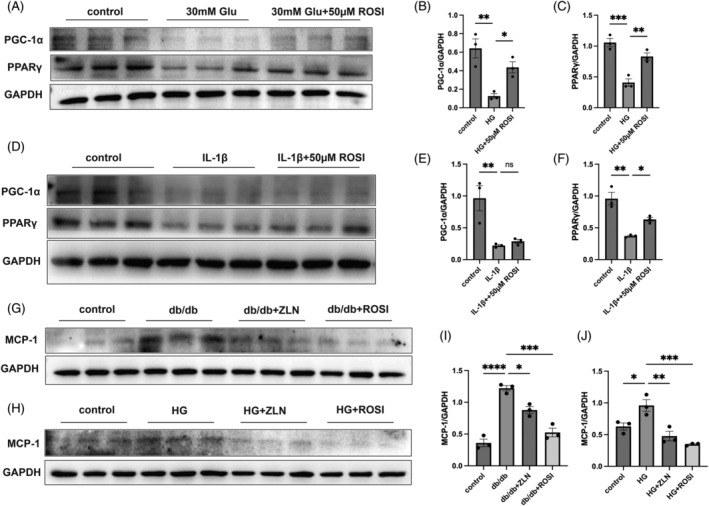
Methods: HK-2 human proximal tubular cells were stimulated by inflammatory factors, the expression of PPARγ and PGC-1α were determined via reverse transcription-quantitative polymerase chain reaction (PCR) and western blotting (WB), and DNA binding capacity was measured by an EMSA. Furthermore, db/db mice were used to establish a diabetic nephropathy model and were administered PPARγ and PGC-1α activators. Kidney injury was evaluated microscopically, and the inflammatory response was assessed via WB, immunohistochemistry and immunofluorescence staining. Besides, HK-2 cells were stimulated by high glucose and inflammatory factors with and without ZLN005 treatment, the expression of PPARγ, PGC-1α, p-p65 and p65 were determined via qPCR and WB.

Results: Our results revealed that both TNF-α and IL-1β significantly decreased PPARγ and PGC-1 expression in vitro. Cytokines obviously decreased PPARγ DNA binding capacity. Moreover, we detected rapid activation of the NF-κB pathway in the presence of TNF-α or IL-1β. PPARγ and PGC-1α activators effectively protected against diabetic nephropathy and suppressed NF-κB expression both in db/db mice and HK-2 cells.

Conclusion: PPARγ and its coactivator PGC-1α actively participate in protecting against renal inflammation by regulating the NF-κB pathway, which highlights their potential as therapeutic targets for renal diseases.

Keywords: NF‐κB; PGC‐1α; PPARγ; inflammation; kidney.


Conflict of interest statement

All the authors declared no competing interests.

Figures

FIGURE 1
FIGURE 1
Effects of tumour necrosis factor‐α (TNF‐α) and interleukin‐1β (IL‐1β) on the expression of peroxisome proliferator‐activated receptor gamma (PPARγ), SRC‐1, SRC‐2, PGC‐1 and the binding of nuclear proteins to PPARγ in HK‐2 cells. Total mRNA levels of PPARγ when HK‐2 cells were cultured for 24 h with various concentrations of TNF‐α (A) and IL‐1β (B) as indicated. Additionally, total mRNA levels of PPARγ when HK‐2 cells were cultured with 10 ng/mL TNF‐α (C) or IL‐1β (D) for various durations as indicated. (E, F) Nuclear protein of HK‐2 cells treated for various durations with 10 ng/mL TNF‐α or IL‐1β was extracted, and Western blot analysis was performed using antibodies recognizing PPARγ as described in the Methods section. (G, H) Relative protein levels (% of the control group) normalized to Lamin B levels are reported. 10 μg of the nuclear protein was used for the electrophoretic mobility shift assay (EMSA) with oligonucleotides corresponding to PPARγ‐specific response elements as described in the Materials and Methods. (I, J) Representative EMSA results for the nuclear receptors studied. (K, L) Quantification of the EMSA data from individual experiments. Total mRNA levels of SRC‐1, SRC‐2 and PGC‐1 when HK‐2 cells were treated for various durations with 10 ng/mL TNF‐α (M) or IL‐1β (N). The data (means±SEMs, n = 3) are expressed as percentages of the control values.*p < .05 versus the contro groupl, p < .01 versus the control group.
FIGURE 2
FIGURE 2
Tumour necrosis factor‐α (TNF‐α) and interleukin‐1β (IL‐1β) increase the binding of nuclear proteins to NF‐κB and monocyte chemoattractant protein‐1 (MCP‐1) expression. HK‐2 cells were treated with TNF‐α or IL‐1β at 10 ng/mL as indicated. Nuclear protein was used for the electrophoretic mobility shift assay (EMSA) with oligonucleotides corresponding to PPARγ‐specific response elements as described in the Materials and Methods. (A, B) Representative EMSA results for the nuclear receptors studied. (C, D) Quantification of the EMSA data from individual experiments. (E) MCP‐1 protein levels in the cell culture supernatant were determined by enzyme‐linked immunosorbent assay (ELISA) as described in the Materials and Methods. The data (means±SEMs, n = 3) are from duplicate experiments and expressed as percentages of the control values. *p < .05 versus the control group, p < .01 versus the control group. PPARγ, peroxisome proliferator‐activated receptor.
FIGURE 3
FIGURE 3
Treatment with Rosiglitazone or ZLN005 exerts protective effects against diabetic nephropathy and inhibits inflammation in the renal tissues of db/db mice. After 8 weeks of treatment, (A) body weight in the control, db/db, db/db + ROSI, db/db + ZLN groups was measured. (B) Blood glucose levels in the four mentioned groups were measured. (C) Twenty‐four‐hour urinary albumin excretion in mice from the four mentioned groups was measured. The data are presented as the mean ± SEM (n = 6 per group). Representative photomicrographs depicting (D) PAS staining in the four groups after the 8‐week experimental period. Original magnification, ×400. Representative transmission electron microscopy (TEM) micrographs of foot processes, the glomerular basement membrane (GBM) (E) and tubular cells (F) in the control, db/db, db/db + ROSI, db/db + ZLN groups. Original magnification, ×10 000. (G) Western blot (WB) analysis of nephrin and β‐Actin expression in the control, db/db, db/db + ROSI, db/db + ZLN groups. (H) Densitometric analysis of the WB results. The relative band intensity was normalized to the intensity of the corresponding β‐actin band. (I) WB analysis of PPARγ coactivator‐1 alpha (PGC‐1α) and β‐actin expression in the control, db/db, db/db + ROSI, db/db + ZLN groups. (J) Densitometric analysis of the WB results. The relative band intensity was normalized to the intensity of the corresponding β‐actin band. (K) WB analysis of NF‐κB, NLRP3 and β‐Actin expression in the control, db/db, db/db + ROSI, db/db + ZLN groups. (L, M) Densitometric analysis of the WB results. The relative band intensity was normalized to the intensity of the corresponding β‐actin band. The data are presented as the mean ± standard deviation (n = 6 per group). NS p ≥ .05, *p < .05, **p < .01, ***p < .001, ****p < .0001.
FIGURE 4
FIGURE 4
Rosiglitazone or ZLN005 alleviates renal inflammatory response and fibrosis in diabetic nephropathy mice. (A) Representative images of immunohistochemical staining for peroxisome proliferator‐activated receptor (PPARγ), tumour necrosis factor‐α (TNF‐α) and interleukin‐1β (IL‐1β) at ×200 magnification. (B–D) the PPARγ‐positive, TNF‐α‐positive and IL‐1β‐positive areas in db/db mice, ZLN005 or Rosiglitazone treatment mice are shown as the fold change relative to the control group. (E) Representative photomicrographs depicting Sirius Red staining and immunohistochemical staining for α‐SMA in the control, db/db, db/db + ROSI, db/db + ZLN groups after the 8‐week experimental period. Original magnification, ×200. (F and G) the Sirius Red‐positive and α‐SMA‐positive areas in db/db mice, ZLN005 or Rosiglitazone treatment mice are shown as the fold change relative to the control group. (n = 10, NS p ≥ .05, *p < .05, ***p < .001, ****p < .0001).
FIGURE 5
FIGURE 5
Effects of ZLN005 on macrophage phenotypes. (A and B) Representative images of immunofluorescence staining for the M1 macrophage marker CD86 and the M2 macrophage marker CD206 at ×40 magnification. Scale bar = 50 μm. (C and D) Quantification of CD86+ macrophages and CD206+ macrophages in db/db mice and db/m mice is shown as the fold change relative to the ZLN005 treatment group (n = 10, NS p ≥ .05, *p < .05, **p < .01, ***p < .001, ****p < .0001).
FIGURE 6
FIGURE 6
Effects of ZLN005 treatment on high glucose‐induced HK2 cell injury. (A) Summary data showing the viability of HK2 cells treated with 0, 2.5, 5, 10 or 20 μM ZLN005 under low‐glucose conditions to determine safe treatment concentrations. (B) Summary data showing the viability of HK2 cells cultured under low‐glucose conditions or treated with 0, 5, 10 or 20 μM ZLN005 under high‐glucose stimulation for 48 h. (C) Representative Western blot images and (D, E) summary data showing the dose‐dependent effect of ZLN005 on the high glucose‐induced decrease in PPARγ coactivator‐1 alpha (PGC‐1α) and peroxisome proliferator‐activated receptor gamma protein expression. (F) Summary data showing relative PGC‐1α mRNA levels in HK2 cells cultured under low‐glucose conditions or treated with 0, 5, or 10 μM ZLN005 under high‐glucose stimulation for 48 h. n = 8–9. NS p ≥ .05, *p < .05, **p < .01, ***p < .001.
FIGURE 7
FIGURE 7
The peroxisome proliferator‐activated receptor (PPARγ) coactivator‐1 alpha (PGC‐1α) activator ZLN005 protects against diabetic nephropathy‐induced activation of NF‐κB by increasing PGC‐1α and PPARγ levels in HK2 cells. (A) Representative Western blot images and (B–D) summary data showing PGC‐1α, PPARγ and p65/p‐p65 protein levels in HK2 cells treated with ZLN005 or without ZLN005 and exposed to high glucose, interleukin‐1β and tumour necrosis factor‐α (TNF‐α). n = 8–9. NS p ≥ .05, *p < .05, **p < .01, ***p < .001.
FIGURE 8
FIGURE 8
Rosiglitazone or ZLN005 alleviates diabetic nephropathy‐induced monocyte chemoattractant protein‐1 (MCP‐1) production. (A) Representative western blot (WB) images and (B and C) summary data showing the peroxisome proliferator‐activated receptor (PPARγ) coactivator‐1 alpha (PGC‐1α) and PPARγ protein expression levels in HK2 cells cultured under low‐glucose conditions or treated with 0, 50 μM Rosiglitazone under high‐glucose stimulation for 48 h. (D) Representative WB images and (E and F) summary data showing the PGC‐1α and PPARγ protein expression levels in HK2 cells treated with 0, 50 μM Rosiglitazone under interleukin‐1β stimulation for 48 h. (G) Representative WB images and (H) summary data showing MCP‐1 protein levels in kidney lysates of the control, db/db, db/db + ROSI, db/db + ZLN groups mice. (I) Representative WB images and (J) summary data showing MCP‐1 protein levels in HK2 cells treated with either Rosiglitazone or ZLN005 or without treatment under exposure to high glucose. n = 8–9. NS p ≥ .05, *p < .05, **p < .01, ***p < .001, **** p < .0001.

Similar articles

Cited by

References

    1. Araújo LS, Torquato BGS, da Silva CA, et al. Renal expression of cytokines and chemokines in diabetic nephropathy. BMC Nephrol. 2020;21:308. - PMC - PubMed
    1. Sun X, Liu Y, Li C, et al. Recent advances of curcumin in the prevention and treatment of renal fibrosis. Biomed Res Int. 2017;2017:2418671. - PMC - PubMed
    1. Zhang L, Zhou Y, Zhou F, et al. Altered expression of long noncoding and messenger RNAs in diabetic nephropathy following treatment with rosiglitazone. Biomed Res Int. 2020;2020:1360843. - PMC - PubMed
    1. Wu H, Malone AF, Donnelly EL, et al. Single‐cell transcriptomics of a human kidney allograft biopsy specimen defines a diverse inflammatory response. J Am Soc Nephrol. 2018;29:2069‐2080. - PMC - PubMed
    1. Borsting E, Cheng VP, Glass CK, Vallon V, Cunard R. Peroxisome proliferator‐activated receptor‐γ agonists repress epithelial sodium channel expression in the kidney. Am J Physiol Renal Physiol. 2012;302:F540‐F551. - PMC - PubMed

MeSH terms