. 2024 Nov;11(41):e2402241.
doi: 10.1002/advs.202402241. Epub 2024 Sep 4.

IL6 Derived from Macrophages under Intermittent Hypoxia Exacerbates NAFLD by Promoting Ferroptosis via MARCH3-Led Ubiquitylation of GPX4

Affiliations

IL6 Derived from Macrophages under Intermittent Hypoxia Exacerbates NAFLD by Promoting Ferroptosis via MARCH3-Led Ubiquitylation of GPX4

Weisong Cai et al. Adv Sci (Weinh). 2024 Nov.

Abstract

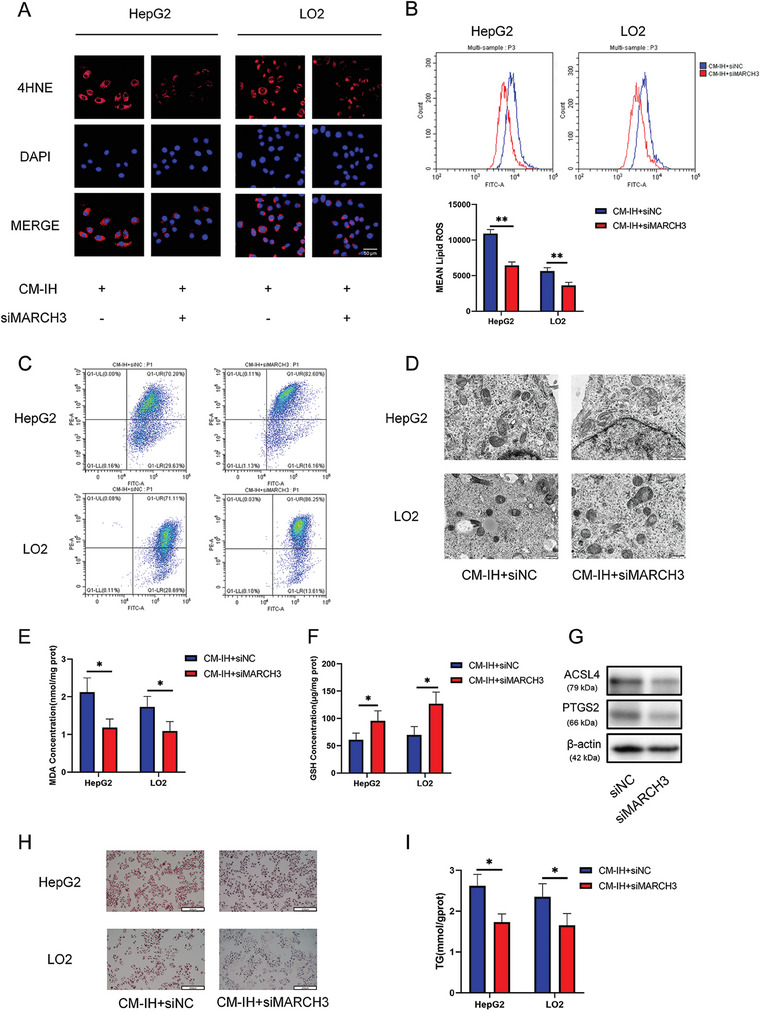
Obstructive sleep apnea (OSA) is a common sleep disorder characterized by intermittent hypoxia (IH) and is associated with the occurrence and development of nonalcoholic fatty liver disease (NAFLD). However, the specific mechanism by which OSA induces NAFLD remains unclear. Therefore, effective interventions are lacking. This study aims to investigate the role and mechanism of ferroptosis in OSA-related NAFLD using clinical data analyses, cell-based molecular experiments, and animal experiments. Indicators of liver function, lipid accumulation, and ferroptosis are also examined. RNA-seq, qPCR, western blotting, gene intervention, and E3 ligase prediction using UbiBrowser and co-IP are used to explore the potential underlying mechanisms. The results show that ferroptosis increases in the liver tissues of patients with OSA. Chronic IH promotes NAFLD progression in mice and is alleviated by a ferroptosis inhibitor Fer-1. The increased secretion of IL6 by macrophages can promote the expression of MARCH3 in hepatocytes under intermittent conditions, and subsequently promote the ubiquitination and degradation of GPX4 to regulate ferroptosis and lipid accumulation in hepatocytes. Hence, targeted inhibition of MARCH3 may alleviate IH-induced ferroptosis and lipid accumulation in liver tissues and inhibit the progression of NAFLD.

Keywords: IL6; MARCH3; NAFLD; OSA; ubiquitination.


Conflict of interest statement

The authors declare no conflict of interest.

Figures

Figure 1
Figure 1
Ferroptosis increased in the liver tissues of patients with OSA. A) Correlation analyses between liver function indicators (ALT and AST) and key indicators of OSA (AHI and ODI) (n = 270). B) IHC analysis of key proteins expressed via different pathways of programmed death (scale bar, 100 µm). C) Prussian blue staining of iron (scale bar, 100 µm). D,E) Levels of MDA and GSH in liver tissues of patients (non‐OSA = 10, OSA = 10). All bar charts shown represent the mean ± SEM, * p < 0.05, ** p < 0.01, *** p < 0.001, ns, not significant, by t‐test.
Figure 2
Figure 2
Chronic intermittent hypoxia promoted NAFLD progression in mice. A) Interventions for different groups of mice. B) Representative images of the livers from control, HFD, CIH, and HFD+CIH mice after eight weeks of intervention (n = 5 per group). C) Body weights of mice after modeling. D) Liver weight and E) LW/BW ratio of the four groups. F) Serum ALT and AST levels in the four groups. G) H&E staining and Oil red O staining of mouse liver tissues (scale bar, 100 µm). H) Mouse liver lipid levels: TG, TC, and NEFA levels. I) Transcription levels of fatty acid uptake, J) fatty acid synthesis, and K) fatty acid β‐oxidation‐related genes in mouse liver tissues. L) Serum HMGB1, P‐selectin, and GDF15 levels. All bar charts shown represent the mean ± SEM, * p < 0.05, ** p < 0.01, *** p < 0.001, ns, not significant, by ANOVA.
Figure 3
Figure 3
Inhibition of ferroptosis alleviated CIH‐induced liver function injury in HFD‐fed mice. A) Iron levels (liver iron content was normalized to liver mass), B) MDA, and C) GSH in mouse liver tissues from the control, HFD, CIH, and HFD+CIH groups (n = 5 per group). D) Western blotting was used to detect GPX4 levels in mouse liver tissues. E) Interventions for the different groups of mice. F) Weight, G) representative images, H) liver weight, and I) LW/BW ratio of the mice in HFD+CIH+saline and HFD+CIH+Fer‐1 groups. Ferroptosis indices showed the concentrations of J) iron, K) MDA, and L) GS in mouse liver tissues from the two groups. M) Mouse serum levels of ALT and AST in the two groups. N) H&E and Oil red O staining of mouse liver tissues (scale bar, 100 µm). O) Mouse serum TG, TC, and NEFA levels. All bar charts shown represent the mean ± SEM, * p < 0.05, ** p < 0.01, *** p < 0.001, A‐D by ANOVA, F‐O by t‐test.
Figure 4
Figure 4
Supernatants derived from macrophages under IH promoted lipid accumulation in hepatocytes. A) Oil Red O staining of HepG2 and LO2 cells from the control, IH, FFA (1 × 10−3 m, 24 h), and IH+FFA groups (scale bar, 100 µm). B,C) TG levels in FFA‐ and IH+FFA‐treated hepatocytes over time. D) IHC was used to evaluate the levels of macrophage markers CD68 and MAC387 in liver tissues of patients with or without OSA (scale bar, 100 µm; non‐OSA = 10, OSA = 10). E) IHC was used to evaluate the levels of macrophage markers F4/80 and CD11B in the liver tissues of control and CIH groups (scale bar, 100 µm). F) Transwell assay of macrophages. G) Transcription levels of active macrophages markers in liver tissues of patients with or without OSA. H) Transcription levels of active macrophages markers in the liver tissues of control and CIH groups. I) Schematic diagram of the in vitro construction of cell model. J,K) TG levels in HepG2 and LO2 cells treated with CM‐Control or CM‐IH over time. L) Oil Red O staining of HepG2 and LO2 cells from the CM‐Control and CM‐IH groups (scale bar, 100 µm). All bar charts shown represent the mean ± SEM, * p < 0.05, ** p < 0.01, *** p < 0.001, by t‐test.
Figure 5
Figure 5
Supernatants derived from macrophages under IH promoted lipid accumulation in hepatocytes by inducing ferroptosis. A) Level of 4‐HNE in HepG2 (F) and LO2 (G) cells treated with Fer‐1 (10 × 10−6 m) or DFO (100 × 10−6 m) 24 h was determined using IF (scale bar, 100 µm). B,C) Level of lipid ROS determined using flow cytometry. D) Mitochondrial membrane potential was assessed using JC‐1 staining, which revealed mitochondria with high (increased PE) or low (increased FITC) membrane potential. E) Mitochondrial structure in HepG2 and LO2 cells under an electron microscope (scale bar, 500 nm). TG levels in F) HepG2 and G) LO2 cells treated with Fer‐1 or DFO. All bar charts shown represent the mean ± SEM, * p < 0.05, ** p < 0.01, *** p < 0.001, by ANOVA.
Figure 6
Figure 6
IL‐6 derived from macrophages under IH induced ferroptosis and lipid accumulation in hepatocytes. A–D) RNA‐seq data of HepG2 cells treated with CM‐control or CM‐IH (24 h). A) Heatmap, B) volcano map, C) PPI analysis, and D) enrichment analysis of DEGs. E) IL6 mRNA level in macrophages evaluated by q‐PCR. F) IL6 concentration in the macrophage supernatant determined by ELISA. G) Level of 4‐HNE determined using IF (scale bar, 100 µm). H) Level of lipid ROS determined using flow cytometry. I) Mitochondrial membrane potential was assessed using JC‐1 staining, which revealed mitochondria with high (increased PE) or low (increased FITC) membrane potential. J) Mitochondrial structure in HepG2 and LO2 cells under an electron microscope (scale bar, 500 nm). Levels of K) MDA and L) GSH in hepatocytes. M) Oil Red O staining of HepG2 and LO2 cells from the DMSO and IL6 NAbs groups (200 ng mL−1, 24 h). N) TG level in HepG2 or LO2 cells treated with DMSO or IL6 NAbs. All bar charts shown represent the mean ± SEM, * p < 0.05, ** p < 0.01, by t‐test.
Figure 7
Figure 7
IL6‐induced degradation of GPX4 protein in hepatocytes was dependent on MARCH3. A) GPX4 mRNA levels in HepG2 cells evaluated by q‐PCR. B) GPX4 protein levels in HepG2 cells determined by western blot analysis (20 × 10−6 m MG132, 100 µg mL−1 CHX). C) Potential E3 ligases of GPX4 predicted by UbiBrowser. D) Transcription levels of MARCH1, MARCH3, MARCH8, and MARCH11 determined via RNA‐seq in HepG2 cells. E,F) Levels of GPX4 and MARCH3 in HepG2 cells treated with different interventions were evaluated by western blot analysis. G) Interaction between MARCH3 and GPX4 was confirmed by co‐IP. GPX4 ubiquitination level in cells with H) exogenous overexpression or I) endogenous knockdown of MARCH3. J) Levels of nGPX4(nucleus GPX4), cGPX4(cytoplasm GPX4) and mGPX4(mitochondria GPX4) in HepG2 cells treated with different interventions were evaluated by western blot analysis. K) Intersection of DEGs and predicted transcription factors targeting MARCH3 genes was shown using a Venn diagram. L) Levels of RUNX1, MARCH3, and GPX4 in HepG2 cells treated with CM‐IH and siRUNX1. All bar charts shown represent the mean ± SEM, * p < 0.05, ** p < 0.01, *** p < 0.001, ns, not significant, A by t‐test, B‐K by ANOVA.
Figure 8
Figure 8
Knockdown of MARCH3 alleviated CM‐IH‐induced ferroptosis and lipid accumulation in hepatocytes. A) Level of 4‐HNE determined using IF (scale bar, 100 µm). B) Level of lipid ROS determined using flow cytometry. C) Mitochondrial membrane potential was assessed by JC‐1 staining, which revealed mitochondria with high (increased PE) or low (increased FITC) membrane potential. D) Mitochondrial structure in HepG2 and LO2 cells under an electron microscope (scale bar, 500 nm). Levels of E) MDA and F) GSH in hepatocytes. G) Expression of ACSL4 and PTGS2 were detected by western blot analysis. H) Oil Red O staining of HepG2 and LO2 cells from the siNC and siMARCH3 groups (scale bar, 100 µm). I) TG levels in HepG2 or LO2 cells treated with siNC or siMARCH3. All bar charts shown represent the mean ± SEM, * p < 0.05, ** p < 0.01, by t‐test.
Figure 9
Figure 9
Knockdown of MARCH3 alleviated the development of CIH‐induced NAFLD in vivo. A) MARCH3 protein levels in mouse liver tissues were tested via western blot analysis (n = 5 per group). B) Schematic diagram of the interventions used in the different groups of mice. C) Weight of the mice after the intervention. D) Representative images, E) liver weight, and F) LW/BW ratios of the mouse livers. G) Expression of the viral vector fluorescent protein was detected by immunofluorescence. H) Levels of MARCH3 and GPX4 in mouse liver tissues. I) Transcription levels of MARCH3 in different mouse tissues. J) Serum ALT and AST levels. K) H&E staining and Oil red O staining of mouse liver tissues (scale bar, 100 µm). L) Mouse liver lipid contents: TG, TC, and NEFA levels. M) Transcription levels of fatty acid metabolism‐related genes. Levels of N) MDA, O) GSH, and P) iron in mouse livers. Q) Expression of ACSL4 and PTGS2 were detected by western blot analysis. All bar charts shown represent the mean ± SEM, * p < 0.05, ** p < 0.01, *** p < 0.001, ns, not significant, by t‐test.

References

    1. Gottlieb D. J., Punjabi N. M., JAMA 2020, 323, 1389. - PubMed
    1. Gaines J., Vgontzas A. N., Fernandez‐Mendoza J., Bixler E. O., Sleep Med, Rev. 2018, 42, 211. - PMC - PubMed
    1. Friedman S. L., Neuschwander‐Tetri B. A., Rinella M., A. J. Sanyal, Nat. Med. 2018, 24, 908. - PMC - PubMed
    1. Powell E. E., Wong V. W., Rinella M., Lancet 2021, 397, 2212. - PubMed
    1. Parikh M. P., Gupta N. M., McCullough A. J., Clin. Liver Dis. 2019, 23, 363. - PMC - PubMed

MeSH terms

Substances

LinkOut - more resources