Review
. 2024 Oct 21;379(1912):20220521.
doi: 10.1098/rstb.2022.0521. Epub 2024 Sep 4.

Beyond the here and now: hunter-gatherer socio-spatial complexity and the evolution of language

Affiliations
Review

Beyond the here and now: hunter-gatherer socio-spatial complexity and the evolution of language

Brian M Wood et al. Philos Trans R Soc Lond B Biol Sci. .

Abstract

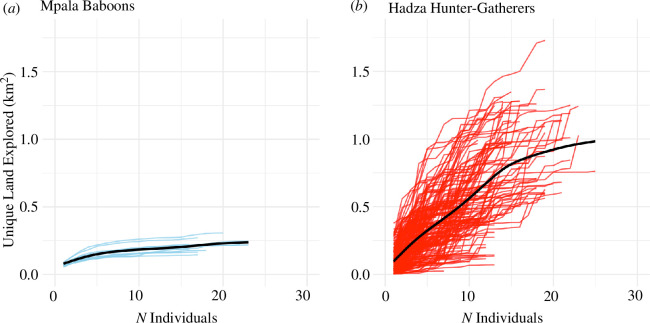
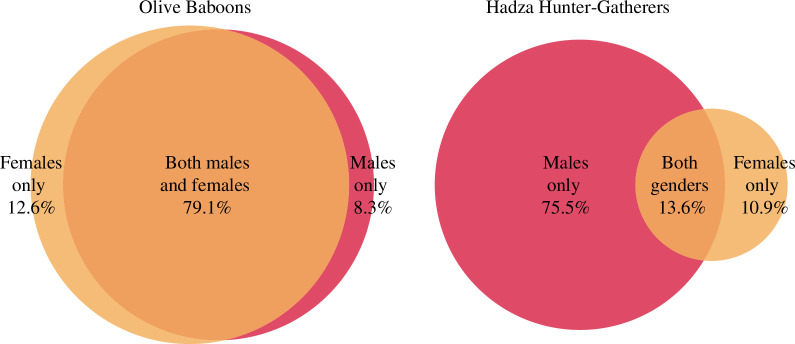
Human evolutionary ecology stands to benefit by integrating theory and methods developed in movement ecology, and in turn, to make contributions to the broader field of movement ecology by leveraging our species' distinct attributes. In this paper, we review data and evolutionary models suggesting that major changes in socio-spatial behaviour accompanied the evolution of language. To illustrate and explore these issues, we present a comparison of GPS measures of the socio-spatial behaviour of Hadza hunter-gatherers of northern Tanzania to those of olive baboons (Papio anubis), a comparatively small-brained primate that is also savanna-adapted. While standard spatial metrics show modest differences, measures of spatial diversity, landscape exploration and spatiotemporal displacement between individuals differ markedly. Groups of Hadza foragers rapidly accumulate a vast, diverse knowledge pool about places and things over the horizon, contrasting with the baboon's narrower and more homogeneous pool of ecological information. The larger and more complex socio-spatial world illustrated by the Hadza is one where heightened cognitive abilities for spatial and episodic memory, navigation, perspective taking and communication about things beyond the here and now all have clear value.This article is part of the theme issue 'The spatial-social interface: a theoretical and empirical integration'.

Keywords: Hadza; displacement; evolution of language; human movement ecology; hunter–gatherers; olive baboon.


Conflict of interest statement

We declare we have no competing interests.

Figures

(a) The path of an adult female olive baboon at Mpala who travelled 10.6 km on 2012−08−12, over the course of 12 h.
Figure 1.
(a) The path of an adult female olive baboon at Mpala who travelled 10.6 km on 12 August 2012, over the course of 12 h. Her path on this day began at the location indicated by the red dot and ended at that shown by the blue dot, only 20 m distant. (b) Proximity between this female and all other group members throughout the day, sampled at 10-min intervals for visual clarity. Each line in (b) represents her proximity to a different group member.
(a) Hadza inter-individual proximities by the hour (n = 102 854 437)
Figure 2.
(a) Hadza inter-individual proximities by hour (n = 102 854 437) and (b) Mpala baboon inter-individual proximities by hour (n = 18 881 268). Please note the large difference in y-axis scales.
Time spent at different distances from each day’s starting point in the Hadza hunter–gatherer and Mpala baboon samples.
Figure 3.
Time spent at different distances from each day’s starting point in the Hadza hunter–gatherer and Mpala baboon samples. The black circles in the centre of each plot encompass 50% of all GPS points, i.e. 50% of all recorded time, of each sample. The white circles encompass 75% of all GPS points, and the blue circles encompass 100% of each sample.
Dyadic measures of similarity and difference in daily landscape use by A) Hadza hunter–gatherers (n = 13 656 dyads) and B) Mpala baboons (n = 2240 dyads).
Figure 4.
Dyadic measures of similarity and difference in daily landscape use by (a) Hadza hunter–gatherers (n = 13 656 dyads) and (b) Mpala baboons (n = 2240 dyads). See §4d for details of how these values were calculated.
The cumulative amount of unique land explored per day, as a function of group size.
Figure 5.
The cumulative amount of unique land explored per day, as a function of group size. Each line represents a unique calendar day, and its slope represents the relationship between the unique land explored and additional group members. The black line represents a generalized additive model of the expected trend, fit to the data using a cubic spline.
Similarity and difference in landscape use, aggregated by gender/sex.
Figure 6.
Similarity and difference in landscape use, aggregated by gender/sex. The Hadza measures are the average values in a study of 12 camps [33].
Co-authors BP and MA collecting GPS data using lightweight Canmore GPS devices.
Figure 7.
Co-authors BP and MA collecting GPS data using lightweight Canmore GPS devices.

Similar articles

Cited by

References

    1. Kaplan H, Hill K, Lancaster J, Hurtado AM. 2000. A theory of human life history evolution: diet, intelligence, and longevity. Evol. Anthropol. 9, 156–185. (10.1002/1520-6505(2000)9:4<156::AID-EVAN5>3.0.CO;2-7) - DOI
    1. Dunbar RIM. 1998. The social brain hypothesis. Evol. Anthropol. 6, 178–190. (10.1002/(SICI)1520-6505(1998)6:5<178::AID-EVAN5>3.0.CO;2-8) - DOI
    1. González-Forero M, Gardner A. 2018. Inference of ecological and social drivers of human brain-size evolution. Nature 557, 554–557. (10.1038/s41586-018-0127-x) - DOI - PubMed
    1. Webber QMR, Albery GF, Farine DR, Pinter‐Wollman N, Sharma N, Spiegel O, Vander Wal E, Manlove K. 2023. Behavioural ecology at the spatial–social interface. Biol. Rev. 98, 868–886. (10.1111/brv.12934) - DOI - PubMed
    1. Boyd R, Richerson PJ, Henrich J. 2011. The cultural niche: why social learning is essential for human adaptation. Proc. Natl Acad. Sci. USA 108, 10918–10925. (10.1073/pnas.1100290108) - DOI - PMC - PubMed