. 2024 Sep 17;96(37):14783-14790.
doi: 10.1021/acs.analchem.4c02108. Epub 2024 Sep 4.

Benchtop IR Imaging of Live Cells: Monitoring the Total Mass of Biomolecules in Single Cells

Affiliations

Benchtop IR Imaging of Live Cells: Monitoring the Total Mass of Biomolecules in Single Cells

Yow-Ren Chang et al. Anal Chem. .

Abstract

Absolute quantity imaging of biomolecules on a single cell level is critical for measurement assurance in biosciences and bioindustries. While infrared (IR) transmission microscopy is a powerful label-free imaging modality capable of chemical quantification, its applicability to hydrated biological samples remains challenging due to the strong IR absorption by water. Traditional IR imaging of hydrated cells relies on powerful light sources, such as synchrotrons, to mitigate the light absorption by water. However, we overcome this challenge by applying a solvent absorption compensation (SAC) technique to a home-built benchtop IR microscope based on an external-cavity quantum cascade laser. SAC-IR microscopy adjusts the incident light using a pair of polarizers to precompensate the IR absorption by water while retaining the full dynamic range. Integrating the IR absorbance over a cell yields the total mass of biomolecules per cell. We monitor the total mass of the biomolecules of live fibroblast cells over 12 h, demonstrating promise for advancing our understanding of the biomolecular processes occurring in live cells on the single-cell level.


Conflict of interest statement

The authors declare no competing financial interest.

Figures
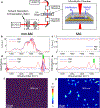
Figure 1.
Figure 1.. Schematic of solvent absorption compensation IR (SAC-IR) microscopy.
(a) Optical system of the SAC-IR microscopy setup. The laser intensity is controlled as a function of wavelength by a pair of rotating and fixed polarizers. EC-QCL: external-cavity quantum cascade laser; RP: rotating polarizer; FP: fixed polarizer; and LN-MCT: liquid nitrogen-cooled mercury-cadmium-telluride detector. The inset illustrates a microfluidic sample chamber consisting of two 1-mm thick CaF2 windows and a 25 μm spacer. One of the CaF2 windows has drilled holes for introducing cells and media. (b,c) Spectra of transmitted light intensity I in a fixed fibroblast cell region (red) and a phosphate buffer saline (PBS) region (blue) without SAC (b) and with SAC (c). The acquisition time for a line spectrum (X,ω) was 5 min. (d,e) Absorbance spectra of a PBS (reference, blue) and a fixed fibroblast cell (red) without SAC (d) and with SAC (e). (f,g) Absorbance images of fixed fibroblast cells, measured at 1650 cm−1 without SAC (f) and with SAC (g).
Figure 2.
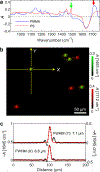
Figure 2.. System performance of SAC-IR microscopy.
Imaging results using a mixture of 5-μm diameter polystyrene (PS) and poly(methyl methacrylate) (PMMA) microparticles in water with a 25 μm spacer. (a) IR spectra of the PS and PMMA microparticles using SAC. (b) Composite image with absorbances at 1493 cm−1 (green) and 1712 cm−1 (red) using SAC. (c) Line scans of the indicated PS particle in panel b.
Figure 3.
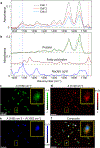
Figure 3.. SAC-IR spectra and images of fixed fibroblast cells.
(a) Line-averaged spectra of three different fixed fibroblast cells crossing the cell centers. (b) IR spectra of bovine serum albumin in water (solid green, rich in α-helix) and β-lactoglobulin in water (dotted green, rich in β-sheet) for protein, and herring DNA in water (blue) for nucleic acid. The absorption spectra of the proteins and DNA solutions were measured with a reference of deionized water. The absorption spectrum of glycerol trioctanoate in CCl4 and CS2 (red) for fatty acid ester was downloaded from the NIST Chemistry WebBook (webbook.nist.gov). All absorption spectra were scaled to the concentration of 10 mg/mL. (ce) Absorbance images at wavenumbers representative of (c) protein at 1656 cm−1, (d) fatty acid at 1748 cm−1, and (e) nucleic acid at 1085 cm−1 and 1053 cm−1. (f) Composite image of panels ce. The vertical dashed lines in a,b indicate the wavenumbers used to construct the images of panels ce.
Figure 4.
Figure 4.. Comparison of SAC-IR images of fixed and live fibroblast cells.
(a,b) IR images of fixed and live cells at 1650 cm−1. (c) Scatter plots of protein mass per cell for 74 fixed and 94 live cells. The median (mean) values are 105 pg (126 pg) and 122 pg (131 pg) for fixed and live cells, respectively. The boxes indicate the 25% and 75%, and the horizontal lines indicate the median values.
Figure 5.
Figure 5.. Live fibroblast SAC-IR images.
(a) Three-color SAC-IR images acquired every twelve minutes for twelve hours. Yellow color represents absorbance associated with protein at 1656 cm−1; magenta for fatty acid at 1745 cm−1; and cyan for nucleic acid at 1230 cm−1. (bd) Enlarged images of the dividing cells (b and c) and the non-dividing cell (d), indicated in panel a. The centers of mass absorbance of the marked cells are plotted as time traces. (eg) Tracking total absorbance per cell (A×S) of the cells in panel (bd), respectively, measured at the three different wavenumbers. In (e), the red and black solid lines after 10.8 h are the A×S values of the daughter cells.

Similar articles

Cited by

References

    1. Poulhazan A; Dickwella Widanage MC; Muszyński A; Arnold AA; Warschawski DE; Azadi P; Marcotte I; Wang T Identification and Quantification of Glycans in Whole Cells: Architecture of Microalgal Polysaccharides Described by Solid-State Nuclear Magnetic Resonance. J Am Chem Soc 2021, 143 (46), 19374–19388. 10.1021/JACS.1C07429. - DOI - PMC - PubMed
    1. Ellis RJ Macromolecular Crowding: An Important but Neglected Aspect of the Intracellular Environment. Curr Opin Struct Biol 2001, 11 (1), 114–119. 10.1016/S0959-440X(00)00172-X. - DOI - PubMed
    1. Wang Y; Sarkar M; Smith AE; Krois AS; Pielak GJ Macromolecular Crowding and Protein Stability. J Am Chem Soc 2012, 134 (40), 16614–16618. 10.1021/JA305300M. - DOI - PubMed
    1. Ren J; Andrikopoulos N; Velonia K; Tang H; Cai R; Ding F; Ke PC; Chen C Chemical and Biophysical Signatures of the Protein Corona in Nanomedicine. J Am Chem Soc 2022, 144 (21), 9184–9205. 10.1021/JACS.2C02277. - DOI - PubMed
    1. Vallabh SM; Nobuhara CK; Llorens F; Zerr I; Parchi P; Capellari S; Kuhn E; Klickstein J; Safar JG; Nery FC; Swoboda KJ; Geschwind MD; Zetterberg H; Arnold SE; Minikel EV; Schreiber SL Prion Protein Quantification in Human Cerebrospinal Fluid as a Tool for Prion Disease Drug Development. Proc Natl Acad Sci U S A 2019, 116 (16), 7793–7798. 10.1073/PNAS.1901947116. - DOI - PMC - PubMed

Publication types

LinkOut - more resources