

Ultrasound Probe Pressure Affects Aortic Wall Stiffness: A Patient-Specific Computational Study in Abdominal Aortic Aneurysms
- PMID: 39230788
- PMCID: PMC11782392
- DOI: 10.1007/s10439-024-03608-8
Ultrasound Probe Pressure Affects Aortic Wall Stiffness: A Patient-Specific Computational Study in Abdominal Aortic Aneurysms
Abstract
Purpose: Ultrasound imaging is key in the management of patients with an abdominal aortic aneurysm (AAA). It was recently shown that the cyclic diameter variations between diastole and systole, which can be quantified with US imaging, increase significantly with the strength of the applied probe pressure on the patient's abdomen. The goal of this study is to investigate this effect more thoroughly.
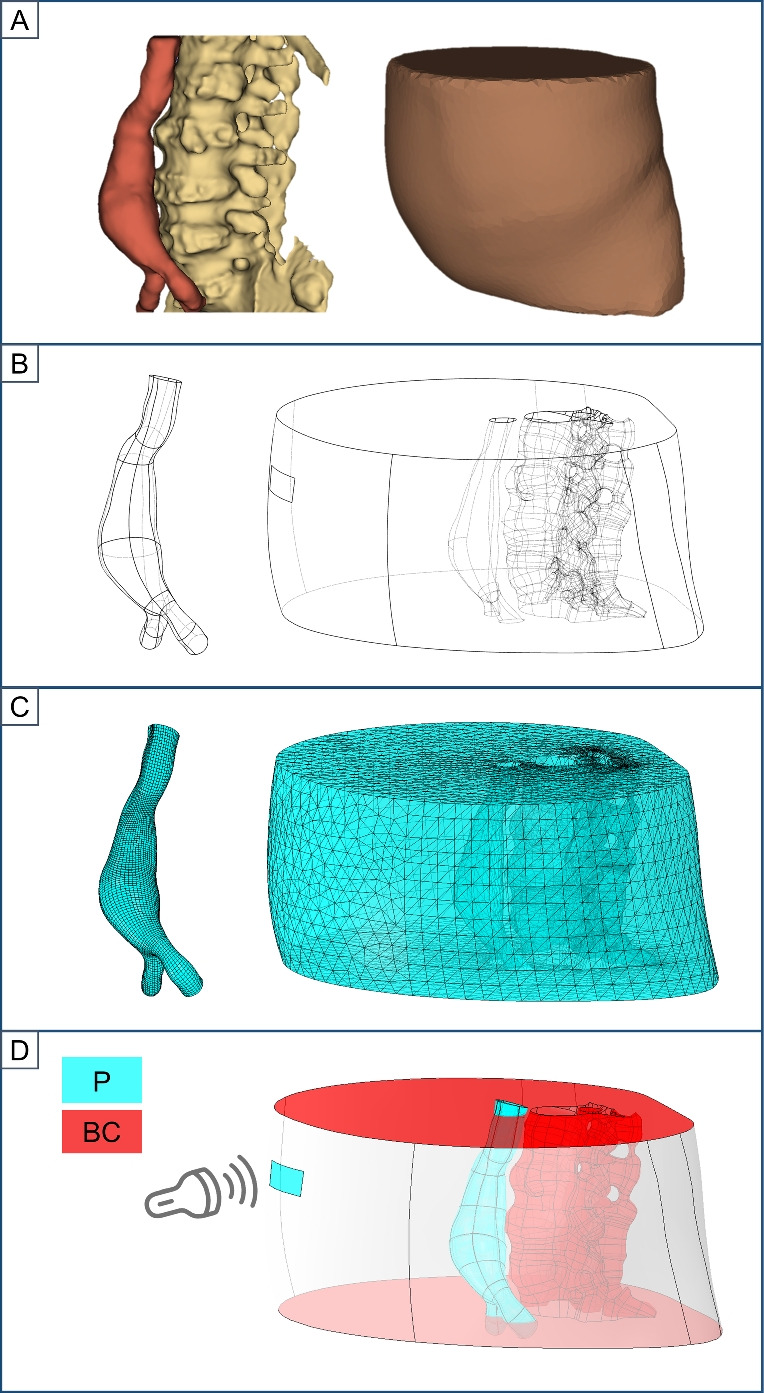
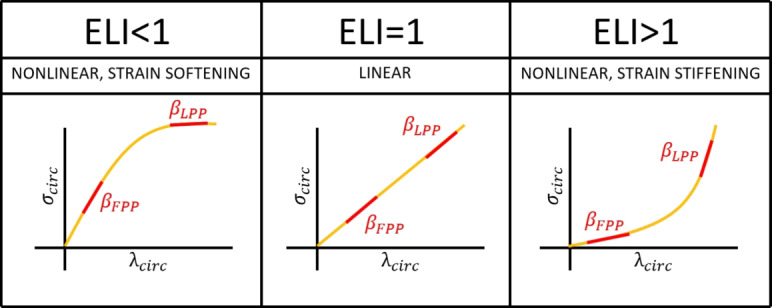
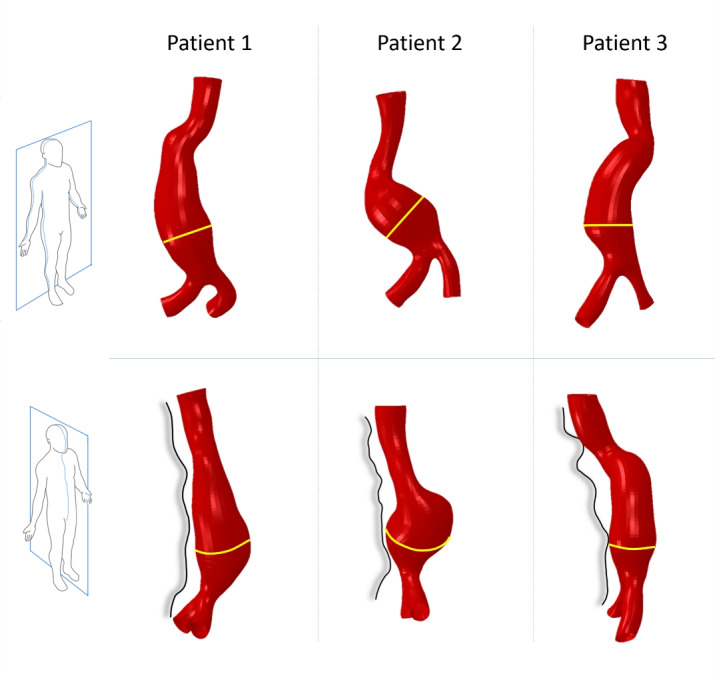
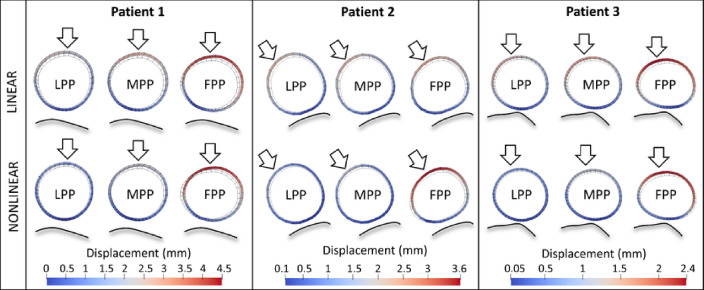
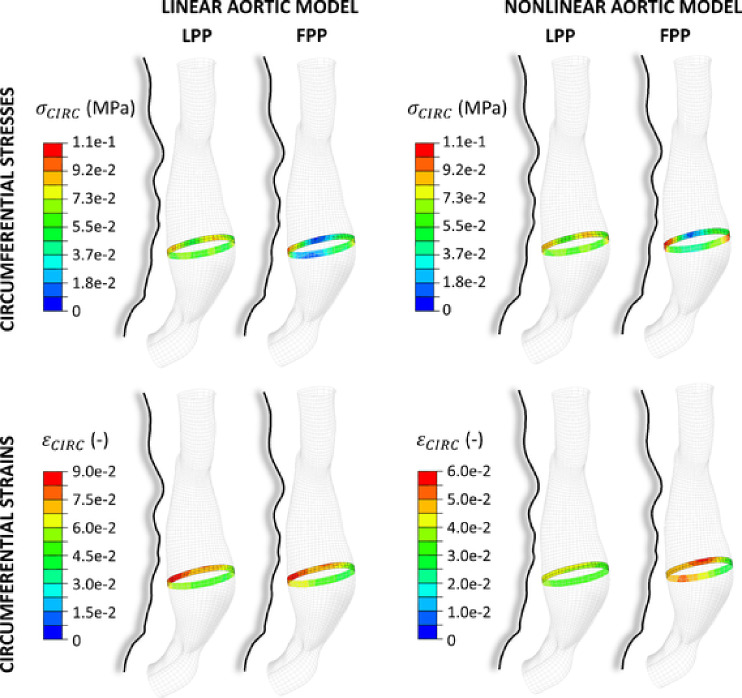
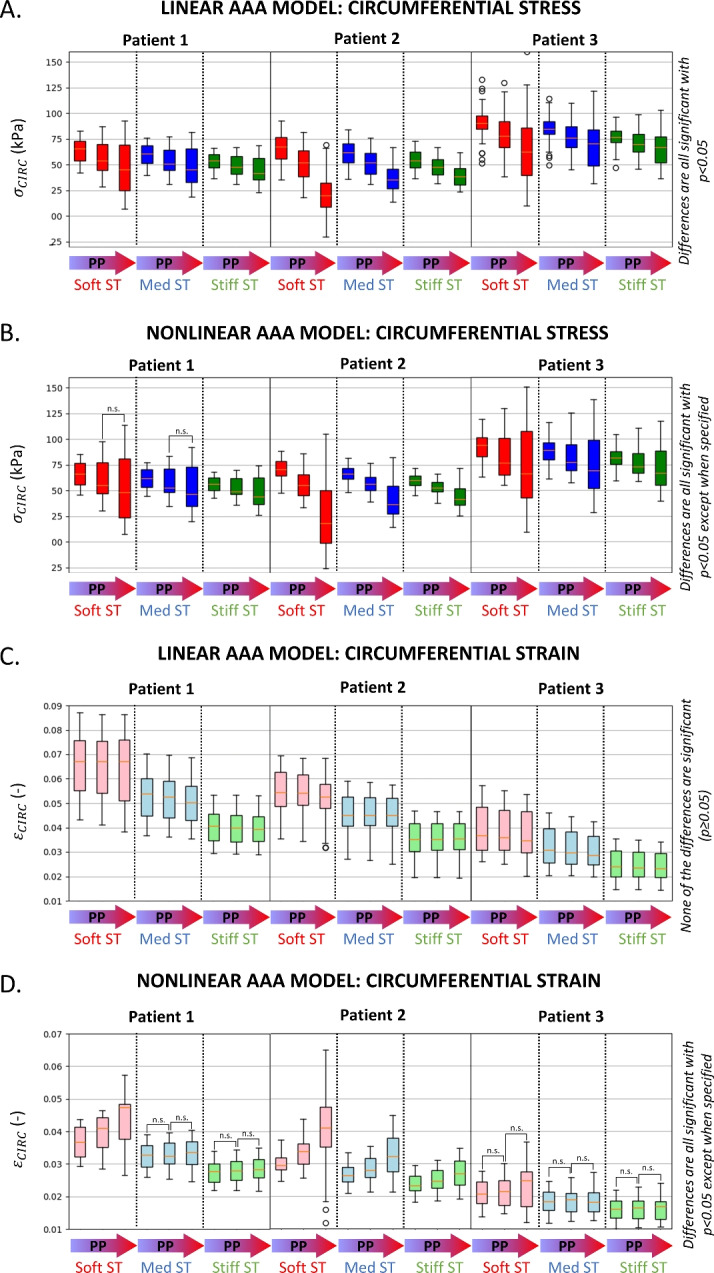
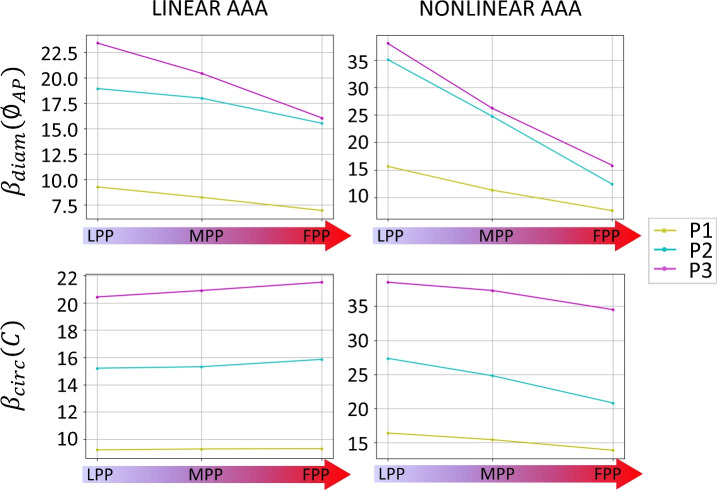
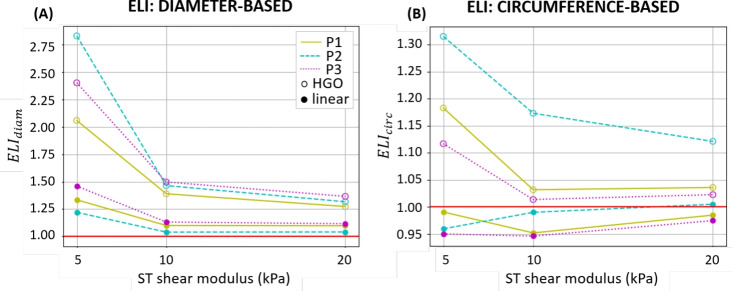
Methods: With finite-element modeling, pulsatile blood pressure and probe pressure are simulated in three patient-specific geometries. Two distinct models for the aortic wall were simulated: a nonlinear hyperelastic and a linear elastic model. In addition, varying stiffness was considered for the surrounding tissues. The effect of light, moderate, and firm probe pressure was quantified on the stresses and strains in the aortic wall, and on two in vivo stiffness measures. In addition, the Elasticity Loss Index was proposed to quantify the change in stiffness due to probe pressure.
Results: Firm probe pressure decreased the measured aortic stiffness, and material stiffness was affected only when the wall was modeled as nonlinear, suggesting a shift in the stress-strain curve. In addition, stiffer surrounding tissues and a more elongated aneurysm sac decreased the responsiveness to the probe pressure.
Conclusion: The effect of probe pressure on the AAA wall stiffness was clarified. In particular, the AAA wall nonlinear behavior was found to be of primary importance in determining the probe pressure response. Thus, further work will intend to make use of this novel finding in a clinical context.
Keywords: Abdominal aortic aneurysm; Finite-element method; Noninvasive mechanical characterization; Ultrasound probe pressure.
© 2024. The Author(s).
Conflict of interest statement
Declarations. Conflict of interest: M.I.B. and L.R. were employed by Philips Research France during the study conception and manuscript writing. The authors have no relevant financial or non-financial interests to disclose.
Figures
Similar articles
-
Aortic Wall Biomechanical Assessment Depends on Ultrasound Probe Pressure: In-Vivo and In-Silico Insights.IEEE Trans Biomed Eng. 2025 Jul;72(7):2189-2195. doi: 10.1109/TBME.2025.3537278. IEEE Trans Biomed Eng. 2025. PMID: 40031242
-
Quantification of aortic stiffness and wall stress in healthy volunteers and abdominal aortic aneurysm patients using time-resolved 3D ultrasound: a comparison study.Eur Heart J Cardiovasc Imaging. 2019 Feb 1;20(2):185-191. doi: 10.1093/ehjci/jey051. Eur Heart J Cardiovasc Imaging. 2019. PMID: 29618036
-
Patient Specific Wall Stress Analysis and Mechanical Characterization of Abdominal Aortic Aneurysms Using 4D Ultrasound.Eur J Vasc Endovasc Surg. 2016 Nov;52(5):635-642. doi: 10.1016/j.ejvs.2016.07.088. Epub 2016 Sep 27. Eur J Vasc Endovasc Surg. 2016. PMID: 27665991
-
A Comprehensive Review on Computational Analysis, Research Advances, and Major Findings on Abdominal Aortic Aneurysms for the Years 2021 to 2023.Ann Vasc Surg. 2025 Jan;110(Pt A):63-81. doi: 10.1016/j.avsg.2024.07.111. Epub 2024 Sep 28. Ann Vasc Surg. 2025. PMID: 39343357 Review.
-
Advancements in identifying biomechanical determinants for abdominal aortic aneurysm rupture.Vascular. 2015 Feb;23(1):65-77. doi: 10.1177/1708538114532084. Epub 2014 Apr 22. Vascular. 2015. PMID: 24757027 Review.
Cited by
-
New Trends of Personalized Medicine in the Management of Abdominal Aortic Aneurysm: A Review.J Pers Med. 2024 Dec 10;14(12):1148. doi: 10.3390/jpm14121148. J Pers Med. 2024. PMID: 39728062 Free PMC article. Review.
References
-
- Acher, C., C. Acher, M. C. C. Ramirez, and M. Wynn. Operative mortality and morbidity in ruptured abdominal aortic aneurysms in the endovascular age. Ann. Vasc. Surg. 66:70–76, 2020. - PubMed
-
- Moll, F. L., J. T. Powell, G. Fraedrich, F. Verzini, S. Haulon, M. Waltham, J. A. Herwaarden, P. J. Holt, J. W. Keulen, B. Rantner, et al. Management of abdominal aortic aneurysms clinical practice guidelines of the European society for vascular surgery. Eur. J. Vasc. Endovasc. Surg. 41:1–58, 2011. - PubMed
-
- Polzer, S., T. C. Gasser, R. Vlachovský, L. Kubíček, L. Lambert, V. Man, K. Novák, M. Slažanský, J. Burša, and R. Staffa. Biomechanical indices are more sensitive than diameter in predicting rupture of asymptomatic abdominal aortic aneurysms. J. Vasc. Surg. 71(2):617–6266, 2020. 10.1016/j.jvs.2019.03.051. - PubMed
MeSH terms
Grants and funding
LinkOut - more resources
Full Text Sources
