. 2024 Sep 18;24(37):11476-11481.
doi: 10.1021/acs.nanolett.4c02697. Epub 2024 Sep 4.

Electrical Control of Magnetic Resonance in Phase Change Materials

Affiliations

Electrical Control of Magnetic Resonance in Phase Change Materials

Tian-Yue Chen et al. Nano Lett. .

Abstract

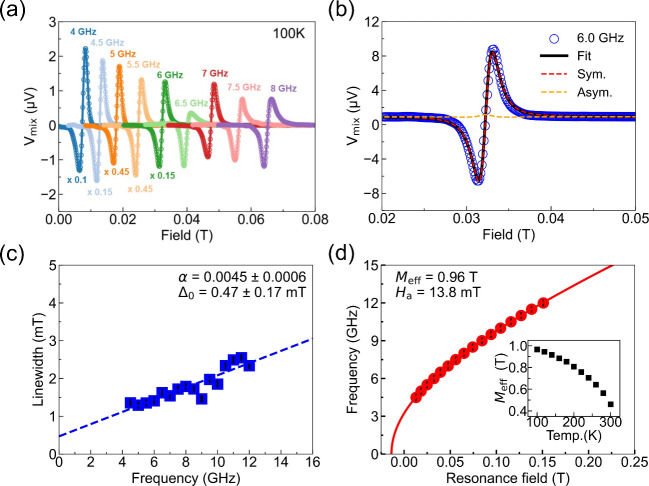
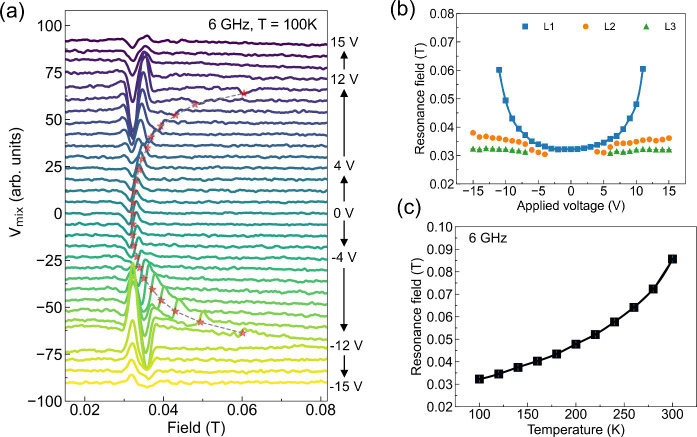
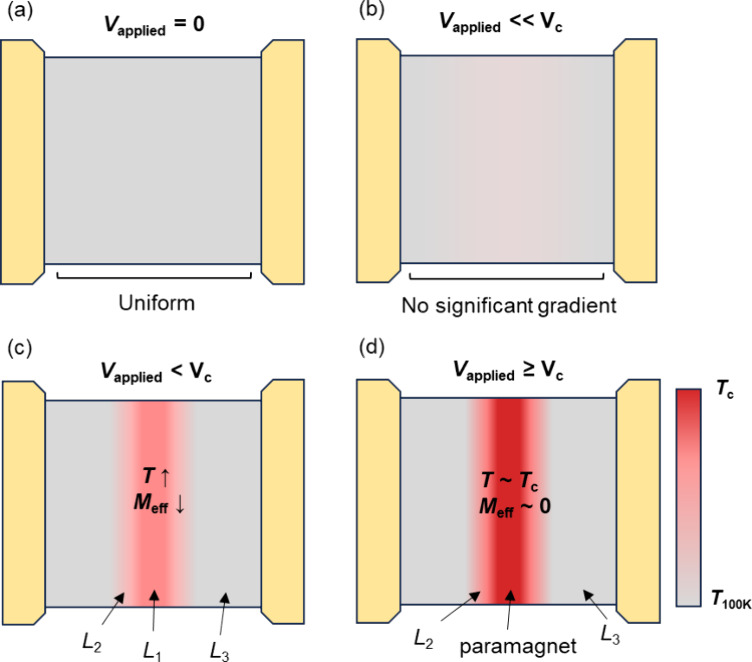
Metal-insulator transitions (MITs) in resistive switching materials can be triggered by an electric stimulus that produces significant changes in the electrical response. When these phases have distinct magnetic characteristics, dramatic changes in the spin excitations are also expected. The transition metal oxide La0.7Sr0.3MnO3 (LSMO) is a ferromagnetic metal at low temperatures and a paramagnetic insulator above room temperature. When LSMO is in its metallic phase, a critical electrical bias has been shown to lead to an MIT that results in the formation of a paramagnetic resistive barrier transverse to the applied electric field. Using spin-transfer ferromagnetic resonance spectroscopy, we show that even for electrical biases less than the critical value that triggers the MIT, there is magnetic phase separation, with the spin-excitation resonances varying systematically with applied bias. Therefore, voltage-triggered MITs in LSMO can alter magnetic resonance characteristics, offering an effective method for tuning synaptic weights in neuromorphic circuits.

Keywords: metal−insulator transition (MIT); spin-torque ferromagnetic resonance; synaptic weights tuning; transition metal oxide; voltage-triggered MIT.


Conflict of interest statement

The authors declare no competing financial interest.

Figures

Figure 1
Figure 1
(a) Illustration of measurement setup. The LSMO device has a lateral dimension of 10 μm by 10 μm. (b) LSMO device resistance as a function of the temperature. (c) IV curve measurements at various temperatures. Vc indicates the critical voltage at 100 K.
Figure 2
Figure 2
(a) ST-FMR resonance response at 100 K, for frequencies from 4 to 8 GHz at zero DC bias voltage. Several curves have been scaled as indicated. (b) The 6 GHz resonance line fit to the derivative of Lorentzian functions characterizing the symmetric (red) and asymmetric components (yellow) response. (c) ST-FMR line width as a function of frequency with a linear fit that enables determination of the damping constant α and inhomogeneous line width ΔH0. (d) The resonant field as a function of frequency. Inset: effective magnetization as a function of temperature. The error bars for the line widths and the resonance fields are indicated as black lines and are within the size of the data points.
Figure 3
Figure 3
(a) ST-FMR signal as a function of bias voltage from −15 to +15 V at 6 GHz and 100 K. Here, Vmix represents the signal collected by the lock-in amplifier. The data has been shifted vertically for clarity. (b) Summary of resonant fields L1, L2, and L3 as a function of the applied bias voltage at 6 GHz and 100 K. L1, L2, and L3 represent the resonance peaks in order of appearance as the applied voltage changes (details in Supporting Information S5). (c) Resonance field at 6 GHz as a function of temperature at zero bias voltage. The error bars for the resonance fields are very small and fall within the size of the data points.
Figure 4
Figure 4
Schematic illustration of the proposed voltage-induced magnetic phase separation mechanism. (a) V = 0 V. The whole sample has a uniform temperature and effective magnetization. (b) VVc. The entire sample heats but without a significant temperature gradient. (c) V < Vc. The center area is heated up by the applied voltage and forms a hot region with lower effective magnetization, whereas the side areas show a relatively lower constant temperature. (d) VVc. When the device region reaches the critical temperature, a paramagnetic resistive barrier forms where the effective magnetization drops to zero.

References

    1. Valle J. d.; Salev P.; Gariglio S.; Kalcheim Y.; Schuller I. K.; Triscone J.-M. Generation of Tunable Stochastic Sequences Using the Insulator-Metal Transition. Nano Lett. 2022, 22 (3), 1251–1256. 10.1021/acs.nanolett.1c04404. - DOI - PubMed
    1. Ghazikhanian N.; del Valle J.; Salev P.; El Hage R.; Kalcheim Y.; Adda C.; Schuller I. K. Resistive switching localization by selective focused ion beam irradiation. Appl. Phys. Lett. 2023, 123 (12), 123505.10.1063/5.0151823. - DOI
    1. Schofield P.; Bradicich A.; Gurrola R. M.; Zhang Y.; Brown T. D.; Pharr M.; Shamberger P. J.; Banerjee S. Harnessing the Metal-Insulator Transition of VO2 in Neuromorphic Computing. Adv. Mater. 2023, 35 (37), 2205294.10.1002/adma.202205294. - DOI - PubMed
    1. Ignatov M.; Ziegler M.; Hansen M.; Petraru A.; Kohlstedt H. A memristive spiking neuron with firing rate coding. Frontiers in Neuroscience 2015, 9, 376.10.3389/fnins.2015.00376. - DOI - PMC - PubMed
    1. Yi W.; Tsang K. K.; Lam S. K.; Bai X.; Crowell J. A.; Flores E. A. Biological plausibility and stochasticity in scalable VO2 active memristor neurons. Nat. Commun. 2018, 9 (1), 4661.10.1038/s41467-018-07052-w. - DOI - PMC - PubMed