

Concurrent disease burden from multiple infectious diseases and the influence of social determinants in the contiguous United States
- PMID: 39231143
- PMCID: PMC11373817
- DOI: 10.1371/journal.pone.0293431
Concurrent disease burden from multiple infectious diseases and the influence of social determinants in the contiguous United States
Abstract
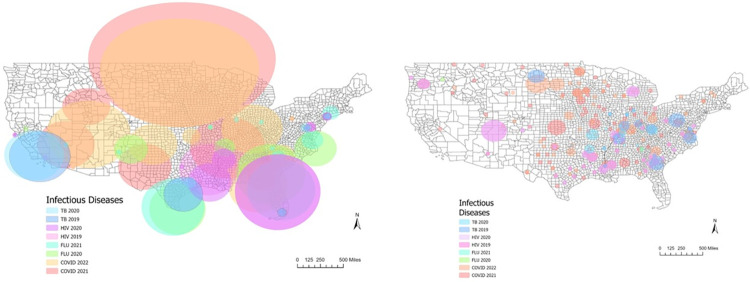
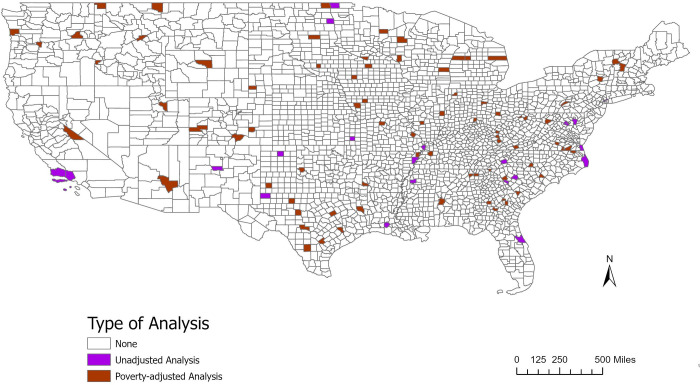
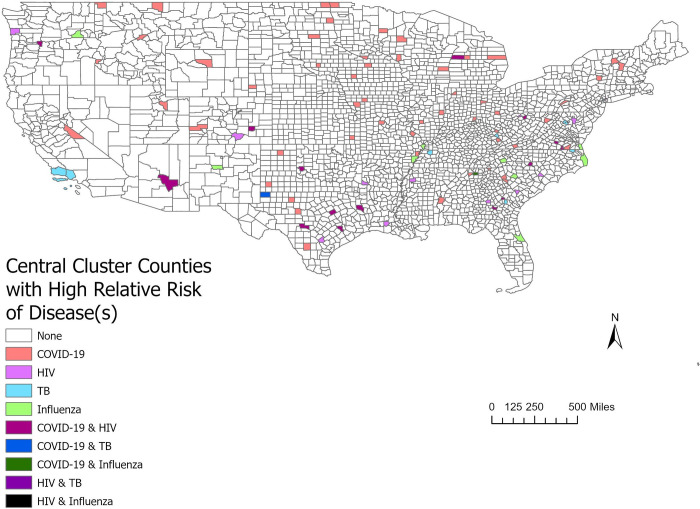
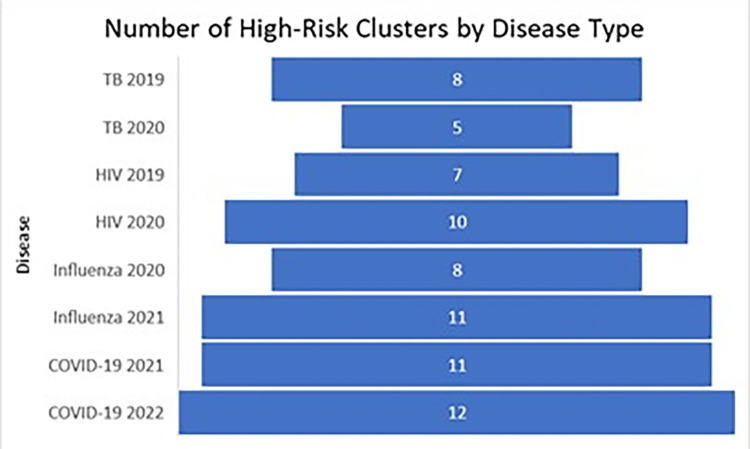
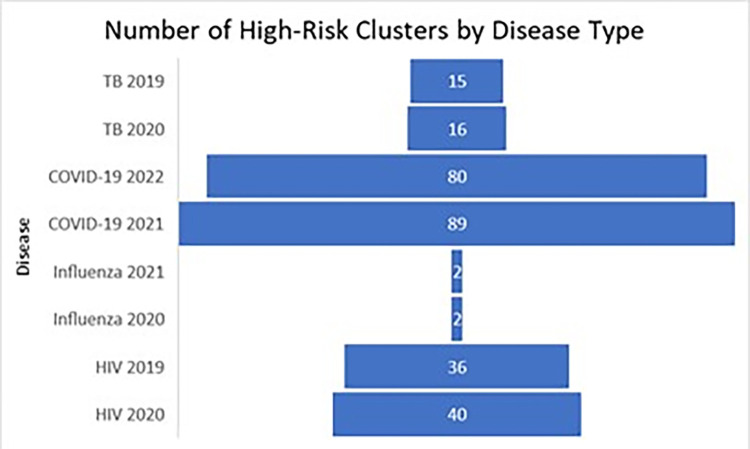
Social determinants of health are known to underly excessive burden from infectious diseases. However, it is unclear if social determinants are strong enough drivers to cause repeated infectious disease clusters in the same location. When infectious diseases are known to co-occur, such as in the co-occurrence of HIV and TB, it is also unknown how much social determinants of health can shift or intensify the co-occurrence. We collected available data on COVID-19, HIV, influenza, and TB by county in the United States from 2019-2022. We applied the Kulldorff scan statistic to examine the relative risk of each disease by year depending on the data available. Additional analyses using the percent of the county that is below the US poverty level as a covariate were conducted to examine how much clustering is associated with poverty levels. There were three counties identified at the centers of clusters in both the adjusted and unadjusted analysis. In the poverty-adjusted analysis, we found a general shift of infectious disease burden from urban to rural clusters.
Copyright: © 2024 Blake et al. This is an open access article distributed under the terms of the Creative Commons Attribution License, which permits unrestricted use, distribution, and reproduction in any medium, provided the original author and source are credited.
Conflict of interest statement
The authors have declared that no competing interests exist.
Figures
References
-
- Mamelund S-E, Dimka J. Social inequalities in infectious diseases. SAGE Publications Sage UK: London, England; 2021. p. 675–80. - PubMed
-
- Dheda K, Perumal T, Moultrie H, Perumal R, Esmail A, Scott AJ, et al. The intersecting pandemics of tuberculosis and COVID-19: population-level and patient-level impact, clinical presentation, and corrective interventions. The Lancet Respiratory Medicine. 2022. doi: 10.1016/S2213-2600(22)00092-3 - DOI - PMC - PubMed
-
- Whitehead M, Taylor-Robinson D, Barr B. Poverty, health, and covid-19. British Medical Journal Publishing Group; 2021. - PubMed
MeSH terms
LinkOut - more resources
Full Text Sources
Medical
