. 2024 Sep 10;121(37):e2406854121.
doi: 10.1073/pnas.2406854121. Epub 2024 Sep 4.

ERRα and ERRγ coordinate expression of genes associated with Alzheimer's disease, inhibiting DKK1 to suppress tau phosphorylation

Affiliations

ERRα and ERRγ coordinate expression of genes associated with Alzheimer's disease, inhibiting DKK1 to suppress tau phosphorylation

Kaoru Sato et al. Proc Natl Acad Sci U S A. .

Abstract

Alzheimer's disease (AD) is a prevalent neurodegenerative disease characterized by cognitive decline and learning/memory impairment associated with neuronal cell loss. Estrogen-related receptor α (ERRα) and ERRγ, which are highly expressed in the brain, have emerged as potential AD regulators, with unelucidated underlying mechanisms. Here, we identified genome-wide binding sites for ERRα and ERRγ in human neuronal cells. They commonly target a subset of genes associated with neurodegenerative diseases, including AD. Notably, Dickkopf-1 (DKK1), a Wnt signaling pathway antagonist, was transcriptionally repressed by both ERRα and ERRγ in human neuronal cells and brain. ERRα and ERRγ repress RNA polymerase II (RNAP II) accessibility at the DKK1 promoter by modulating a specific active histone modification, histone H3 lysine acetylation (H3K9ac), with the potential contribution of their corepressor. This transcriptional repression maintains Wnt signaling activity, preventing tau phosphorylation and promoting a healthy neuronal state in the context of AD.

Keywords: Alzheimer’s disease; DKK1; PROX1; Wnt signaling pathway; estrogen-related receptor.


Conflict of interest statement

Competing interests statement:The authors declare no competing interest.

Figures

Fig. 1.
Fig. 1.
Genome-wide chromatin binding characteristics of ERRα and ERRγ in SH-SY5Y cells. (A) Density profile of ChIP-seq peaks for ERRα and ERRγ over the indicated genes. All ChIP-seq experiments were performed in duplicate, as indicated by rep1 and rep2. Black colored bars indicate genomic regions with ChIP-seq peaks. Pairs of arrowheads indicate primer pairs used in ChIP-qPCR experiments. (B) Bar graphs showing the percent input (% Input) in ChIP-qPCR experiments. n.i. indicates nonimmune IgG used as IP negative control. Error bars represent the SE of three independent experiments. Statistical significance was assessed by Student's t test. *P < 0.05. (C) Sequence logos showing motifs enriched within the ChIP-seq peaks for ERRα and ERRγ. The number of motif sites within the total ChIP-seq peaks is shown. (D and E) Pie chart showing the genomic annotation of ChIP-seq peaks for ERRα (D) and ERRγ (E).
Fig. 2.
Fig. 2.
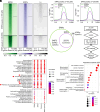
Target genes of ERRα and ERRγ were associated with neurodegenerative diseases, including AD. (A and B) Heatmaps (A) and metaplots (B) of ChIP-seq signals for ERRα and ERRγ around the peaks. n.i. indicates nonimmune IgG, which was used as IP negative control and showed less enrichment. L and R indicate the ends of the ChIP-seq peaks. (C) Venn diagram showing the overlapped ChIP-seq peaks between ERRα and ERRγ in SH-SY5Y cells. (D) Diagram of the ERRα and ERRγ ChIP-seq data analysis workflow. (E) Bubble chart of KEGG pathway enrichment analysis for ERRα and ERRγ target genes. Arrows indicate pathways of neurodegenerative diseases, including AD. No specific pathway was enriched in association with ERRγ-specific target genes. (F) Bubble chart of GO enrichment analysis for AD-associated genes commonly targeted by ERRα and ERRγ.
Fig. 3.
Fig. 3.
ERRα and ERRγ repressed the transcription of DKK1. (AC) RNA-seq analysis was performed to detect genes under the control of ERRα and ERRγ. Scatter plot depicting RNA abundance in ERRα-depleted (A), ERRγ-depleted (B), and double KD (C) SH-SY5Y cells. Red, blue, and gray dots indicate up-regulated (>twofold change, >1 TPM in KD), down-regulated (<0.5-fold change, >1 TPM in siCtrl), and unchanged genes after KD, respectively. siCtrl indicates negative control siRNA treatment. (D) Diagram showing intersection analysis performed with ERRα and ERRγ ChIP-seq data and double KD RNA-seq data. The indicated databases were used to further explore key regulatory genes targeted by ERRα and ERRγ. (E) Normalized density profiles of RNA-seq for indicated KDs and ChIP-seq for ERRα and ERRγ in a 10 kb region on chromosome 10 with the DKK1 gene. The number of mapped reads was normalized to bins per million mapped reads (BPM). All ChIP-seq experiments were performed in duplicate, as indicated by rep1 and rep2. Black colored bars indicate genomic regions with ChIP-seq peaks. Pair of arrowheads indicates primer pairs used in ChIP-qPCR experiments. (F) Bar graph showing the percent input (% Input) in the ChIP-qPCR experiments. (G) Bar graph showing the percent input (% Input) in ChIP-qPCR experiments in the human brain. n.i. indicates nonimmune IgG used as IP negative control. Error bars represent the SE of three independent experiments. Statistical significance was assessed by Student's t test. *P < 0.05, **P < 0.01.
Fig. 4.
Fig. 4.
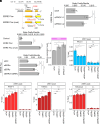
ERRα and ERRγ activate the Wnt signaling pathway through transcriptional repression of DKK1. (A) Bar graph depicting TPM scores of DKK1 upon depletion of the indicated genes in SH-SY5Y cells. siCtrl indicates control KD. (B) Bar graph depicting changes in RNA levels of DKK1 determined by RT-qPCR upon depletion of the indicated genes in SH-SY5Y cells. Relative expression levels were normalized to GAPDH. (C and D) Western blotting analysis (C) and a bar graph (D) showing changes in protein levels of DKK1 upon depletion of the indicated genes in SH-SY5Y cells. β-Actin was used as a loading control to normalize the signal intensity of DKK1. (E) Bar graph depicting changes in RNA levels of DKK1 determined by RT-qPCR upon depletion of the indicated genes in human neuronal stem cells. (F) Bar graphs depicting relative TOPflash activity normalized to Renilla luciferase activity after depletion of the indicated genes (TOPflash WT). The TOPflash mutant with mutations in the TCF binding sites was used as a negative control. (G and H) Western blotting analysis (G) and a bar graph (H) showing changes in protein levels of β-Cat upon overexpression of the indicated genes in SH-SY5Y cells. β-Actin was used as a loading control to normalize the signal intensity of β-Cat. (I and J) Western blotting analysis (I) and a bar graph (J) showing changes in phosphorylated protein levels of β-Cat (Phospho-β-Cat) upon overexpression of the indicated genes in SH-SY5Y cells. β-Cat was used as a loading control to normalize the signal intensity of phospho-β-Cat. (K and L) Western blotting analysis (K) and a bar graph (L) showing changes in phosphorylated protein levels of tau (P-tau, AT8) upon overexpression of the indicated genes in SH-SY5Y cells. Total tau (tau, TAU-5) was detected as a loading control and used to normalize the signal intensity of P-tau. Error bars represent the SE of three independent experiments. Statistical significance was assessed by Student's t test. *P < 0.05, **P < 0.01, ***P < 0.001, ****P < 0.0001. (M) Western blotting analysis of the indicated proteins in AD brains (n = 5). Ctrl denotes healthy control brains (n = 5). (N) Box plot showing signal intensities of the indicated proteins determined by western blotting in AD and healthy control (Ctrl) brains. (O) Scatter plots showing the correlation of signal intensities between P-tau (AT8) and ERRα in AD brain samples. Statistical significance was assessed by the Wilcoxon rank sum test. **P < 0.01. (P) Box plot showing changes in DKK1 RNA levels determined by RT-qPCR in AD brains (n = 8). Ctrl denotes healthy control brains (n = 8). Statistical significance was assessed by the Wilcoxon rank sum test. **P < 0.01.
Fig. 5.
Fig. 5.
PROX1, together with ERRα and ERRγ, are the most likely corepressor candidate to repress DKK1 expression. (A) Schematic representation of firefly luciferase reporter constructs containing the DKK1 promoter with either wild-type (ERRE Fluc) or mutant (mut) ERRE sequence. (B) Bar graph depicting the DKK1 promoter activity with and without mutation of ERRE determined by a dual-luciferase assay in SH-SY5Y cells. (C) Bar graph depicting changes in DKK1 promoter activity determined by dual-luciferase assay upon depletion of the indicated genes in SH-SY5Y cells. (D) Bar graph depicting changes in DKK1 promoter activity determined by dual-luciferase assay upon depletion of the indicated genes in SH-SY5Y cells. (E) Bar graph depicting changes in the RNA levels of DKK1 determined by RT-qPCR upon depletion of PROX1 in SH-SY5Y cells. (FH) Bar graph depicting changes in the RNAP II (F), H3K9ac (G), and H3K4me3 levels (H) at the DKK1 promoter determined by ChIP-qPCR analysis upon depletion of the indicated genes in SH-SY5Y cells. (I) Bar graph depicting changes in the PROX1 levels at the DKK1 promoter determined by ChIP-qPCR analysis upon depletion of the indicated genes in SH-SY5Y cells. n.i. indicates nonimmune IgG used as IP negative control. Error bars represent the SE of three independent experiments. Statistical significance was assessed by Student's t test. ns: not significant, *P < 0.05, **P < 0.01, ***P < 0.001, ****P < 0.0001.
Fig. 6.
Fig. 6.
Model for ERRα- and ERRγ-mediated repression of DKK1 transcription in human neuronal cells. Under normal conditions (Left panel), ERRα and ERRγ, together with PROX1, bind to the ERRE at the DKK1 locus, leading to decreased H3K9ac levels, repression of RNAP II accessibility to the promoter, and dampening of transcription. Upon loss of ERRα and ERRγ (Right panel), H3K9ac levels were increased and RNAP II gained access to the DKK1 promoter. Increased DKK1 protein levels down-regulate the activity of the Wnt signaling pathway, which impairs β-Cat-mediated transcription of target genes and also mediates phosphorylation of tau protein.

Similar articles

Cited by

References

    1. Knopman D. S., et al. , Alzheimer disease. Nat. Rev. Dis. Primers 7, 33 (2021). - PMC - PubMed
    1. Long J. M., Holtzman D. M., Alzheimer disease: An update on pathobiology and treatment strategies. Cell 179, 312–339 (2019). - PMC - PubMed
    1. Hardy J., Selkoe D. J., The amyloid hypothesis of Alzheimer’s disease: Progress and problems on the road to therapeutics. Science 297, 353–356 (2002). - PubMed
    1. Sato K., Takayama K. I., Hashimoto M., Inoue S., Transcriptional and post-transcriptional regulations of amyloid-β precursor protein (APP) mRNA. Front. Aging 2, 721579 (2021). - PMC - PubMed
    1. Sato K., Takayama K. I., Inoue S., Role of piRNA biogenesis and its neuronal function in the development of neurodegenerative diseases. Front Aging Neurosci. 15, 1157818 (2023). - PMC - PubMed

MeSH terms