. 2024 Sep 6;10(36):eadn3470.
doi: 10.1126/sciadv.adn3470. Epub 2024 Sep 4.

Effector memory-type regulatory T cells display phenotypic and functional instability

Affiliations

Effector memory-type regulatory T cells display phenotypic and functional instability

Désirée Jacqueline Wendering et al. Sci Adv. .

Abstract

Regulatory T cells (Treg cells) hold promise for sustainable therapy of immune disorders. Recent advancements in chimeric antigen receptor development and genome editing aim to enhance the specificity and function of Treg cells. However, impurities and functional instability pose challenges for the development of safe gene-edited Treg cell products. Here, we examined different Treg cell subsets regarding their fate, epigenomic stability, transcriptomes, T cell receptor repertoires, and function ex vivo and after manufacturing. Each Treg cell subset displayed distinct features, including lineage stability, epigenomics, surface markers, T cell receptor diversity, and transcriptomics. Earlier-differentiated memory Treg cell populations, including a hitherto unidentified naïve-like memory Treg cell subset, outperformed late-differentiated effector memory-like Treg cells in regulatory function, proliferative capacity, and epigenomic stability. High yields of stable, functional Treg cell products could be achieved by depleting the small effector memory-like Treg cell subset before manufacturing. Considering Treg cell subset composition appears critical to maintain lineage stability in the final cell product.


Figures

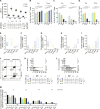
Fig. 1.
Fig. 1.. Composition of subsets defining T cell differentiation stages suggests coherence in memory formation between bulk CD4+ T cells and Treg cells.
(A) Gating strategy for defining conventional CD4+ T cells and CD4+CD25+FoxP3+ Treg cells from PBMCs. Illustrated are density plots of flow cytometry data of one representative donor [fluorescence minus one (FMO) controls shown in fig. S1]. SSC-A, Side Scatter Area; FSC-A, Forward Scatter Area; FSC-H, Forward Scatter Height. (B) Summary of ex vivo investigation of defining conventional CD4+ T cells and Treg cell subset distribution of freshly isolated PBMCs based on flow cytometry (A). Statistical analysis for differences between cell subsets by two-way analysis of variance (ANOVA) with Holm-Sidak testing for multiple comparisons is shown. n = 53. Black lines in violin plots show the median. *P ≤ 0.05; ****P ≤ 0.0001. ns, not significant. Scatter plot diagrams show Pearson correlation analysis between (C) bulk conventional CD4+ T cells and their subsets, as well as (D) bulk Treg cells and Treg cell subsets with age. Age (in years) and frequencies of Treg cell subsets are shown on the x and y axes, respectively. (E) Scatter plot diagrams show Pearson correlation analysis between frequencies of Treg cell and conventional CD4+ T cell subsets. Frequencies of conventional CD4+ T cells and Treg cell subsets are shown on the x and y axes, respectively. n = 53. The respective Pearson correlation coefficients (r) are reported in each plot. *P < 0.05 and ****P < 0.00005.
Fig. 2.
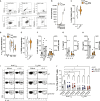
Fig. 2.. Phenotypical and functional ex vivo characterization of CD4+ TCONV cell and Treg cell subsets.
(A) MFI of CD25 and FoxP3 of CD4+CD25+FoxP3+ Treg cells. n = 12. Black lines indicate the mean with SEM. Ex vivo isolated and unstimulated PBMCs were analyzed by flow cytometry on the basis of extracellular, intracellular, and intranuclear proteins labeled with fluorochrome-conjugated monoclonal antibodies. n = 12. Frequencies within Treg cell and conventional CD4+ T cell subsets of CD31 (B), Ki-67 (C), and CD134 (D). n = 6. Results are presented as means ± SEM. Normalized (E) CD45RO, (F) CD45RA, (G) GZMA, (H) ceramide synthase 6 (CERS6), and (I) KLRG mRNA expression in ex vivo fluorescence-activated cell sorted (FACSorted) CD4+CD25+FoxP3+ Treg cell subsets. Depicted are floating bars indicating minimum and maximum values and a line indicating the mean. n = 3. (J) Gating strategy for analyzing ex vivo proinflammatory cytokine production by conventional CD4+ T cells and CD4+CD25+FoxP3+ Treg cells. PBMCs were stimulated with phorbol 12-myristate 13-acetate (PMA)/ionomycin for 6 hours, permeabilized, and intracellularly stained for IFN-γ (K) and IL-2 (L). Illustrated are density plots of flow cytometry data of one representative donor. n = 32 for IFN-γ and n = 24 for IL-2 expression, respectively. Black lines in violin plots show the median. In (A) to (L), statistical significance for differences between cell subsets was determined by two-way ANOVA with Tukey multiple comparison correction *P ≤ 0.05; **P ≤ 0.01; ***P ≤ 0.001; ****P ≤ 0.0001. (M) Suppression capacity of ex vivo isolated Treg cell subsets. Freshly isolated PBMCs were FACSorted for Treg cell subsets and CD4+CD25 TCONV cells serving as TRESP cells and to control for Treg cell–specific proliferation suppression. Carboxyfluorescein diacetate succinimidyl ester (CFSE)–labeled TCONV cells were cocultured with increasing numbers of Treg cells and stimulated with anti-CD3/CD28–coupled microbeads. After 96 hours of culture, proliferation was assessed on the basis of CFSE signal. n = 3. Results are presented as means ± SEM.
Fig. 3.
Fig. 3.. TCR diversity and FoxP3-locus methylation analyses of the distinct Treg cell memory differentiation subsets.
(A) TCRβ repertoire analysis of ex vivo FACSorted Treg cell subsets. n = 2. Mean data are shown. (B) Intuitive view depicting the relative proportions of the top 10 clones of each Treg cell subset of one donor. (C) Ex vivo FACSorted Treg cell subsets were analyzed by quantitative polymerase chain reaction (PCR) to define the percentage of TSDR demethylation. n = 3. Results are presented as means ± SEM. (D) Weighted average DNA methylation in partially methylated domains (PMDs) and highly methylated domains (HMDs) based on reduced representation bisulfite sequencing (RRBS) data. Weighted average methylation in PMD and HMD: RRBS data to determine the weighted average DNA methylation across defined DNA segments, divided into PMD and HMD. A loss of methylation is observed in the order: TregN > TregNLM > TregCM > TregEM. The loss of methylation is more prominent in PMDs. n = 6. Statistical significance for differences between TN, TSCM, TCM, and TEM cells but not bulk conventional CD4+ T cells was determined by t test.
Fig. 4.
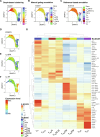
Fig. 4.. CITE-seq between CD4+ T cells and Treg cells.
(A to F) UMAP representation of FACSorted Treg cells (n = 7) and CD4+ T cells (n = 4) based on top 1000 highly variable genes. (A) Color-encoded cluster membership of unsupervised graph-based clustering using the Louvain community detection method. (B) Distribution of manually gated subsets is shown. Subsets were defined by applying the flow cytometry gating strategy on CITE-seq surface epitope expression levels. (C) Distribution of external cell type identities. Single cells were automatically labeled leveraging two publicly available datasets from bulk RNA-sequenced FACSorted established TH and Treg cell populations. TFH, T follicular helper. (D to F) Gene expression of canonical Treg cell markers. Blue to red rainbow color scale denotes low to high expression. (G) Heatmap representation of average expression of top differentially expressed genes between manually gated subsets.
Fig. 5.
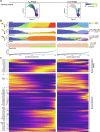
Fig. 5.. Trajectory analysis confirms T cell differentiation into distinct Treg and TH cell lineages.
(A) UMAP representation based on top 1000 highly variable genes (same as Fig. 4) color-encoded for pseudo-time and UMAP-embedded, higher-dimensional differentiation trajectories for Treg cell (left) and TCONV cell (right) lineages. (B) Distribution of cell identity labels and clonal expansion along the lineage trajectories. Pseudo-time values were quantized and binned into uniform cellular distribution for each lineage. Bottom: Average pseudo-time values per bin. Top: Distribution charts for labels assigned by graph-based clustering, manual gating annotation, and reference-based annotation with the same color-coded as in Fig. 4 (A to C). Cells that could not be assigned a label (none) or a clonotype are shown in light-gray. (C) Heatmaps depict the expression of surface epitope markers (top) and expression of differentially regulated genes over pseudo-time and between lineages (bottom). Expression levels were smoothed over pseudo-time trajectories depicted in (A) and (B), respectively. Hallmark differentiation genes, Treg cell functional genes, and master transcription factors are highlighted. ADT, antibody derived tag.
Fig. 6.
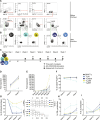
Fig. 6.. FACS strategy for isolating Treg cell subsets—expansion capacity, assessment of Treg cell subset–specific phenotypic, and functional characteristics during expansion.
(A) FACS strategy for isolating Treg cell subsets. The lymphocyte population was gated for singlets, and CD4+ T cells and bulk Treg cells were further defined as CD25highCD127low. From bulk Treg cells, TregCM and TregEM cells were defined as CD45RACCR7+ and CD45RACCR7, respectively. CD45RO+ cells were excluded to further identify and isolate CD95+CCR7low TregNLM cells and CD95CCR7+ TregN cells. All Treg cell populations sorted for expansion are highlighted. FSC-W, Forward Scatter Width; SSC-H, Side Scatter Height; SSC-W, Side Scatter Width. (B) Treg cell population purity was assessed after FACS. (C) FACSorted Treg cell populations were stimulated with anti-CD3/CD28–coated microbeads on day 1 and weeks 1, 2, 4, and 6 (indicated by dots) in the presence of rhIL-2 and rapamycin. Phenotypic and proinflammatory cytokine analysis was performed after 3, 5, and 7 weeks of expansion (indicated by triangles). (D and E) Fold expansion of Treg cell subset–derived cells from a close-up view of weeks 2 to 3 (D) and weeks 2 to 7 (E). n = 6. Results are presented as means ± SEM. (F to I) Examination of the Treg cell subsets phenotypically and functionally during in vitro expansion. (F) Change of Treg cell lineage markers CD25 and FoxP3 of Treg cell subset–derived cells over the entire expansion period of 7 weeks. n = 6. Results are presented as means ± SEM. (G) Changes in the initial naïve/memory phenotype during 7 weeks in culture using their CD45RA and CCR7 expression profile. (H and I) Proinflammatory cytokine production of cultured Treg cell–derived subsets. Treg cell subset–derived cells were stimulated at indicated time points with PMA/ionomycin for 6 hours and stained for IFN-γ (H) and IL-2 (I). For (F) to (I), n = 6. Results are presented as means ± SEM. For (G), statistical significance for differences between cell subsets was determined by two-way ANOVA with Tukey multiple comparison correction. *P ≤ 0.05; **P ≤ 0.01; ****P ≤ 0.0001.
Fig. 7.
Fig. 7.. Dynamics of transcription factor expression and Treg cell subset–specific functional and epigenetic characteristics during expansion.
(A) Expression patterns of transcription factors GATA3, RORγt, and Tbet versus FoxP3 in expanded bulk Treg cells and Treg cell subsets. FACSorted Treg cell populations were cultured according to strategy presented in Fig. 6 (A and B). Cells were stained intracellularly for CD3 and respective transcription factors. Illustrated are density plots of flow cytometry data of one representative donor at day 35 after culture initiation. (B) Bulk Treg cells and Treg cell subsets were analyzed for the transcription factors GATA3, RORγt, Tbet, and FoxP3 after 21, 28, 35, and 42 days of expansion. Quantified data from three donors are presented. Results are presented as connected data points (days) and mean. (C) Cytokine production profiles of expanded Treg cell subsets: IL-4, IL-5, IL-10, IL-13, IL-17, GM-CSF, IFN-γ, and TNFα cytokine production was evaluated in supernatants derived from bulk Treg cell–and Treg cell subset–derived cultures at indicated time points (days 21, 28, and 35) upon 24 hours of αCD3/28 stimulation (Meso Scale Diagnostics assay). n = 3. (D and E) Suppression capacity of expanded Treg cell subset–derived cells. In vitro expanded Treg cell subset–derived populations were cocultured with freshly isolated autologous CFSE+CD3+ TRESP cells and stimulated with αCD3/CD28-coated microbeads for 96 hours. Proliferation of CD4+ and CD8+ TRESP cells was analyzed by CFSE dilution. Percentage suppression of CD4+ and CD8+ TRESP cell proliferation at different TRESP:Treg cell ratios after 3 weeks of expansion. n = 6. Results are presented as means ± SEM. (F) Expanded Treg cell subset–derived cells were analyzed by bisulfite amplicon sequencing of the TSDR to define the percentage of TSDR demethylation (weeks 3, 5, and 7). n = 6. Results are presented as means ± SEM. For (F) to (H), statistical significance for differences between cell subsets was determined by two-way ANOVA with Tukey multiple comparison correction. *P ≤ 0.05; **P ≤ 0.01; ***P ≤ 0.001; ****P ≤ 0.0001.
Fig. 8.
Fig. 8.. Improved Treg cell products by prior depletion of EM-like Treg cells.
(A) Analyses of the effect of depleting the EM-like Treg cell subset before manufacturing the Treg cell product. We used a FACS to deplete EM cells (CD45RACCR7) from the initial Treg cell population (Treg − EM). n = 6. Illustrated are density plots of flow cytometry data derived from the FACS of one representative donor. (B) Fold expansion of bulk Treg cell–and Treg − EM–derived cells of days 7 to 21. n = 6. (C) Treg cell lineage markers CD25 and FoxP3 of bulk Treg cell–and Treg − EM–derived cells at day 21. n = 6. Black lines in violin plots show the median. (D) Memory phenotypes of bulk Treg cell–and Treg − EM–derived cells at day 21. Black lines in violin plots show the median. n = 6. (E) Expanded bulk Treg cell–and Treg − EM–derived cells were analyzed to define the percentage of TSDR demethylation at day 21. Black lines in violin plots show the median. n = 6. (F to H) Impact of TregEM cell subset depletion on effector cytokine production. IL-4, IL-5, IL-13, GM-CSF (F), IL-17, IL-10 (G), IFN-γ, and TNFα (H) cytokine production was evaluated in supernatants derived from bulk Treg cells and Treg − EM at day 21 upon 24 hours of αCD3/28 stimulation. n = 3. (I and J) To evaluate the propensity of Treg cells to dedifferentiate into TH17 cells, a TH17 cell differentiation assay was performed. Treg cells were isolated and either left as bulk Treg cells or depleted of TregEM cells. Treg and Treg − EM cells were expanded for 14 days and then exposed to inflammatory conditions for another 7 days prior. Cells were restimulated with PMA/ionomycin and stained intracellularly for IL-17A. (I) Representative flow cytometry density plots and quantification (J) of IL-17A production of bulk Treg cell (left) and Treg − EM cultures, IL-6Rα knockout (KO), gp130 KO and wild-type (WT) Treg cells, respectively. n = 5. Statistical significance for differences between cells was determined by paired t test, two-tailed. *P ≤ 0.05.

References

    1. Sakaguchi S., Yamaguchi T., Nomura T., Ono M., Regulatory T cells and immune tolerance. Cell 133, 775–787 (2008). - PubMed
    1. Roemhild A., Otto N. M., Moll G., Abou-El-Enein M., Kaiser D., Bold G., Schachtner T., Choi M., Oellinger R., Landwehr-Kenzel S., Juerchott K., Sawitzki B., Giesler C., Sefrin A., Beier C., Wagner D. L., Schlickeiser S., Streitz M., Schmueck-Henneresse M., Amini L., Stervbo U., Babel N., Volk H.-D., Reinke P., Regulatory T cells for minimising immune suppression in kidney transplantation: Phase I/IIa clinical trial. BMJ 371, m3734 (2020). - PMC - PubMed
    1. Landwehr-Kenzel S., Mueller-Jensen L., Kuehl J. S., Abou-El-Enein M., Hoffmann H., Muench S., Kaiser D., Roemhild A., von Bernuth H., Voeller M., Schmueck-Henneresse M., Gruhn B., Stervbo U., Babel N., Volk H. D., Reinke P., Adoptive transfer of ex vivo expanded regulatory T-cells improves immune cell engraftment and therapy-refractory chronic GvHD. Mol. Ther. 30, 2298–2314 (2022). - PMC - PubMed
    1. Oo Y. H., Ackrill S., Cole R., Jenkins L., Anderson P., Jeffery H. C., Jones N., Jeffery L. E., Lutz P., Wawman R. E., Athwal A. K., Thompson J., Gray J., Guo K., Barton D., Hirschfield G. M., Wong T., Guest P., Adams D. H., Liver homing of clinical grade Tregs after therapeutic infusion in patients with autoimmune hepatitis. JHEP Rep. 1, 286–296 (2019). - PMC - PubMed
    1. Amini L., Kaeda J., Fritsche E., Roemhild A., Kaiser D., Reinke P., Clinical adoptive regulatory T cell therapy: State of the art, challenges, and prospective. Front. Cell Dev. Biol. 10, 1081644 (2023). - PMC - PubMed

Publication types

Substances

LinkOut - more resources